ACADEMIC DISCIPLINE: Master Thesis in Quality Improvement and Leadership in Health and Welfare. (30hp) AUTHOR: Andreas Gremyr
SUPERVISOR: Bo Bergman, Professor Emeritus JÖNKÖPING: 2016 May
Usefulness of Statistical Process Control in Improving
Psychiatric Care
Summary
Healthcare is facing great challenges and psychiatric care is no exception. Extensive attempts to improve quality are made. It is essential to use methods that enable learning from experience, to improve performance. The core feature of Statistical Process Control (SPC), the control charts, are in use in various settings to enable learning and to support quality improvement work, but its use in psychiatric settings are scarce. This master´s thesis explores the usefulness of control charts, in quality improvement work. This was done in a case study at a department of psychosis by addressing two questions related to: a) control chart’s contribution to knowledge on if, when, where and how changes occur, and 2) how usefulness of control charts is perceived at the department. Control charts were applied to important variables and development officer’s and manager’s thoughts on usefulness were analysed using pattern matching. The use of charts shows shifts and differences between wards related to ongoing improvement projects. There is a readiness to start using control charts. The perceived usefulness matches the benefits and challenges identified in literature.Control charts as a tool supporting continuous improvement work in a psychiatric context, has a great potential still awaiting its use.
Key words: Statistical Process Control, Control Charts, Psychiatry, Schizophrenia, Quality Improvement
Sammanfattning
Hälso- och sjukvården står inför stora utmaningar och psykiatrin likaså. Omfattande insatser görs för att förbättra kvaliteten på vården. Det är viktigt att använda metoder som möjliggör lärande för att kunna förbättra vårdens resultat. Statistisk processtyrning och styrdiagram används inom vitt skilda delar av sjukvården för att möjliggöra lärande och för att stödja kvalitetsutveckling, men användandet inom psykiatrin verkar vara minimalt. Denna mastersuppsats undersöker användbarheten av
styrdiagram för kvalitetsutveckling i psykiatrisk vård. Detta är gjort genom en fallstudie på en psykiatrisk klinik som adresserar två frågor relaterade till vilken kunskap styrdiagram kan bidra med när det gäller: a) om, när, var och hur förändring sker och, b) på vilket sätt styrdiagram upplevs som användbara på kliniken. Styrdiagram användes på centrala variabler och verksamhetsutvecklares och chefers tankar om användning samlades in och analyserades. Styrdiagram har potential att visa när förändringar sker och skillnader som finns mellan avdelningar. Det finns en beredskap att börja använda styrdiagram. Den upplevda användbarheten av styrdiagram matchar fördelar och utmaningar funna i litteraturen. Som ett verktyg för att stödja kontinuerligt förbättringsarbete i psykiatrin, har styrdiagram en stor potential som väntas på att tas tillvara.
Table of Contents
1.
Introduction ... 4
2.
Background ... 5
2.1 On Quality Improvement (QI) and the Science of Quality Improvement ... 5
2.2 Making sense of the variation - Statistical Process Control and Control Charts .... 8
2.3 Benefits and challenges of statistical process control and control charts ... 10
2.4 Diffusion of SPC as an innovation in psychiatry ... 13
3. Purpose ... 14
4.
Methods ... 15
4.1 The Context ... 16
4.2 Method for improvement work – applying control charts ... 16
4.3 Method for the study of the improvement work – perceived usefulness... 18
4.3.2 Ethical considerations...20
5.
Results ... 21
5.1 Results from the improvement work - applying control charts... 21
5.2 Control Charts ... 23
5.3Results from the study of the improvement work – perceived usefulness ... 29
6.
Discussion ... 31
6.1 Revisiting purpose ... 31
6.2 Improvement work – applying control charts ... 31
6.3 Study of improvement work – perceived usefulness ... 32
6.4 Conclusions ... 35
6.5 Implications for improvement work ... 35
6.6 Suggestions for further research ... 35
References ... 37
1. Introduction
Health care is facing great challenges, partly due to an aging population, a greater demand for more specialized care and increased expectations. Mohrman and Shani (2012) summarizes the situation, saying that health care needs “to deliver more with less” (p. 2). High-quality care is characterized as being safe, knowledge-based, effective, efficient, equal, and focused on the patient (IoM, 2001; WHO, 2006) and yet reminders appear over and over again on the arbitrariness of care, the inequity and flaws in how care is delivered.
According to WHO (2016) mental and substance use disorders are the leading cause of disability worldwide. Mental disorders are important risk factors for other diseases. Inequity and stigmatization are some of the great challenges to handle for psychiatry and the society (WHO, 2016a). Schizophrenia, is one of the most severe psychiatric chronic disorders, and accounts for 1,1% of Disability Adjusted Life Years (DALYs; Rossler, Salize, van Os, & Riecher-Rossler, 2005) worldwide, with a point prevalence of 4.6 out of 1000 persons (Saha, 2005). It shortens life expectancy by two decades (Tihonen, 2009). Various reports by the National Board of Health and Welfare (2011a, 2011b, 2011c, 2011d) point out shortcomings of health care for patients with psychosis in Sweden. Possible rooms for improvement are pointed out in national and international reports (SBU, 2012; Docteur & Coulter, 2012), e g the potential benefits of increased partaking in care-planning by patients and their next of kin.
Extensive attempts to improve quality are made in healthcare (Marshall & Øvretveit, 2011), however 70% of change initiatives in organisations fail according to Beer and Nohria (2000). Even though evidence is scarce but promising about its efficacy, quality improvement (QI) could be a natural way to address increasing costs in health care and the demand for a more equal care (Marshall & Øvretveit, 2011). Healthcare is argued to be complex (Glouberman & Zimmerman, 2002) in the sense that it involves a large number of elements interacting in a non-linear manner, making it hard to foresee consequences of actions and impact from ever-changing contextual factors. Solutions cannot be imposed, but emerge from circumstances (Snowden & Boone, 2007).
In the pursuit of improving quality, it is essential to use methods that enable learning from experience and actions, to improve future performance (Provost, 2011). The ability to detect real change from random variation in the way care is being delivered is crucial in developing good care (Berwick, 1991; Sherlaw-Johnson & Bardsley, 2016). Standard texts on quality improvement in healthcare typically address the usefulness of Statistical Process Control (SPC) in order to track changes, increase learning over time and to continuously improve health care (Provost & Murray, 2011; Langley et al., 2009; Carey, 2003). The core feature of SPC, the control charts, are in use in various settings within healthcare to enable learning and to support QI work, but its use in psychiatric settings are scarce. This master´s thesis explores the usefulness of SPC, and especially the control charts, in quality improvement work, for managers and practitioners in psychiatric care. This was done in a case study at a psychosis department at a major hospital.
2. Background
In order to explore the usefulness of SPC for quality improvement work in psychiatry, the following paragraphs describe what QI is and explore its scientific basis through taking a closer look at Deming´s ‘profound knowledge’ (1994) and its four elements needed in QI: ‘appreciation of a system’, ‘understanding variation’, ‘theory of knowledge’ and ‘psychology’. Further follows elaboration on how to make use of variation by using SPC and control charts before the use of SPC in psychiatry is explored, looking at published articles.
2.1 On Quality Improvement (QI) and the Science of Quality Improvement
QI in health care could be defined as “the combined and unceasing efforts of everyone—healthcare professionals, patients and their families, researchers, payers, planners and educators— to make the changes that will lead to better patient outcomes (health), better system performance (care) and better professional development (learning)” (Batalden & Davidoff, 2007, p.2). Two bases of knowledge are needed, according to Batalden and Stoltz (1993), the professional knowledge to improve diagnostics and treatments, and improvement knowledge to improve processes and systems. A linkage between those two bases support improvement of outcomes.
A scientific base for improvement knowledge has been proposed, a “science of improvement” (Berwick, 2008; Bergman et al. 2015). The origin of this science could be related to the quality improvement pioneers of the early 20th century, e.g. Shewhart, Deming and Juran (Bergman & Klefsjö, 2010 Bergman 2015). The use of the term improvement knowledge (Batalden & Stoltz, 1993) relates to Deming’s elements of profound knowledge (1994) and most descriptions of a science of improvement has that stance (Bergman, 2015). Knowledge on the elements and how they interrelate is important for every improvement effort (Langley et al., 2009). The four elements of profound knowledge are elaborated on in the following.
2.1.1 Appreciation of a system
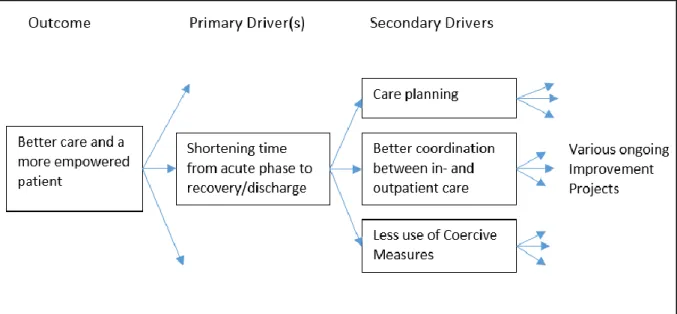
Entities working together to achieve the same goal could be seen as a system (Deming, 1994). The interaction between the actors in the system affects to what degree mutual goals are achieved. Knowledge on, or appreciation of, a specific actor´s role in the system in relation to other actors in the system is important in order to support the process towards the goal. What is seen as a natural way to enhance performance in one part of the system does not necessarily serve the greater goal for the whole system. By analyzing the system, in terms of organizational and individual goals and knowledge on how the system works, can support action towards greater quality. Knowledge on systems has increased since the days of Deming. Examples as Senge (1994), and Glouberman & Zimmerman (2002) have contributed to the understanding of how to understand, relate and interact with and within systems. Another contribution, a tool that takes the system into account when understanding where and how improvement projects can affect the desired outcome is the driver diagram (Langley et al., 2009). By linking the desired outcome to primary and secondary drivers, a visualization of how work with different outcomes can contribute to the overall goal is created. (See figure 8)
2.1.2 Understanding Variation
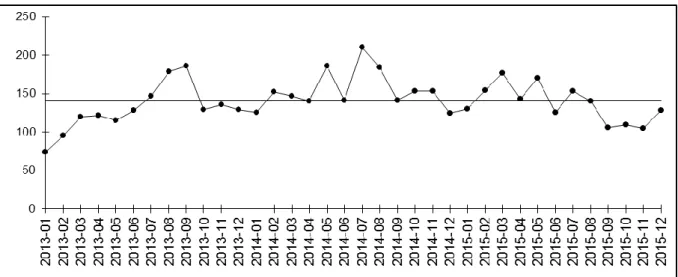
Variation is present in all care processes. According to Batalden and Stoltz (1993), “Understanding variation over time is a key to recognizing and using differences observed for the purpose of continual improvement”. (p 429) Variation over time, diachronic variation differs from another kind of variation present in health care settings, the synchronous variation. Synchronous variation is the variation present at the same moment. It could be the difference between patients or hospitals. Data shown on a national level, like league tables with regional comparisons (e.g. the Swedish “Öppna jämförelser”, National Board of Health and Welfare, 2015) has historically focused only on synchronous variation to show differences between regions and hospitals. The diachronic variation is powerful in assessing how a process has changed historically. A run-chart (Perla et al., 2011) is an easy way to explore variation over time by plotting data points chronologically. (See figure 1.)
Figure 1. A run-chart showing variation over time and the median.
Distinguishing the type of variation present in a process is critical since it prompts different kinds of actions. Shewhart (1931) suggested that variation can be seen as having different causes. Deming (1986) referred to them as common causes and special causes. Common cause variation in a process could be related to a multitude of sources, but the result cannot be directly related to an event or a single cause. It is the random variation that is the product of the inherent “noise” in the system created by the variety of patients, variety of procedures and other aspects that vary over time. The result produced by the system will be predictable and the variation will stay within statistically determined limits. Along with common causes there can also be special causes, or assignable causes, an almost similar concept introduced by Shewhart (1931). Those are causes that generally are known, obvious, or can be discovered. However, when there is an assignable cause of variation, a sudden event, that affects the process, the process is not predictable within limits any longer. In a stable process with no assignable causes of variation, a fundamental change in the system is needed, to produce a better outcome. In an unstable process, that is, a process with one or many assignable causes of variation, improvement work should first focus on identifying and handling the assignable causes rather than fundamentally improve the system and its performance. Mixing up those two, the different approaches of actions determined by the types of variation, can possibly increase undesired variation. In order to
use variation to track shifts and make a prognosis on future outcomes of the process, control charts can be used. Further elaboration on the use of SPC and control charts are made in paragraph 2.2.
2.1.3 Theory of knowledge
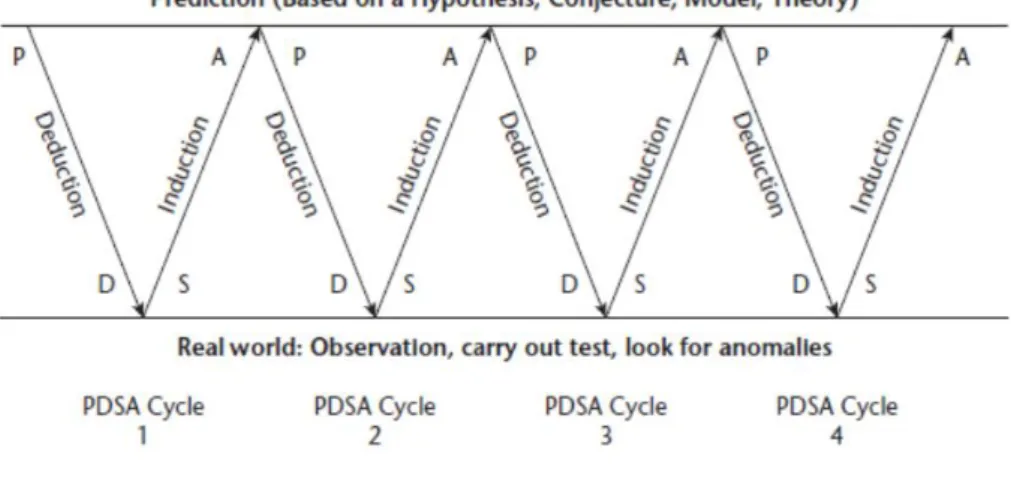
Gaining knowledge through the use of data in providing a rational basis for action can be done either in enumerative studies or analytic studies (Deming, 1975). Enumerative studies are made in order to draw conclusions from analysing material in a frame, often to make an estimation, to generalize from a sample. Traditional ways of generating knowledge in healthcare by studying the outcomes of treatment, like randomized controlled trials (RCTs) are in that sense enumerative. The aim is to answer the question: “Does this intervention work under ideal circumstances?” On the contrary, QI is almost always focused on analytic studies (Langley et al., 2009), studying how a process generated the material in a frame. The aim is to predict and increase possibility to choose the alternative that will be superior to the others in the future of the process under study. Improvement work is embedded in the context and this embeddedness is crucial in getting organizational learning and continuous improvement on the road (Berwick, 2008). It is important that improvement initiatives affect the whole system, so that better quality is achieved. Analytical studies focusing on time-series data are a valuable source for organizational learning and quality improvement efforts in taking action towards greater performance (Provost, 2011; Toulany, 2013). Deming proposes a view on knowledge that could be seen as pragmatic, evolving through testing. The PDSA-cycle (Plan, Do, Study and Act), or the Shewhart cycle, as Deming first put it (Moen & Norman, 2006) summarizes Deming’s theory of knowledge. Improvements and greater learning can be achieved by planning and doing experiments, studying and reflecting on the results and acting out of a broader base of knowledge acquired through the continuous cycle of experiments. (Figure 2)
Figure 2. Generating knowledge through prediction, using the PDSA circle. (Langley et al. 2009) 2.1.4 Psychology
Appreciation of a system helps us understand how different parts of a system interacts in order to achieve a mutual goal while the element of psychology helps us understand the interaction between
crucial, since it drives behavior (Langley, 2006). Motivation is also related to values and goals. As humans we a more prone to commit to value-congruent goals and use ways of working that harmonizes with experiences and beliefs. Improvement work involves changes in how we do things or what products or machines we use. Rogers (1986) five attributes, or determinants, form a framework that can be of use in understanding the conditions related to implementing new ways of working. New ways of working in health care, just as new machines or products, can be seen as innovations. Greenhalgh (2004) defines innovations as: “a set of behaviors, routines and ways of working, along with administrative technologies and systems, which are linked to providing or supporting health care, implemented in a planned way, and discontinuous with previous practice and perceived as new by a proportion of key stakeholders, and directed at improvement.” (p. 582) The perceived usefulness and speed of diffusion of any innovation depends to a large extent on contextual factors (Rogers, 1983; Greenhalgh et al, 2004; Bate, 2014). From an adopter’s point of view, an innovation could have different attributes that possibly affect its diffusion in a certain context.
Table 1. Roger’s (1986) attributes affecting diffusion of innovations. Attributes Description from Rogers (1986)
Relative advantage “…is the degree to which an innovation is perceived as being better than the idea it supersedes.” (s 213)
Compatibility “…is the degree to which an innovation is perceived as consistent with the existing values, past experiences, and needs of potential adopters.” (s 223)
Complexity “…is the degree to which an innovation is perceived as relatively difficult to understand and use.” (s 230)
Trialability “…is the degree to which an innovation may be experimented with on a limited basis.” (s 231)
Observability “…is the degree to which the results of an innovation are visible to others.” (s 232)
2.2 Making sense of the variation - Statistical Process Control and Control
Charts
It is important to track variation over time since different kinds of variation prompts different kinds of actions. The core tools in SPC-methods are the control charts. If the data is, for example, normally distributed, random variation will stay between a upper control limit (UCL; mean + 3 sigma) and a lower control limit (LCL; mean – 3 sigma) in about 99,73% of the cases.
Figure 3. The normal distribution and percentage within +/- 3 sigma. Adapted from Montgomery and Woodall, 2008.
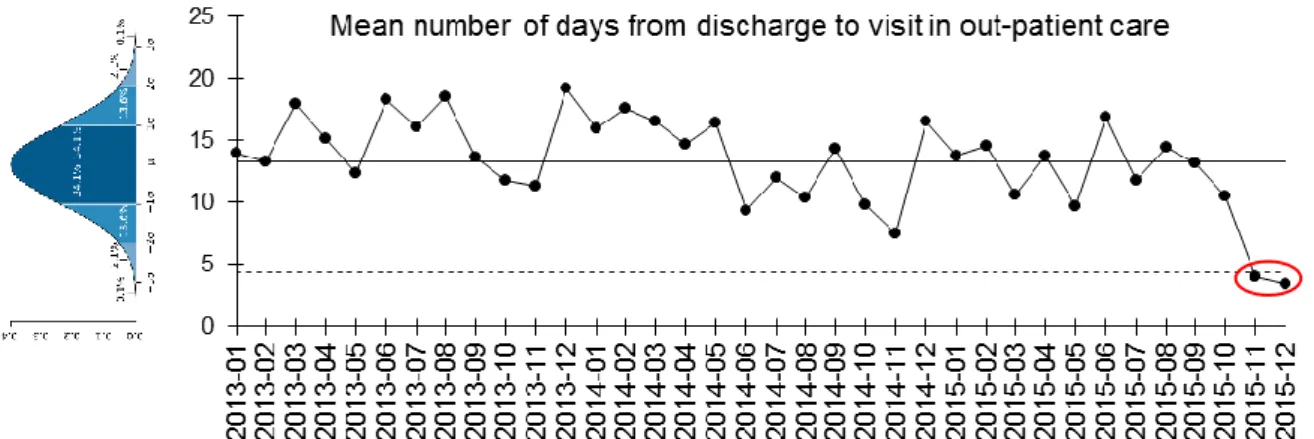
If all data is randomly normally distributed the process is under statistical control and “stays” within the control limits. (See figure 3) The variation in the process has “common cause variation” (Shewhart, 1931). Rules can be applied to detect when the process no longer is under control and there is a “special cause variation”; a significant event or shift in the process (Provost & Murray, 2011). Figure 4 shows one example of a signal of special cause variation. Rules on how to analyze control charts in order to track signals can be found in e.g. “The Health Care Data Guide” (Provost & Murray, 2011).
Figure 4. A tilted bell-curve showing normal distribution along with a I-chart showing mean number of days from discharge to visit in out-patient care, showing a signal the last two months. (Data-points below lower control limit).
There are many different kinds of control charts that can be used depending on the distribution of the data, whether it is attribute-data or variables-data that is analyzed and also depending on the purpose of the charts use (Benneyan, 2003). The characteristics of the various control charts can vary a lot. See table 2 for examples.
UCL LCL
Table 2. A selection of different control charts relevant to this thesis, for example, the otherwise useful C-chart is not included.
Control Chart Description Use
I-chart (or XmR-chart) Individual values (and moving range chart)
Chart for measurement data were each data point is composed of a single value. (Carey, 2003)
P-chart Percent or proportions
(binominal distribution)
For use on data of nonconforming units (numerator) vs all (denominator). (Carey, 2003)
EWMA-chart Exponentially moving average
Chart to detect small but lasting shifts. (Flaigh, 2014) and to handle
overdispersion (Sherlaw-Johnson & Bardsley, 2016). Every point in the chart consists of a mean of earlier data, where more weight is given to more recent data. (Roberts, 1959; Provost & Murray, 2011)
2.3 Benefits and challenges of statistical process control and control charts
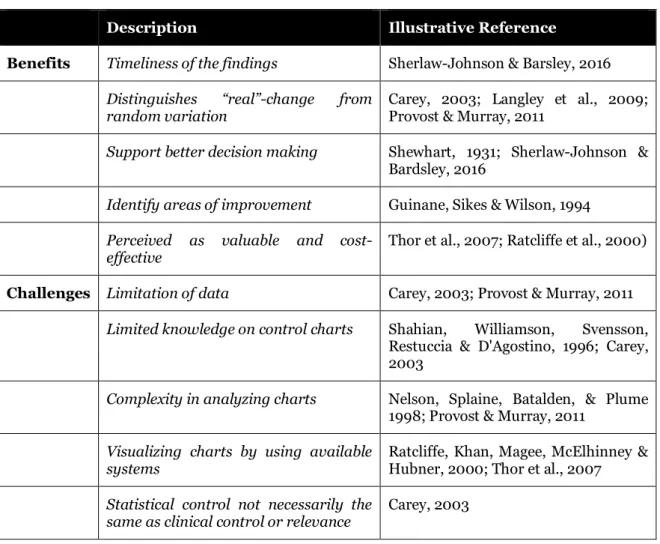
The use of statistical process control (SPC) and control charts originates from industry, but its application in health care has increased (Woodall, 2012). A review article written by Thor et al. (2007) pointing to the usefulness of SPC in various settings, lists benefits, limitations, barriers, and factors or conditions facilitating application of SPC in health care. By grouping them and relating those to standard texts (e.g. Carey, 2003; Provost & Murray, 2011; Langley, 2009; Sherlaw-Johnson & Bardsley, 2016) on the use of SPC in health care, five benefits and five challenges are highlighted (table 3).
Table 3. Synthesis of theoretical propositions on benefits and challenges.
Description Illustrative Reference
Benefits Timeliness of the findings Sherlaw-Johnson & Barsley, 2016
Distinguishes “real”-change from
random variation Carey, 2003; Langley et al., 2009; Provost & Murray, 2011
Support better decision making Shewhart, 1931; Sherlaw-Johnson & Bardsley, 2016
Identify areas of improvement Guinane, Sikes & Wilson, 1994
Perceived as valuable and
cost-effective Thor et al., 2007; Ratcliffe et al., 2000)
Challenges Limitation of data Carey, 2003; Provost & Murray, 2011
Limited knowledge on control charts Shahian, Williamson, Svensson, Restuccia & D'Agostino, 1996; Carey, 2003
Complexity in analyzing charts Nelson, Splaine, Batalden, & Plume 1998; Provost & Murray, 2011
Visualizing charts by using available
systems Ratcliffe, Khan, Magee, McElhinney & Hubner, 2000; Thor et al., 2007
Statistical control not necessarily the
same as clinical control or relevance Carey, 2003
2.3.1 Potential benefits
Timeliness of the findings – Traditional ways of making summative evaluations in health care demand,
in many cases, long time, due to a focus on pre- and post-measurement. The use of control charts has the potential to signal when and where changes occur and can therefore provide earlier feed-back on the effect of improvement work. (Sherlaw-Johnson & Bardsley, 2016).
Distinguishes “real”-change from random variation – Acting on a perceived shift in a process could potentially increase variation and worsen the situation if the shift derives from random variation (Carey, 2003). The possibility to distinguish special cause variation from common cause variation can support increased insight about the processes and help detecting whether there has been a change in the processes or not. This has been rendered as useful, e.g. in improvement work (Langley et al., 2009; Provost & Murray, 2011).
Support better decision making – The different types of variation present in a process prompts different kinds of action. When special cause variation is present, actions are needed to handle the specific source of variation while if only common cause variation is present a more thorough job is needed in order to change the outcome of the process. This was stated in the early writings of
Shewhart (1931) and is still prevailing in the health care sector according to Sherlaw-Johnson and Bardsley (2016). By knowing about the variation in a process more efficient actions can be taken. Identify areas of improvement – Visualizing processes using control charts can aid in identifying areas of improvement, as well as identifying whether certain areas have improved (Guinane, Sikes & Wilson, 1994).
Perceived as valuable and cost-effective –By being able to predict process outcome, the use of control charts in healthcare has in some cases been valuable for both clinicians and patients (Thor et al., 2007). Thor et al. (2007) also reviewed articles were the use of SPC were perceived as “a cost-effective method to provide timely feed-back” (Ratcliffe et al., 2000, p 1821). Considering psychology, one of the four elements of profound knowledge (Batalden & Stoltz, 1993), perceiving a tool as valuable could possibly say something about its compatibility with the motivation and the values of the users.
2.3.2 Challenges
Limitation of data – In order to draw conclusions on the variation present in a process, about 20-30 data points are needed (Carey, 2003; Provost & Murray, 2011). If no historical data is available it can take some time to collect data before conclusions can be drawn on the variation in the process.
Limited knowledge on control charts – Different variables need different types of control charts, and know-how knowledge is needed in applying them. The distribution of data has a central role and is handled by choosing a suitable chart. Distribution of data is also related to the possibility or the necessity to stratify, which is sub-grouping data at a level convenient for analysis. (Shahian, Williamson, Svensson, Restuccia & D'Agostino, 1996; Carey, 2003)
Complexity in analyzing charts – Various rules on how to “read” a control chart can aid analysis. These are valid for most of the charts commonly used, but when it comes to more advanced control charts (e.g. the exponentially weighted moving average-chart (EWMA-chart)(Roberts, 1959), the rules do not apply (Provost & Murray, 2011). Basic knowledge on the concept of variation and the rules are needed in order to make use of the charts and in some cases expert knowledge is needed (Nelson, Splaine, Batalden, & Plume 1998).
Limitations in visualizing charts by using available systems – Making control charts can be time consuming. There are examples of how the start of using integrated electronic information systems, to handle and visualize clinical data in control charts, makes it easier for the users (Ratcliffe et al., 2000). Whether available systems provide support for the use of SPC or not is a factor identified by Thor et al. (2007) as potentially affecting the application of SPC.
Statistical control is not necessarily the same as clinical control or relevance – The variation and its shifts over time can say something about common cause and special cause variation, but these concepts are not necessarily translatable to clinical relevance. A process that is in statistical control might be unacceptable from a clinical point of view, while a process with assignable causes of variation may be (so far) acceptable from a clinical point of view. Hence, knowledge on the clinical context is important when analyzing control charts in health care. (Carey, 2003)
2.4 Diffusion of SPC as an innovation
in psychiatry
Even though there are plenty of potential bene-fits in using SPC put forth in previous research, the diffusion of it is still sparse in health care (Thor, 2007). This is evident especially in psych-iatry. Searching Web of Science by using ("Mental Health" OR "Psychiatr*") AND -("Statistical process control" OR "Control Charts") shows that number of published articles are low. Only four articles were found
(Figure 5). Figure 5. Number of published articles per year on SPC in Psychiatry from Web of Science.
None of the articles addresses the general usefulness of SPC in a psychiatric context, or the use of SPC in improvement work in psychiatric care. Neither are potential benefits and/or challenges of SPC use mentioned.
3. Purpose
In psychiatric care, just as in healthcare in general, there exists a need to support continuous improvements and a need to use tools that can increase knowledge on when, how and where improvements occur. The use of SPC methods like control charts has proven to have several beneficial attributes and the Question arises: Can SPC support improvement work in a psychiatric context? This main question is decomposed into two subquestions:
A) If control charts are applied to important existing variables in a psychiatric context, can they contribute to knowledge on if, how, when and where change occurs during improvement work in psychiatry?
B) How is the usefulness of SPC perceived by development officers and managers in a psychiatric context?
4. Methods
This study was made with a single case study approach (Yin, 1994) in an attempt to apply systematic combining and an abductive logic in the explorative process. A linear approach, using case study methodology like the way it is traditionally described in methodology literature, simply do not take into account the potential of the interaction between the different elements, the context and the role of the researcher (Dubois & Gadde, 2002). Abductive logic or reasoning is simply put, inference to the best explanation available at the moment; an explorative process in a complex, changing context that enables an ongoing learning process. Dubois and Gadde (2002) explains further: “A standardized conceptualization of the research process as consisting of a number of planned subsequent ‘phases’ does not reflect the potential uses and advantages of case research. Instead, we have found that the researcher, by constantly going ‘back and forth’ from one type of research activity to another and between empirical observations and theory, is able to expand his understanding of both theory and empirical phenomena.” (p. 555) The process of going ‘back and forth has similarities with the process described in figure 2. (Langley et al., 2009). The possibility to learn in every PDSA-cycle and potentially change theoretical perspective between PDSA-cycles, due to a changing context or a more suitable theory, strengthens the idea of using abductive logic when studying quality improvement. Systematic combining, its abductive logic and the use of the PDSA-cycle, was considered to be in line with action research methodology where the researcher, embedded in the context, takes part in an action research cycle (figure 6., Cougland & Brannick, 2014), verysimilar to the PDSA-cycle mentioned earlier. The action research loop is central in generating both knowledge that helps solve local problems and to generate generalizable knowledge. The researcher and the practitioners have the same ambition and are equally important in the generation of knowledge useful in the process of system improvement (Aagaard Nielsen & Svensson, 2006).
Figure 6 The Action Research Cycle. (Coghland & Brannick, 2014.)
The appropriateness of using case studies to generate new knowledge has been discussed elsewhere, for example (Yin, 1994), but “learning from a particular case (conditioned by the environmental context) should be considered a strength rather than a weakness”, according to Dubois and Gadde
(2002. p.554). In-depth case studies are needed in order to gain understanding of the reciprocal relationship between a phenomenon and its context.
4.1 The Context
The Department of psychotic disorders at the Sahlgrenska University Hospital (the Department) serves the greater Gothenburg area, with a population of about 600 000 inhabitants, in assessment and treatment of schizophrenia and other psychotic disorders. The department´s six outpatient-units, three combined in- and outpatient units and four inpatient wards serve approximately 2600 patients and their next of kin yearly. One fourth of the patients spend time at the inpatient wards some time during a year. The core symptoms of psychotic disorders, including schizophrenia, are delusions, hallucinations, suspiciousness and hostility, as well as cognitive difficulties, apathetic behaviour and social withdrawal. Extensive research has addressed schizophrenia and possible treatments over the years. Contemporary treatments typically include pharmacological treatment, psychological and psychosocial treatments, and social support (SoS, 2003; SoS 2011 & SBU 2012).
4.1.1 Ongoing Improvement Work
The Department, which serves as the context of this case-study, has many ongoing improvement projects in order to better assess and treat psychotic disorders, and to create more value for patients and their next of kin. One example of ongoing improvement work is the Person Centered Psychosis Care project (the PCPC project). The PCPC project has during 18 months initiated various improvement projects at the four wards with a total of 48 beds. (See appendix I for an overview of some of the improvement initiatives.) Primarily the PCPC project focus on patient empowerment by addressing several areas of improvement, e.g. trying to increase patient partaking in making care plans, involving the patient´s network in the rehabilitation process, to lessen the need for coercive measures during compulsory care and to better coordinate in- and outpatient care. Another project is the implementation of Value Based Healthcare (VBHC). Implementation of VBHC has started in an attempt to monitor and measure outcome measures, process measures, risk-adjusting variables and costs, and develop how the Department support improvement work. The need to understand how improvement work affects the outcome of care given to patients is great.
4.2 Method for improvement work – applying control charts
Improvement work to enable the use of control charts in the psychiatric context was needed in order to answer the first sub-question on whether control charts contribute to knowledge on if, how, when and where change occurs in the organisation in focus. The intention was to find a fit between the characteristics of the variables, the functionality of the control chart and its possible use in the organisation to support quality work. This was done through three steps:
1) The use of a driver diagram (Langley et al., 2009) to pinpoint important concepts, related variables and visualise how they possibly are related to making better care.
2) Choose type of control chart to use for each variable depending on: data (variables or attribute data) and kind of distribution (binomial, Poisson or geometric).
3) Use the PDSA-cycle to find out more about the chosen variables in trying to use them in control charts.
4.2.1 Using a Driver Diagram
The driver diagram (Langley et al. 2009) was used to identify concepts and related variables that could be perceived as important in the quality improvement of the Department. Selection of variables was restricted to the ones available in the hospitals health information and administrative systems. The ambition was to include data for up to 3 years if valid data was available. Ongoing improvement work at the Department that affected the selection of relevant variables was especially the ongoing PCPC-project. Possible available balancing measures was selected to try to ensure that positive outcomes in one part of the organization did not result in negative outcomes in another part (Langley et al. 2009). 4.2.2 Trying out and choosing types of control charts
The type of control chart was chosen depending on the properties of the variables. The I-chart (Individuals chart also called XmR-chart) visualizes both the variation and the moving range. The moving range is the difference between every data-point in a chronological order. After consideration, since the moving range did not support any extra insight (Nelson, 1982, 1990; Roes, Does & Schurink, 1993), I-charts were used without plotting the moving range. When visualizing variables showing ratio, a P-chart (Percentage chart for binomial distribution) was used. Just like over dispersion is common in other complex contexts (Sherlaw-Johnson & Bardsley, 2016), some measures showed attributes of over dispersion in the data set, e.g. duration of hospital stay. Over dispersion is great or extreme variation that generally needs to be handled in order to generate useful visualizations (Sherlaw-Johnson & Bardsley, 2016). In health care, strange results and large variation, is not uncommon (Bergman, 2015). Over dispersion was handled in two ways: first, extreme outliers were removed and, secondly, two different methods were applied in the visualization of data: a) the Exponentially Weighted Moving Average (EWMA-chart; Roberts, 1959) and, b), calculating monthly means and applying an I-chart. Both methods decrease the impact of over-dispersion and were visualized separately. The EWMA-chart lessens the impact of single outliers. This was done by calculating a moving average that applies higher weights to more recent observations (Sherlaw-Johnson & Bardsley, 2016). The graph is smothered and not as spikey as over-dispersed data would be in a traditional Shewhart chart and is still sensitive to small process changes (Flaig, 2014). I-charts showing monthly means decrease the number of data points to one per month, decreasing the impact of single outliers while simplifying visualization.
4.2.3 A learning process - Using the PDSA
Applying control charts at the Department of Psychotic disorders was a learning process in a PDSA-manner. The Plan-Do-Study-Act cycle was applicable in three interrelated learning cycles: 1) Trying to find data that matches the concept intended to be measured in the driver diagram, 2) Trying out different control charts, and learning about the characteristics of the data, and 3) In a dialogue with co-workers, getting more information about clinically relevant questions and unexplored areas of interest related to the process mapped in the driver diagram.
4.2.4 Case-mix
Patients in health care are different and have different needs. In order to produce care tailored after every individual’s personal needs and preferences, the health care processes must handle the inter-patient-variation. This variation is both synchronous, in the sense that all patients within the process at a given time are heterogeneous, and diachronic, since patients in the process varies over time. This mix of patients, case-mix, can eventually affect variation to a large extent, so that an outcome of a process is not necessarily enhanced by improvement work but by a different case-mix of patients. Controlling for possible confounders would require access to a lot more data and the use of other statistical methods. In order to monitor case-mix changes in a way easy to apply, control charts of variation of gender and age was made. This was done by plotting age at discharge and frequency of discharges by women and men.
4.3 Method for the study of the improvement work – perceived usefulness
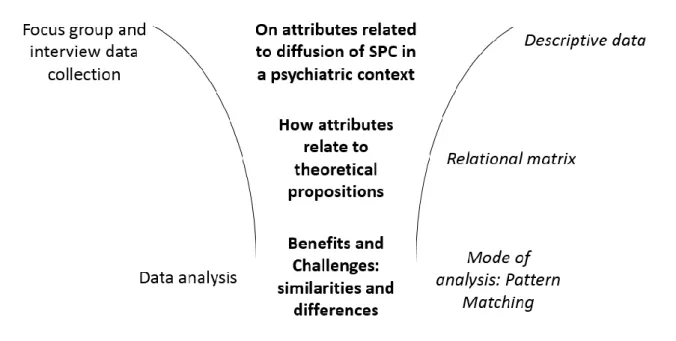
An explorative abductive approach was used in order to collect qualitative data on the usefulness of control charts. Starting off in the specific cases of variables related to ongoing improvement work, plotted in control charts, practitioners’ and managers’ attitudes, opinions and reflections were collected in a focus group. A focus group has the main aim to “understand and explain the meanings, beliefs and cultures that influences the feelings, attitudes and behaviors of individuals” (Rabiee, 2004. p. 655). Leading improvement work on the meso-level in a clinic, it takes more than one or a few persons to drive a change. Feelings, attitudes and behaviors of key members towards the use of control charts were therefore valued as an important predictor for use in future improvement work. A strategic selection was used. Participants all had operative and/or strategic responsibilities and a need to get an overview of the work and progress at the Department, in order to support improvement work. The focus on the meso-level directly addresses the organization´s need and wish to more efficiently monitor trends and shifts that are important in maintaining and developing good care. The dialog was recorded and transcribed. Due to a smaller number of participants than expected (4 out of 6) in the focus group, an additional interview was made. In total five participated, their roles being: Department coordinator, medical director for inpatient care, coordinator for research and education and two developmental officers. The focus group interview included an introduction to SPC and control charts, along with visualizations of selected variables in various control charts, both on an overall department level and ward level when applicable. Participants got information on selected themes in focus and were encouraged to express their views on the usefulness of control charts. Themes were selected to enable data collection that has been proven to affect the diffusion of innovations in health-care, from Greenhalg et al (2004) and affect diffusion of innovations over-all (Rogers, 1986). See table 1.
The focus group yielded descriptive data on participants’ views on attributes related to diffusion of SPC in a psychiatric context. Data on attributes were then related to the theoretical propositions on benefits and challenges in a relational matrix. A data analysis was made using pattern matching (Yin, 1994; Almutairi et al., 2014). in order to identify similarities and differences when it comes to benefits and challenges suggested in the theoretical propositions, and the experiences of the use of SPC reported in the focus group and the interview. The process from data collection in the focus group and the
Figure 7. From data collection to data analysis: getting descriptive data on attributes through focus group and interview, a relational matrix to relate them to theory and data analysis through pattern matching.
4.3.1 On trustworthiness
The concept of trustworthiness in qualitative research could be considered being the equivalent of validity and reliability in quantitative research (Guba, 1981). Several provisions (Shenton, 2004; Guba & Lincoln, 1985) has been considered in order to address trustworthiness and its four criteria; 1) credibility, 2) transferability, 3) dependability and 4) confirmability. The trustworthiness of the study of the usefulness of SPC in psychiatric care is discussed in the light of those concepts. Probably the most important factor contributing to trustworthiness, according to Guba and Lincoln (1985), is credibility. Several methodological provisions were made to enhance credibility (Guba, 1981, in Shenton, 2004);
a) ‘Adoption of well-established methods’ by using Rogers´ (1986) determinants of diffusion of innovations and Yin’s (1994) pattern matching method in investigating similarities and possible differences between theoretical propositions on benefits and challenges and the experience of informants in focus group and interview. It has not been investigated to what extent the combination of Roger’s attributes and Yin’s pattern matching has been used before.
b) ‘Tactics to ensure honesty in informants’ by using Roger´s attributes as themes for the focus group and interview instead of directly ask about possible benefits and challenges associated with the use of SPC.
c) ‘Debriefing sessions between researcher and superiors’, by regular supervision sessions with an experienced senior researcher.
d) ‘Peer scrutiny of project’ was enabled in regular discussions with peers and teachers at the masters programme at Jönköping Academy.
e) ‘Member checks of data collected and interpretations/theories formed’ was done by letting the informants comment on interpretations and translations of their statements as well as the texts describing the content.
f) ‘Triangulation of informants and methods’ by conducting both a focus group and a complementing interview with different informants.
g) ‘Examination of previous research to frame findings’ was the core in using pattern matching as a method, by mapping theoretical propositions and compare them to data collected in focus group and interview.
These methodological provisions also affected the study regarding the ethical considerations since trustworthiness to some extent overlap with the ethical aspects.
4.3.2 Ethical considerations
The use of patient records and similar data within Swedish healthcare is regulated by Swedish law (PDL; Patientdatalagen, 2008:355). It regulates the healthcare´s rights and obligations in using patient related data. One of the obligations is to make use of patient data in quality assurance and quality improvement work within the healthcare organization. Data related to the improvement work in this master thesis, and the work needed in order to enable use of control charts in the organization are framed within the PDL. Even though using healthcare data in visualizations using control charts could be seen as standard procedure, considerations have been done concerning to what degree of aggregation was needed in order to make data anonymous, not showing data that could be traced and be of harm to any patient. This was done trying to follow the good research practice according to the Swedish Research Council (Hermerén, 2011). When data is aggregated and single patients cannot be traced in the material, the healthcare organization decides when and where to use data and to what extent it is published, internally or externally. An ongoing trend is to report some data in a transparent manner so that stakeholders (politicians, tax-payers, patients and their next-of-kin) can partake in making care better. In the case of using highly aggregated data in a master thesis like this, it has not been considered necessary to inform or to get consent from patients according to another Swedish law (PUL, personuppgiftslagen, 1998:2004) that regulates the use of patient related data in e.g. research. Ethical considerations related to the study of the improvement work and its focus group and interview focused on necessary information to informants, the transcribed format of statements and the possibility to relate statements to informants. A procedure of letting informants read cited statements and comment on the possibility to relate statements to specific informants was used in order to take into consideration any wish to stay anonymous. Informants also got the possibility to give feed-back on the correctness of how their statements were interpreted. Participants had the opportunity to withdraw from participation at any time before the master thesis was finished.
Handling data according to Swedish law and asking colleagues about the usefulness of statistical process control could both be considered as standard procedures in quality work in a healthcare setting. Hence, no ethical vetting through an ethical committee or board was made.
5. Results
5.1 Results from the improvement work - applying control charts
The application of a driver diagram in finding out how available variables possibly could be related in improvement work resulted in Figure 8. The driver diagram was inspired by the ongoing work to adopt VBHC at the clinic. Extensive meetings and discussions with representatives of all the Department´s units and all the different professionals resulted in a far bigger driver diagram related to the adoption. The driver diagram in this master thesis is a far more limited, the outcome was related to “Better care and a more empowered patient”. A single primary driver was selected: “Shortening time from acute phase to recovery/discharge” - and three secondary drivers: “Care planning”, “Better coordination between in- and outpatient care” and “Less use of coercive measures”. Various ongoing improvement projects potentially affects the secondary drivers. See appendix I for an overview of some of the ongoing improvement projects at the four wards.
Figure 8. Driver Diagram
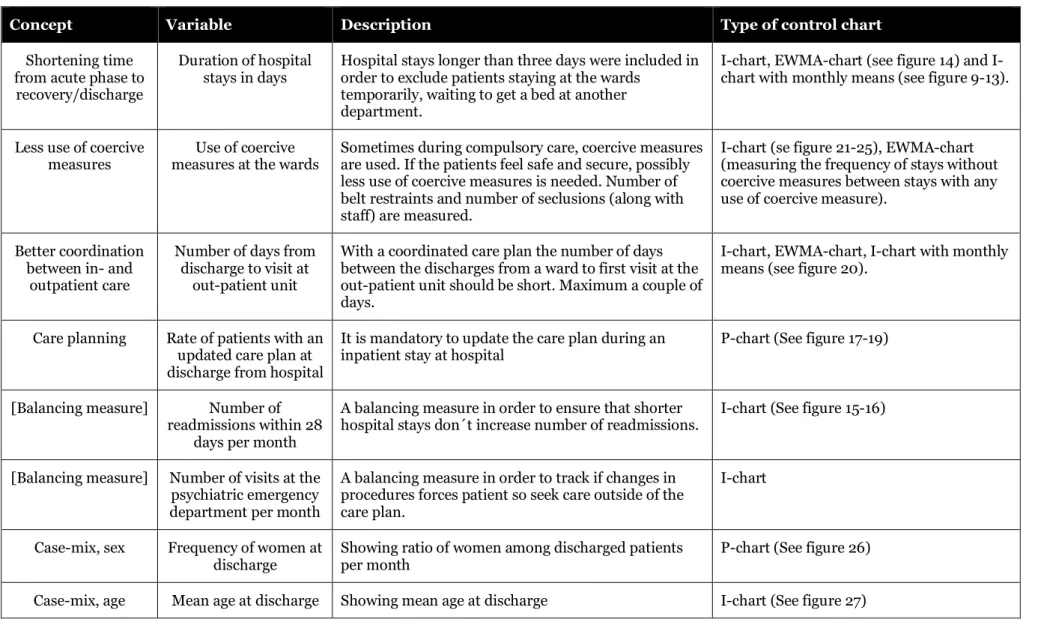
The driver diagram consists of concepts rather than variables. The concept “Shortening time from acute phase to recovery/discharge” was operationalized in the variable “Hospital stays in number of days”. “Less use of coercive measures” was operationalized by counting “Number of belt restraints and number of seclusions (along with staff)”, and “Better coordination between in- and outpatient care” by “Number of days from discharge to visit at outpatient unit”. “Care planning” was operationalized by using “Rate of patients with an updated care plan at discharge from hospital”. Two additional variables were monitored as balancing measures, with the purpose of detecting unintended consequences (Provost & Murray, 2011). The balancing measures were “Number of readmissions” and “Number of visits to psychiatric emergency department”, to ensure that shorter hospital stays do not increase the number of readmissions, and in order to track if changes in procedures forces patient to seek care outside of the care plan. Table 4 provides an overview of the concepts, variables, descriptions and types of control charts used.
Table 4. Selected variables and types of control charts used.
Concept Variable Description Type of control chart
Shortening time from acute phase to
recovery/discharge
Duration of hospital
stays in days Hospital stays longer than three days were included in order to exclude patients staying at the wards temporarily, waiting to get a bed at another
department.
chart, EWMA-chart (see figure 14) and I-chart with monthly means (see figure 9-13).
Less use of coercive
measures measures at the wards Use of coercive Sometimes during compulsory care, coercive measures are used. If the patients feel safe and secure, possibly less use of coercive measures is needed. Number of belt restraints and number of seclusions (along with staff) are measured.
I-chart (se figure 21-25), EWMA-chart (measuring the frequency of stays without coercive measures between stays with any use of coercive measure).
Better coordination between in- and
outpatient care
Number of days from discharge to visit at
out-patient unit
With a coordinated care plan the number of days between the discharges from a ward to first visit at the out-patient unit should be short. Maximum a couple of days.
I-chart, EWMA-chart, I-chart with monthly means (see figure 20).
Care planning Rate of patients with an updated care plan at discharge from hospital
It is mandatory to update the care plan during an
inpatient stay at hospital P-chart (See figure 17-19)
[Balancing measure] Number of readmissions within 28
days per month
A balancing measure in order to ensure that shorter
hospital stays don´t increase number of readmissions. I-chart (See figure 15-16)
[Balancing measure] Number of visits at the psychiatric emergency department per month
A balancing measure in order to track if changes in procedures forces patient so seek care outside of the care plan.
I-chart
Case-mix, sex Frequency of women at
discharge Showing ratio of women among discharged patients per month P-chart (See figure 26) Case-mix, age Mean age at discharge Showing mean age at discharge I-chart (See figure 27)
5.2 Control Charts
Control charts of the various measures were examined in order to get greater understanding on if, how, when and where change occurs during ongoing improvement projects at the Department.
Shown in the diagram (figure 9) is the duration of hospital stays (number of days) in an ImR chart of monthly means. In total, number of days, for the four wards showed a predictable process during 2013 to 2015, except during February and Mars, 2015, when two out of three consecutive data points were above a 2 sigma level.
Figure 9. Hospital stays in number of days for four wards during 2013-2015. Showing means per month. On ward-level, three out of four wards showed significant variation some time during 2014-2015. From April 2015 and onward the process on all four wards had stabilized, and showed no signal of special cause variation. (See figures 10-13) All 4 wards serve the same kind of patients.
Figure 10. Mean duration of Hospital stay Ward 1. Figure 11. Mean duration of Hospital stay Ward 2.
Figure 12. Mean duration of Hospital stay Ward 3. Figure 13. Mean duration of Hospital stay Ward 4.
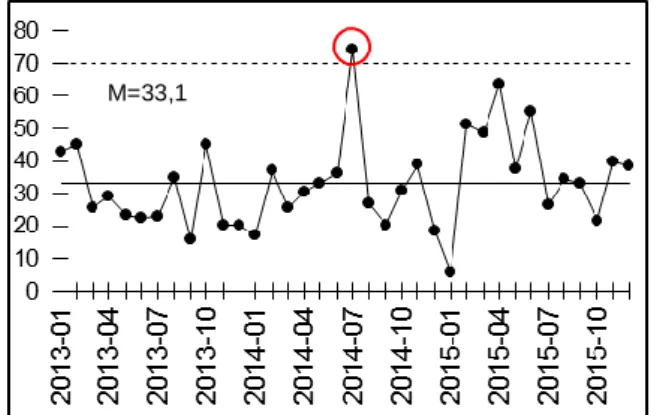
An EWMA-chart showing the exponentially weighted moving average of hospital stay during the same time for every discharged patient, at discharge (except two extreme outliers) shows some peaks over the upper control limit up until July 2015. (see figure 14)
Figure 14. EWMA-chart showing duration of hospital stay with an exponentially moving average.
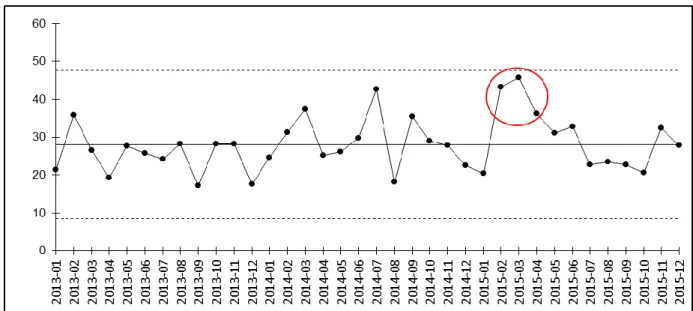
Balancing measures to accompany Duration of Hospital stay in days was “Number of readmissions within 28 days” and “Number of visits to the psychiatric emergency department”. Number of visits to
M=33,1 5
the psychiatric emergency department for patients treated at the Psychosis Clinic was stable during the same time while readmissions (per month) peaked during November 2015 for the four wards in total, with an all-time high for three years, and an alarm in the control chart. (See figure 15) The control chart for one of the wards showed the same pattern, with a signal on November 2015 (see figure 16), while the other wards showed a predictable process.
Figure 15. Readmissions per month, all four wards. Figure 16. Readmissions per month, ward 4.
Secondary drivers to attain shorter time from acute phase to discharge/recovery were, according to the driver diagram:
“Care planning”, measured by the ratio of patients having an updated care-plan at discharge.
“Better coordinated in- and outpatient care”, measured in number of days from discharge to visit at outpatient unit.
“Less use of coercive measures” conceptualized in discharge-frequency of hospital stays where coercive measures had been used.
Valid data on care-planning could be retrieved from January 2014. Signals appeared below the lower control limit in February and April, 2014, when it comes to care-planning ratio for the four wards in total. (see figure 17) Both the ward with the highest and the lowest mean ratio has stabilized their process during the years but the variation differs. (See figures 18 & 19)
Figure 17. Ratio of patients with updated care plan in total at the four wards.
Figure 18. Highest mean. Care-plan ratio, Ward 1. Figure 19. Lowest mean. Care-plan ration, Ward 2.
Number of days from discharge to visit at outpatient unit decreased during the last months monitored, showing an overall low value during the two last months (see figure 20). Several ongoing projects at the wards address planning and coordination. This shift, showing shorter time from discharge to visit at outpatient unit, is probably a result of the new ways of working.
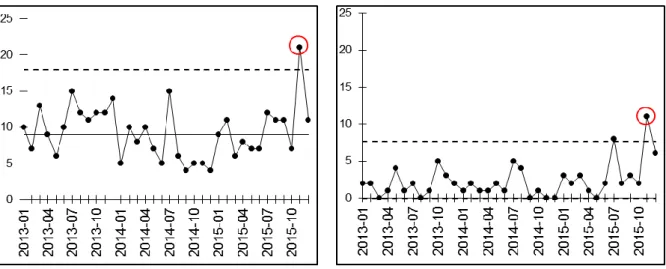
Number of hospital stays, without use of coercive measures, between stays with use of coercive measures were plotted over time, at discharge. The overall use of coercive measures varies a lot with signals above the upper control limit in September 2014 and September 2015. Signaling that the frequency of hospital stays with use of coercive measures are not as frequent as normal. (See figure 21)
Figure 21. Frequency between discharges of hospital stays with use of coercive measures for the four wards. Mean number of discharged patients between hospital stays with coercive measures is right below ten for the four wards in total and for three of the wards. (See figure 22-25) Ward 2 (figure 23) has almost half the frequency of hospital stays with use of coercive measures with a mean on 18,42, i.e. 18,42 hospital stays without coercive measures on every hospital stay were coercive measures are used. Only one ward has decreased the frequency of hospital stays with coercive measures in a way signaled in the control chart, ward 4. (See figure 25)
Figure 22. Frequency of hospital stays with coercive measures, Ward 1.
Figure 3. Frequency of hospital stays with coercive measures, Ward 2.
Figure 24. Frequency of hospital stays with coercive
measures, Ward 3 Figure 25. Frequency of hospital stays with coercive measures, Ward 4
Control charts to monitor case-mix changes on sex and age were made. Ratio of discharged women per month in a P-chart shows that variation when it comes to ratio of women (and men) stays within random variation during 2013 and 2015, but during almost the whole 2014 the ratio of women was higher. (See figure 26.)
Mean age per month at discharge shows a stable pattern over time. No signals of special cause variation appear to be present. See figure 27.
Figure 17. I-chart showing mean age at discharge per month
5.3 Results from the study of the improvement work – perceived usefulness
Data retrieved from the focus group and interview on usefulness of control charts are reported below, categorized in the five themes from Roger´s (1986) attributes of diffusion of innovation.
Relative advantage – Many advantages of using control charts were brought up. The possibility to trace special causes, to more swiftly track effects, and to get a clearer view on possible improvements areas were some of them. To use control charts in planning, exercise leadership and reflect on ways of working were perceived as possible ways to get use of it. Earlier reports used to show data primarily consisted of tables or just numbers on a yearly basis. The control limits and possibility to detect “real change” was seen as possibly the greatest advantage.
“For me it´s better! It´s quite easy to get an overview and distinguish special causes from random variation, and to find out when things are changing” [Informant 1]
Control charts are seen as tools that potentially could, if updated often enough, support improvement work and leadership in a more useful way than other reports used in the organisation.
Compatibility - The use of control charts are seen as fully compatible with the goal and visions of the Department, as well as on a more personal level in accomplishing work in a better way. From a leadership perspective, it was considered good to be able to strive more consistently towards goals, not only by sensing what´s happening but to get information over time and signals when things are changing.
“Since I started working here 5 years ago I have had a craving for a way to have data as a tool in leadership, to understand how things are evolving even if I´m not present. There is a need and [this way of working] is compatible.” [Informant 2]
There was also a sense that different parts of the organisation could have different ideas on the compatibility with values in using control charts, due to a perceived disinclination to measure almost anything at all, by some co-workers, at some units.
Complexity – The dialogue on complexity ranged from the complexity of understanding advanced control charts, like the EWMA-chart, to the complexity of the context were control charts could be in use. Knowledge of the methods and knowledge about the context are both needed in order to understand and make use of control charts. Just showing control charts is not enough.
“There isn´t any analysis accompanying the charts. Someone has to get that done as well.”
[Informant 3]
Control charts were seen as a tool to signal when something needs to be investigated or handled. The idea arose that it´s not interesting to discuss data in general, but to address matters with people involved in a process when questions arise after a signal on the charts. Control charts were perceived as useful if used along with a local improvement project, then the existing involvement in the improvement project would make it easier for people to engage in understanding the use of control charts.
Trialability - The use of control charts was considered fully trialable.
“I think it has good trialability.” [Informant 2]
Some promoted a big scale trial in order to compare data between units while others promoted using control charts in smaller improvement projects that naturally could attract interest from people involved. Opinions varied on how to start but there was a readiness to get started in trying to apply control charts in some way in the organisation.
Observability – To what degree the use of control charts can be observed by others is perceived to be under the control of the ones using the charts.
“On observability. I think it depends on to what extent we make it possible to view it. It´s all about how we use it.” [Informant 4]
In the focus group and the interview discussion examples of use affecting observability ranged from, showing a single co-worker a chart to making charts to put up on social media like twitter and facebook. The latter to either show great results or to show charts that capture challenges in order to generate ideas on how to handle a bad outcome.
6. Discussion
6.1 Revisiting the purpose
The purpose of this master thesis was to explore the possible usefulness of SPC, focusing on control charts, in a psychiatric setting. This was done by addressing two questions in two different ways. The first question was related to the possible contribution of knowledge, on if, when, where and how changes occur, if control charts are used. In order to answer this, an improvement project was completed, applying control charts adapted to the Department, aimed at supporting continuous improvement work. The first part of the discussion below contains a results discussion, looking at possible conclusions that can be drawn from the charts, and a methods discussion, elaborating on the application and use of control charts.
The second question, addressed the perceived usefulness for users, by collecting thoughts and insights in a focus group and an interview. Data collection was made by showing the control charts and using Roger’s (1986) attributes (relative advantage, compatibility, complexity, trialability and observability) as themes in the dialogue. The results discussion on the second question contains a data analysis by making a relational matrix, linking the attributes (themes from focus group and interview) with theoretical propositions on benefits and challenges, and pattern matching. Further follows a method discussion reviewing the trustworthiness of the study and thoughts on the combined role of the writer, being an inside researcher. Finally conclusions on the result of the whole thesis are drawn and summarized, followed by implications for improvement work and suggestions for further research.
6.2 Improvement work – applying control charts
6.2.1 Results discussion
The use of control charts visualise changes and differences in variation over time and between wards, answering the question on if, when, where and how changes appear. The clinical relevance or the sensitivity, or lack of sensitivity, to changes, need to be analysed in the context aided by people knowing the details about the context and its processes, in order to make use of the information. Nevertheless is interesting to see the relatedness between some of the ongoing improvement projects at the wards (appendix I) and changes in some of the charts. Variables related to process measures are linked closer to the ongoing improvement projects and reflect behaviour, or behaviour changes, more directly than outcome measures. Variables of process measures are, naturally, directly affected by changed behaviour, which can be seen in charts related to e.g. care-planning (Figure 17-19) and time from discharge to visit at outpatient unit (Figure 20). Measures, like duration of hospital days, are not affected to the same extent, partly probably because of the natural inertness due to being the effect of changes in other process measures and partly because of the multitude of influencing factors affecting duration of hospital stay.
6.2.2 Methods discussion
Several different control charts was applied, and some of them rejected when reviewed along with potential users. There are challenges appearing when having access to a vast amount of data in order to learn from variation by using control charts. Any grouping of data by calculating means or applying advanced control charts with moving averages either consumes some of the variation or increases the complexity of the chart making it harder to use. Any work done to visualize data from the complex setting of health care (Glouberman & Zimmerman, 2002) will be a simplification and will therefore have its flaws. The amount of charts that possibly could be of use (see e.g. Carey, 2003) can either be perceived as a source of trouble or as a possibility. With knowledge on how to choose and use, a control chart fit for its use could potentially increase the benefits of using it while lessening the impact of the flaws that comes with it. Therefore, the success of applying control charts, depends possibly to a large extent to whether charts has been chosen that has a degree of complexity that can be handled and simplifies the view of the context in a way that serves the intentions of its use.
The process of un-grouping data, stratification, has been used to reveal that variation on a ward level can be different than for the group or other wards. The possibility of getting data on ward-level was perceived as very valuable for the informants, since it makes it clear when changes appear on that level. There is a challenge in finding ways to reveal important sub-groups that can enhance learning on if, when, where and how a process is affected by improvement work. If improvements are constituted by a change in behaviour (Langley, 2009), feed-back on the level most relevant in reinforcing those behaviours will have the greatest impact.
One deeper aspect of subgrouping is the fact that every patient is uniquely constituted. If there is knowledge on how the process and the individuals interact and affect one another statistically, confounders could be controlled for. This risk-adjustment has potential to safeguard from false signals, generated by variation among patients over time. The scope of this master thesis isn´t wide enough to include the advanced statistical analysis needed for that purpose.
6.3 Study of improvement work – perceived usefulness
6.3.1 Results discussion
Themes relations to theoretical propositions - Data retrieved from the focus group and the interview on the attributes supporting diffusion of innovations contained information related to the theoretical propositions on possible benefits and challenges. These were structured in a relational matrix (see table 5.)
Table 5. Relational matrix: Relations between qualitative data on attributes supporting diffusion of innovation and theoretical propositions on possible benefits and challenges using control charts in a psychiatric context. “+” shows congruence between theoretical proposition and perceived usefulness in qualitative data. No area showed incongruence “-“. Empty cells show that there was not any information from the focus group and the interview overlapping theoretical propositions on benefits and challenges.
Theoretical propositions
Attributes supporting diffusion of innovation Relative
advantage
Compatibility Complexity Trialability Observability
Benefits
Timeliness of the findings
+
+
Distinguishes“real”-change from random variation
+
+
Support better decision
making
+
+
Perceived as valuable anduseful
+
+
Identify areas of improvement+
+
Challenges Limitation of data+
Knowledge on how to apply+
Complexity in analyzing charts+
Visualizing charts byusing available systems
+
Statistical control notnecessarily the same as clinical control or relevance
Data analysis of Improvement Study using Pattern Matching - The relational matrix also consists of markers showing congruent and incongruent matching between the theoretical propositions and the information retrieved from the focus group and interview. Statements on the relative advantage of using control charts in psychiatry, and the usage´s compatibility with the organization’s values and goals contained thoughts, experiences and ideas that matches the benefits found among the theoretical propositions. Statements related to complexity matched all theoretical propositions related to