http://www.diva-portal.org
Postprint
This is the accepted version of a paper published in Journal of the Electrochemical Society.
This paper has been peer-reviewed but does not include the final publisher proof-corrections
or journal pagination.
Citation for the original published paper (version of record):
Eslami, M., Fedel, M., Speranza, G., Deflorian, F., Zanella, C. (2017)
Deposition and Characterization of Cerium-Based Conversion Coating on HPDC Low Si
Content Aluminum Alloy.
Journal of the Electrochemical Society, 164(9): C581-C590
https://doi.org/10.1149/2.1511709jes
Access to the published version may require subscription.
N.B. When citing this work, cite the original published paper.
Permanent link to this version:
Deposition and characterization of cerium-based conversion coating
on HPDC low Si content aluminum alloy
1. Maryam Eslami (Corresponding author)
Department of Industrial Engineering, University of Trento, Via Sommarive 9, 38123 Povo (TN), Trento, Italy maryam.eslami@unitn.it, Tel: +39-3899121304, Fax: +39-0461281977
Birthdate: 1988/06/08
2. Michele Fedel
Department of Industrial Engineering, University of Trento, Via Sommarive 9, 38123 Povo (TN), Trento, Italy michele.fedel@unitn.it, Tel: +39-0461285354
3. Giorgio Speranza
Center for Materials and Microsystems, Bruno Kessler Foundation (FBK), Via Sommarive 18, 38123 Povo (TN), Trento, Italy
speranza@fbk.eu, Tel: +39-0461314487
4. Flavio Deflorian
Department of Industrial Engineering, University of Trento, Via Sommarive 9, 38123 Povo (TN), Trento, Italy flavio.deflorian@unitn.it, Tel: +39-0461282437
5. Caterina Zanella
Department of Materials and Manufacturing, School of Engineering, Jönköping University, Gjuterigatan 5, Jönköping, Sweden
caterina.zanella@ju.se, Tel: +46-36101691
_________________________________________________________________________________________________________________________________
Abstract
Cerium-based conversion coatings were deposited on high pressure die cast (HPDC) Al-Si alloys using an immersion method. Hydrogen peroxide and sodium chloride were added to the conversion solution to accelerate the coating formation and to understand its formation mechanism. These studies showed that the deposition of cerium hydroxide/oxide conversion layer starts from iron-rich intermetallic particles, which are located inside the eutectic region and then the coating growth continues to cover the entire alloy surface. This phenomenon passivates the active interfaces between iron-rich intermetallic particles and/or the eutectic silicon phase and the aluminum matrix, which are prone to localized corrosion in chloride ions containing environments. Accordingly, values of the total impedance in EIS measurements significantly increased for the treated substrates. Morphologies of the conversion coatings and the oxidation state of cerium compounds were found to be dependent on the composition of the solution and the presence of chloride ions and/or hydrogen peroxide. Aluminum alloy with higher silicon content showed a more active surface during immersion in the conversion solution. This makes it more difficult to be treated using aggressive conversion solutions.
Keywords: Al-Si alloys; HPDC; cerium-based conversion coating; electrochemical evaluation
2
1. Introduction
Anti-corrosion conversion coatings based on lanthanide salts have been studied as an environmental friendly replacement for the chromate-based conversion coatings (CrCC) since the 1980s 1-3. These coatings are both effective
and non-toxic 3 unlike CrCC, which is highly toxic and carcinogenic. Studies like the one of Olivier et al. 4 have shown
that cerium-based conversion coatings (CeCC) can be the most effective ones compared to other lanthanide-based layers, such as yttrium and lanthanum. Deposition and corrosion properties of CeCC have been studied not only on aluminum alloys but also on other such as magnesium alloys 5-8 and steel 9-12. Most of the research on CeCC on
aluminum alloys has been widely focused on protection of high strength alloys with aerospace applications such as AA2024 13-32 and AA707520, 33-40. Other studies include AA5083 12, 41-43, AA6061 44-46, AA6063 47, 48 and AA6082 49.
Only few works have been performed and published on Al-Si alloys such as those done by Pardo et al. 50, 51.
There are mainly three methods for applying CeCC including electrolytic deposition, spraying and immersion 52.
One of the challenges in the immersion method, which is the most frequently used method, is reducing the required immersion time. To speed up the process, researches have been mainly focused on the addition of hydrogen peroxide (H2O2) 15, 53-55 and/or chloride ions 28, 37, 55 and thermal activation 53. Other process parameters including concentration 56 and type of cerium salt (nitride or chloride) 43, 44, 49, immersion time 43, 44, 48, 49, pH 43, 44, 49, oxidizing ability of the
solution 4 and temperature 43 have been investigated by different authors.
The investigated process parameters in the current study include the concentration of cerium nitride, the immersion time and the addition of hydrogen peroxide and/or sodium chloride.
Pioneer studies on corrosion inhibition effect of rare earth metal salts on aluminum alloys, such as AA 7075, address the influence of the concentration of the cerium ions and the immersion time on the thickness of the conversion layer and the corrosion rate 57. According to these preliminary results, addition of only 50 to 200 ppm cerium chloride
to sodium chloride solution of 0.1 mol/l reduced the rate of corrosion of AA7075 by a factor of 50. It was noted that a minimum cerium chloride concentration of 50 ppm is required to slow the corrosion process. Higher cerium ions concentration leads to a lower corrosion rate. In addition, longer immersion times also result in conversion layers with higher thicknesses containing a higher percentage of cerium oxide compared to aluminum oxide57. It is worth
mentioning that in this study the immersion time changed from 16 hours to 20 days. More recent studies on other aluminum alloys such as AA2024 58, AA6063 48, AA5083 43 and A361 51 confirm the effect of increasing the
immersion time and the concentration of cerium ions on CeCC deposition. Hughes et al. 14 monitored the growth of
the oxide layer on AA2024 during immersion in a cerium-based conversion solution. According to their study, deposition of CeCC happens in two different phases including an induction step and ceria deposition step. The induction period includes activation of the surface, aluminum oxide growth and the deposition of cerium oxide on the intermetallic (IM) particles. While the deposition phase includes the deposition of cerium oxide all over the surface, which increases linearly with the immersion time.
In some studies, an optimum amount for the cerium ions concentration44 and/or the immersion time 51 was found. It
was shown that a very high cerium ions concentration and/or a very long immersion time will result in cracked and spalled coatings which do not possess improved corrosion resistance 48, 51, 58.
3 Many of studies on the deposition of CeCC on different aluminum alloys benefit from the accelerating effect of addition of hydrogen peroxide (with the concentration from 0.02 to 1 mol/l37, 44, 58), and/or sodium chloride (with the
concentration from 0.05 to 0.3 mol/l24, 30) to the conversion solution. In these studies, the concentration of cerium
nitride/cerium chloride salt usually ranged from 0.005 to 0.1 mol/l 4, 22, 46, 49, 58, 59 for different aluminum alloys. The
immersion time differed from 12 to 24 hours for non-accelerated deposition process 28, 30, while it was reduced to 2
minutes to 2 hours using accelerated deposition process (in some cases accelerated deposition process was performed at temperatures higher than 50 ºC) 43, 44, 46, 48, 51.
Pretreatment is another important factor, which significantly affects CeCC deposition, thickness, morphology, and corrosion protection.Especially alkaline and acid activation of the surface has been the subject of some studies 20, 38, 40, 60. It is stated that CeCC layer will generally not deposit on an as-received surface. Physical abrasion, degreasing,
alkaline and acid activations are the main proposed steps in pretreatment 52. Sodium hydroxide-based solution is one
of the most frequently used solutions for the alkaline activation step 16, 20, 28, 29, 43. This pretreatment has been shown to
promote rapid CeCC deposition on AA7075 alloy 38. While for AA2024 alloy an extra acid activation step, for instance
in sulfuric acid solution, is required for more rapid deposition 60. In this alloy, acid activation decreases the thickness
of the oxide layer and the concentration of magnesium at the surface. It also increases the concentration of copper at the surface, likely due to the exposure of the copper-rich intermetallics. The exposure of more cathodic sites during immersion increases the rate of coating deposition. Unfortunately, for cast Al-Si alloys scientific support for the pretreatment procedure and its effect on CeCC deposition is almost unavailable.
Deposition and protection mechanism of CeCC is mainly due to the heterogeneous microstructure of the aluminum alloys, especially with different IM particles. The potential difference between different microstructure components and the aluminum matrix introduces micro galvanic cells in which the aluminum matrix is often the anode and the IM particle is the cathode. Reduction of oxygen on the cathodic sites such as IM particles leads to localized increment of pH, which results in cerium hydroxide/oxide deposition:
Al→Al3++3e- (1)
O2+2H2O+2e-→H2O2+2OH- (2)
O2+2H2O+4e-→4OH- (3)
2Ce3++6OH-→2Ce(OH)
3→ Ce2O3+3H2O (4)
2Ce3++ H
2O2+2OH-→2Ce(OH)22+ (5)
4Ce3++ O
2+4OH-+2H2O→4Ce(OH)22+ (6)
Ce(OH)22++2OH-→ Ce(OH)4→CeO2+2H2O (7)
Therefore a physical barrier consists of a cerium compounds deposits on the IM particles which increases the resistance of the aluminum alloy to localized corrosion 22, 28. These CeO islands will grow further to cover the entire aluminum
surface. However, obviously, and to our favor, higher deposition occurs on the cathodic sites (IM particles) 28. This is
attributed to higher pH over IM particles, due to cathodic oxygen reduction 61. The pH drops off away from these
4 Studies have shown the role of different IM particles and the heterogeneous microstructure, especially in AA2024 alloy, on deposition mechanism of cerium layers. Many of these IMs are cathodic with respect to the aluminum matrix (such as AlFeMnCu particles). However anodic particles such as Al2CuMg (S-phase) also participate in the deposition
mechanism by dealloying. Since after dealloying (dissolution of magnesium and aluminum) they become nobler compared to the aluminum matrix and act as cathodic sites 22, 30. Paussa et al. 30 elaborated this model to state that only
a small dissolution of magnesium and intense hydrogen evolution, which happens locally and very close to the IM particle can increase the pH high enough for cerium hydroxide/oxide precipitation. Therefore, precipitation of cerium compounds on anodic IM particles can happen even before they become cathodic with respect to the aluminum matrix. Lau et al. 22 focused on the role of copper dissolution from S-phase during the deposition of the conversion coating.
According to their model further cathodic reduction of copper ions on the matrix results in the formation of copper islands which promote more dissolution of the surrounding aluminum matrix leading to areas of major oxide growth. In this case composition of cerium-based layer differs from CeO2 on more active IM particles to Ce(O2)(OH)2 over
the aluminum matrix 22.
As was mentioned before, studies on the formation and characterization of CeCC on cast Al-Si alloys are rare. The presence of the eutectic silicon and iron-rich IM particles make them prone to localized corrosion 63. The current work
deals with the formation and characterization of CeCC on HPDC low Si content aluminum alloy. This research also addresses the effect of different process parameters such as immersion time, concentration of cerium salt, addition and concentration of sodium chloride and hydrogen peroxide on deposition and corrosion resistance of CeCC on the aluminum-silicon alloy.
2. Experimental
2.1. Substrate preparation
Two Al-Si alloys with 2.5 and 4.5 wt. % Si were produced for the current work. Their measured compositions are presented in Table. 1. A 400 ton high pressure die cast (HPDC) machine was used to produce the component. Details of the casting process are presented elsewhere 64. Before immersion in the conversion solution, samples were ground
using SiC abrasive papers of P1200 and P4000, respectively. After grinding, the samples were cleaned in acetone for 10 minutes assisted with ultrasonic waves. Samples were then immersed in NaOH solution of 40 g/l for 15 seconds, as an alkaline activation step. It should be noted that samples were rinsed with deionized water and dried after each individual step. Samples were immersed in each conversion solution right after the final step of the pretreatment. After the immersion time was reached, the samples were dried and kept in a desiccator for further microstructural and electrochemical analyses.
Table. 1. Measured composition (wt. %) of alloys
Name Si Fe Cu Mn Mg Zn Al
Alloy 2L 2.4 0.462 0.131 0.019 0.58 0.038 96.338
5
2.2. Solution preparation and coating conditions
The solutions were prepared using hydrated cerium nitride (Ce(NO3)3.6H2O), sodium chloride (NaCl), hydrogen
peroxide (H2O2) and deionized water. All the chemicals used in this work were of analytical grade. Various conditions
of the conversion process are presented in Table. 2. It should be noted that the solutions were aged for at least 30 minutes prior to the coating process so that cerium speciesreached the equilibrium before starting the immersion. To investigate the effect of each parameter including time and concentration, each particular parameter was varied while others were kept constant. For example, constant Ce(NO3)3.6H2O concertation of 0.05 mol/l was used to study the
effect of NaCl concentration and addition of H2O2. The effect of H2O2 addition was studied both in presence and
absence of NaCl in the solution.
Table. 2. Conversion process parameters
2.3. Layer characterization
The surface morphologies of cerium-based conversion layers were examined using Scanning Electron Microscopy (SEM, JSM-IT300). SEM was equipped with Energy-dispersive X-ray spectroscopy (EDXS), which was used to measure the composition of the coatings and to collect elemental map on their surfaces. A beam energy of 20 kV was used andimages were captured using backscattered electron mode. A LYRA3 FIB/SEM was used for the cross sectioning and analysis of the conversion layers. For FIB milling, parameters were set as follows: 30kV, 5nA for rough milling and 1 nA for final polishing. In these experiments, the beam energy was 15 kV. For EDXSanalysis, 254 frames mapping and 50 µs dwell time were utilized. To evaluate the composition of the coating and especially to examine the oxidation number of cerium, samples were tested by X-ray photoelectron spectroscopy (XPS). The spectra were collected using an Axis DLD Ultra instrument (Kratos–Manchester UK). Acquisitions were composed by wide scans on a BE energy range 1250–-5 eV using a 160 eV pass energy and high resolution core line spectra performed
Investigated parameter
Substrate Ce(NO3)3.6H2O
(mol/l)
NaCl (mol/l) H2O2 (mol/l) Immersion
time (min) Concentration of Ce(NO3)3 2L 0.01*, 0.05**, 0.1*** 0 0 1080 (18 h) *pH= 4.98, **pH= 4.48, ***pH= 3.93 Concentration of NaCl 2L, 4L 0.05 0.01, 0.05, 0.1 0 1080 (18 h) Addition of H2O2/immersion time 2L, 4L 0.05 0 0.02 20, 60 pH=3.1 Addition of H2O2 and NaCl /immersion time 2L 0.05 0.05 0.02 20, 60 pH=3.2
6 by setting the analyzer pass energy at 20 eV and the energy step at 0.05 eV. The analysis of the XPS spectra was performed using a home-made software based on the R platform. Spectra were aligned on the bonding energy scale taking the C 1s at 284.4 eV as a reference. Care was taken while selecting the appropriate background subtraction and Gaussian components for peak fitting.
Potentiodynamic polarization and electrochemical impedance spectroscopy (EIS) measurements were performed on treated samples to evaluate their electrochemical response and corrosion resistance in NaCl solution of 0.05 mol/l concentration. A traditional three-electrode cell was used, including the sample as the working electrode, a standard platinum electrode as the counter electrode and a silver/silver chloride (Ag/AgCl 3M KCl) as the reference. The cell was a plastic cylinder tube fixed on the sample surface with the exposure area of 1 cm2. Both the tests were performed
using a computer-controlled potentiostat (Metrohm Autolab PGSTAT302N). In the case of the polarization test, the sweep rate was 0.166 mV/s and the initial delay 10 min. Anodic and cathodic polarizations were stopped after the maximum current densities of 9×10⁻⁴ A/cm2 and 4×10⁻⁵ A/cm2 were reached, respectively. For each sample, cathodic
and anodic branches were collected separately, starting from the open circuit potential (OCP) in both cases. Regarding EIS tests, the frequency ranged from 100 kHz to 10 mHz with 36 points/decade and the amplitude of the sinusoidal potential signal was 10 mV with respect to OCP. EIS measurements were collected during 24 hours of immersion. It is worth mentioning that the reliability of the data is guaranteed by repeating the electrochemical tests on each sample for at least two times. For comparison, all the electrochemical tests were also conducted on the bare 2L and 4L alloys.
3. Results and discussion
3.1. Morphology and composition
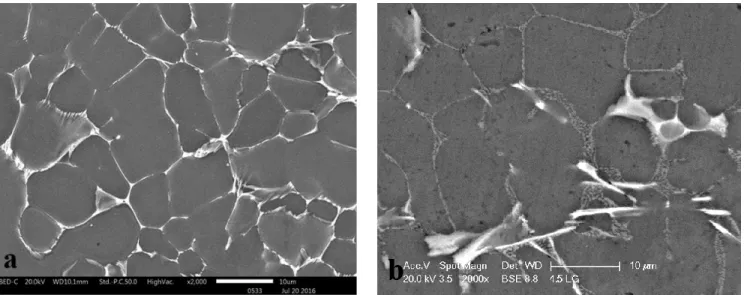
Fig. 1 depicts the typical microstructure of the two low Si content aluminum alloys cast by HPDC technology. This microstructure contains primary α-Al grains and Al-Si eutectic region. The Si in the eutectic area possesses flake-like structure. There are some iron-rich IM particles, which have a needle shape morphology (they are brighter compared to the silicon phase in the backscattered image) and are located inside the eutectic region. Due to their needle shape morphology and as it is expected in hypoeutectic aluminum alloys, these IM particles are β-AlFeSi 63, 65. The EDXS
analysis confirms their presence. As our previous study has shown 64, the presence of these phases (the eutectic silicon
and iron-rich IM particles) together with α-Al garins in the alloy microstructure results in the formation of micro-galvanic cells, which make the alloy prone to localized corrosion.
7 Fig. 1. SEM-BS of (a) 2L and (b) 4L alloy.
Fig. 2. summarizes the surface morphologies of the cerium-based conversion coatings on Al-2.5 wt.% Si alloy, deposited from different conversion solutions. These images depict the effect of addition of NaCl and H2O2 to the
solution on the surface morphology of the conversion coatings. According to Fig. 2, on all of the surfaces, some relatively large pits are visible. According to the appearance of the samples after the alkaline activation step this is partially due to the alkaline cleaning which removes a number of IM particles 19, 28. However, localized attack on the
surface seems to occur also during cerium-based conversion layers formation. For the sample treated using the plain solution which only contained Ce(NO3)3 (Fig. 2(a)), localized cerium hydroxide/oxide deposition is detectable as
white islands in backscattered SEM images. Both of the eutectic silicon phase and β-AlFeSi particles, in the alloy microstructure, are cathodic with respect to the α-Al phase 50. Therefore, as mentioned before, they are proper sites
for cathodic reactions (such as oxygen reduction) and local increase of pH which leads to the deposition of the conversion coating. It is then reasonable to expect the presence of a deposited layer with a higher thickness on these phases 46. It should be noted that the coating growth starts from the cathodic sites, but it continues to cover the whole
surface 30. This fact is depicted in the elemental map of Ce related to this sample which is shown in Fig. 3(e). In the
case of the sample in Fig. 2(a), the exact sites of localized deposition are not quite clear to be either the eutectic silicon phase and/or iron-rich IM particles.
8 Fig. 2. SEM-BS image of 2L alloy treated using the solution of (a) 0.05 mol/l Ce(NO3)3 (18 h immersion), (b) 0.05
mol/l Ce(NO3)3 and 0.05 mol/l NaCl (18 h immersion), (c) 0.05 mol/l Ce(NO3)3 and 0.02 mol/l H2O2 (1 h
immersion).
The situation gets clearer by adding 0.05 mol/l of NaCl to the conversion solution (Fig. 2(b)). According to Fig. 2(b) and EDXS analysis, in this condition, the deposition of the conversion layer is still mainly localized. However, a bigger fraction of the cathodic sites is covered by the cerium-based layer. It seems that the coating has started to cover the whole surface however gradually but thoroughly. Chloride ions, in the conversion solution, break down the oxide layer on the alloy surface, exposing the metal surface directly to the solution and allowing the oxidation and reduction reactions to occur 14.
9 Fig. 3. (a) SEM-BS image of 2L alloy treated using the solution of 0.05 mol/l Ce(NO3)3 for 18 hours and the
elemental map of (b) Al, (c) Si, (d) Fe, (e) Ce, and (f) O.
According to Fig. 2(b), more pits are visible on the surface which can also be attributed to the corrosion and breakdown of the aluminum oxide layer in the presence of chloride ions 55:
Al3++4Cl- → AlCl
-4 (8)
It is worth mentioning that, AlCl
-4 is easily hydrolyzed according to the following reaction. The remained chloride
ions continue to react with the aluminum surface:
AlCl
-4+2H2O → Al(OH)2Cl+2H++3Cl- (9)
It has been seen that chloride ions promote the cathodic reactions necessary for the conversion coating deposition 37.
Lack of chloride ions results in a considerable reduction in coating deposition rates and/or coating thicknesses since nitrate ions are not able to break down aluminum oxide layer as effectively as chloride ions 24, 66. This is obvious by
comparing the two coatings in Figs. 2(a) and (b). The breakdown of the oxide layer takes place especially at the interface between α-Al phase and the eutectic silicon and/or iron-rich IM particles 64. This phenomenon can be
controversial, since it may also result in the formation of subsurface crevices 24. However, formation of subsurface
crevices usually happens with a combination of NaCl and H2O2 in the solution 11. Results of EDXS analysis in the
10 eutectic region (point number 1) is evident. Point number 2 is an iron-rich IM particle on which the analysis does not show any cerium content. It seems that the deposition has started from a eutectic area containing iron-rich IM particles. By adding H2O2 to the solution, the coating morphology changes and it forms a continuous layer with a mud-crack
structure in some regions, covering all the surface (Fig. 2(c)). This structure is due to the stresses induced in the coating during the drying step 15. As it was described by Scholes et al. 54, the effects of H
2O2 in the deposition of CeCC include
the role of a complexing agent, an oxidant, a crystallization inhibitor and a source of OH- ions. Indeed, H
2O2 has an
accelerating effect due to its reduction on cathodic sites generating hydroxyl ions (OH-) 54:
H2O2 +2e-→2OH- (10)
As mentioned before, the hydroxyl ions are required for the precipitation of cerium hydroxide (Reactions 4 and 7). H2O2 also oxidizes Ce3+ ions to Ce4+ in the solution by formation of a complex, provided that O2 is reduced at cathodic
sites 45, 54:
2Ce3+ +H
2O2+2OH-→2Ce(OH)22+ (11)
Therefore, addition of H2O2 to the conversion solution leads to the formation of a hydroxide/oxide coating containing
mainly Ce (IV) species.
Fig. 4. presents the coatings deposited from the same solution of those of Figs. 2(a) and (b) (with the same and higher concentrations of NaCl) on Al-4.5 wt.% Si alloy to evaluate the effect of the substrate silicon content. For the sample immersed in the solution containing only Ce(NO3)3, local deposition of the cerium compounds is similar to
that on the alloy with lower silicon content. However, in this case, bigger and more deposition can be seen on the surface. This is most probably attributed to higher cathodic activity due to the presence of a bigger eutectic fraction. In the absence of chloride ions in the conversion solution, many of iron-rich IM particles remain uncovered (Fig. 4 (a)). By adding NaCl, more of the iron-rich IM particles are passivated by cerium conversion layer and the coating morphology becomes more homogenous (Fig. 4 (b)). By increasing the concentration of NaCl, the coating thickness increases even more and it forms a cracked structure (Fig. 4 (c)).
Combining H2O2 and NaCl in the solution gives us a better insight toward the preferential locations of cerium
hydroxide/oxide deposition. Fig. 5 presents the coating deposited on a sample of Al-4.5 wt.% Si alloy, using the solution of 0.05 mol/l Ce(NO3)3, 0.05 mol/l NaCl and 0.02 mol/l H2O2. According to these figures, precipitation of
11 Fig. 4. SEM-BS image of 4L alloy treated using the solution of (a) 0.05 mol/l Ce(NO3)3 (18 h immersion), (b) 0.05
mol/l Ce(NO3)3 and 0.05 mol/l NaCl (18 h immersion) and (c) 0.05 mol/l Ce(NO3)3 and 0.1 mol/l NaCl.
Fig. 5. (a) SEM-BS image of 4L alloy treated using the solution of 0.05 mol/l Ce(NO3)3, 0.05 mol/l NaCl and 0.02
12 Fig. 6. (a) SEM-BS image and (b), (c), (d), (e) and (f) the elemental mapping of the cross-sectional view of 2L alloy
13 Fig. 6 provides the cross-sectional view of the conversion coating on 2L alloy, treated using the solution of 0.05 mol/l Ce(NO3)3 and 0.1 mol/l NaCl. The elemental map of Al, Si, Fe, Ce and O are also provided in this figure.
Images in Fig. 6 show a localized deposition of cerium hydroxide/oxide, which apparently has started from an iron-rich IM particle. As also obvious from SEM images of the alloy surface (Fig. 1 (a)), IM particles are located inside the eutectic area, which is detectable from Si map (Fig. 6 (c)). Therefore, we can assume that iron-rich IM particles are the primary locations for the deposition of cerium compounds. Cross-sectional view also confirms the growth of cerium hydroxide/oxide nuclei, which finally covers the entire surface (Fig. 6 (e)). No subsurface crevices are visible at the interface of the conversion coating and the aluminum alloy substrate. Considering that chloride ions were present in the conversion solution, which was used to treat this sample, it seems that the concentration of 0.1 mol/l of NaCl is high enough to promote the conversion process and low enough not to cause any undesired pitting/crevice corrosion. It is worth mentioning that our investigations show that the coating thickness is very different over the surface. This can be due to the high surface roughness and the presence of the different microstructural components. The thickness reaches the maximum amount of 5-8 µm over the localized depositions and it falls to 1-2 µm near to them and to 50-200 nm far from these precipitations. The coating is not detectable in some points on the surface.
Results of XPS analysis of samples of 2L alloy treated using the solution of 0.05 mol/l Ce(NO3)3 and the solution
of 0.05 mol/l Ce(NO3)3 and 0.02 mol/l H2O2 are illustrated in Fig. 7. These spectra clearly prove the presence of cerium
species on the surface. As it is obvious in the XPS spectra, a fair amount of carbon is present in the outer layer of the conversion coatings. This peak is attributed to the accumulation of contaminants on the surface due to exposure to air, which has been seen and reported by other researchers before 32. It can also be due to the surface contamination related
to the dye releasing agent which is entrapped in the very first solidification layer on the surface. Samples of bare aluminum alloy were also examined by XPS to make sure that the carbon peak is due to the surface contamination and the carbon peak was present in all the spectra (the results are not reported here).
According to Fig. 7, the cerium-based conversion coatings possess a mixture of cerium compounds (hydroxide /or and oxide) in Ce(III) and Ce (IV) oxidation states. Using XPS analysis, unfortunately, it is difficult to distinguish between cerium hydroxide and cerium oxide. Ce (IV) and Ce (III) in their ground state have a 4f0 and 4f1 orbitals, respectively.
When an X-ray photon creates a hole in the 3d level, a rearrangement of the cerium electronic structure in the valence band occurs. In particular, the 4f orbital is pulled away from the Fermi level into the valence band to screen the 3d hole. This, in presence of Ce (IV) or Ce (III) oxides or hydroxides, leads to a strong hybridization of the cerium ground state 4f0 with the 2p oxygen orbital. Concerning the analysis, the Ce 3d core line appears as doublets in XPS spectra
due to the spin orbit splitting. The energy of the photo emitted 3d electron will depend on the coupling between the initial 3d and 4f hybridized orbitals. The result of this coupling is that in the case of Ce (IV) the 3d5/2 level will show
three components while the same orbital in Ce(III) will be composed of two features 67. Then the description of the
Ce 3d core line in the presence of both the Ce (III) and Ce (IV) will need a total of 10 fitting components (Figs. 7 (c) and (d)). Accordingly, analysis of Ce 3d peaks (Figs. 7 (c) and (d)) gives us information about the valence state of cerium. Based on the analysis, the Ce (III)/Ce (IV) ratio is 1.1 and 0.75 for the conversion coatings from the plain and hydrogen peroxide-containing conversion solutions, respectively. As expected, addition of H2O2 to the conversion
14 Fig. 7. XPS analysis of 2L alloy treated using the solution of (a), (c), (e) 0.05 mol/l Ce(NO3)3 for 18 hours; (b), (d),
15 Considering the oxygen (high resolution peak in Figs. 7 (e) and (f)), the peak centered at 531.2 eV, in the case of conversion coating from the plain solution, and the peak centered at 532.38 eV, in the conversion coating from hydrogen peroxide-containing solution, are ascribable to aluminum oxide 46. The difference between the O 1s binding
energy derives from the different oxidation states of aluminum, which can be assigned to Al2O3 in the former case and
to AlOx in the latter. This is also reflected by the Al 2p core line (not shown here), which in the two cases shows a
pronounced component at ~ 74.5eV and 75.8eV, respectively. This change of the aluminum oxidation state could be caused by the presence of H2O2 in the conversion solution. Finally, the O 1s shoulders at 529.4 eV and 530.5 eV (Fig.
7 (e)) and 529.5 eV and 530.7 eV (Fig. 7 (f)) can be attributed to the presence of CeO2 and Ce2O3, respectively.
We can conclude that the conversion coatings consist of a mixture of aluminum oxide and cerium oxides/hydroxides. It has been shown by other researchers 32, 46 that CeCC usually consists of a mixture of Ce (III) and Ce (IV) compounds,
in which Ce (III) is more concentrated in the inner layer and Ce (IV) is more abundant in the outer layer of the coating. Oxidation of Ce (III) to Ce (IV) can happen either during the coating formation or after it and due to exposure to air
13, 32.
3.2. Electrochemical behavior
The effect of Ce(NO3)3 concentration on the corrosion resistance of CeCC-treated 2L alloy is presented in Fig. 8.
This figure shows the Bode presentation of EIS spectra for the coatings deposited from the conversion solutions with different concentrations of cerium nitride, after 6, 12 and 24 hours of immersion in NaCl solution of 0.05 mol/l. All the treated samples possess higher impedance values compared to the untreated substrate, not only in low but also in high frequencies.
Considering the low-frequency impedance modulus values obtained at 0.01 Hz (|Z|0.01 Hz), as an estimation of the total
resistance of the system 4, these values are increased by more than one order of magnitude for the conversion treated
samples, compared to the bare aluminum alloy. In the absence of any accelerator (NaCl or H2O2), coatings impedance
values increase by increasing the cerium nitride concentration in the solution. The formation of stable cerium nitrate complexes such as Ce(NO3)52– and Ce(NO3)63– reduces the effective concentration of cerium ions required for the
coating process 44. Therefore, by increasing the number of cerium ions in the solution, more deposition occurs and
higher corrosion resistance is achieved. The values of total impedance decrease through 24 hours of immersion in NaCl solution for both treated and the bare aluminum samples, indicating the progressive corrosion process. However, corrosion resistance remains quite high for the conversion treated samples even after 24 hours.
16 Fig. 8. Bode plots of EIS spectra of samples of 2L alloy treated using the solution of 0.01, 0.05 and 0.1 mol/l
Ce(NO3)3 (18 h immersion) after (a) 6, (b) 12 and (c) 24 hours of immersion in NaCl solution.
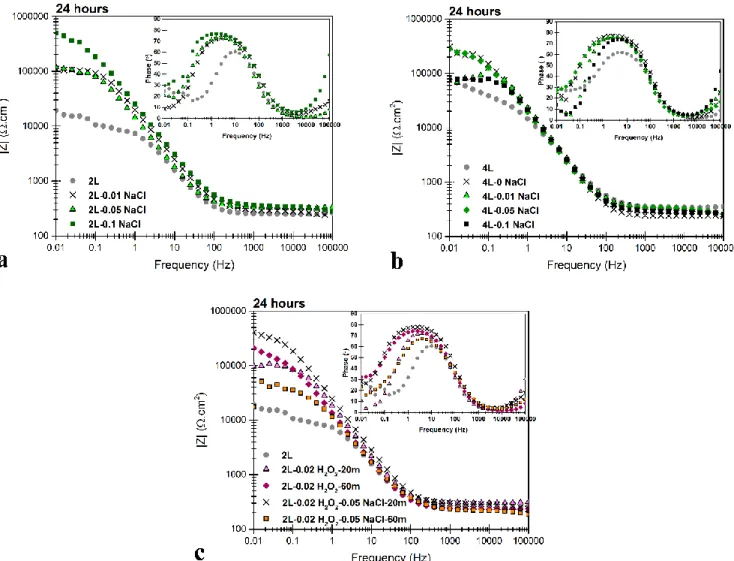
The effect of addition of NaCl in different concentrations to the conversion solution on the electrochemical response of CeCC on both 2L and 4L alloys are depicted in Figs. 9 (a) and (b). Three different aims were targeted by adding NaCl to the conversion solution including: 1. understanding the formation mechanism (preferential deposition sites) of the cerium-based conversion coating, 2. highlighting the difference between the two Al-Si alloys and 3. increasing the corrosion resistance by passivating more cathodic sites. For the conversion coatings on the 2L alloy, the highest |Z|0.01 Hz value is reached using the solution containing 0.1 mol/l NaCl. This indicates the effective role of NaCl in
activating the corrosion processes near the cathodic sites in the alloy microstructure, which led to the deposition of a thicker layer over these cathodic areas. However for 4L alloy (Fig. 9 (b)), due to the presence of more cathodic phases, the highest value of |Z|0.01 Hz can be achieved even in the absence of NaCl. Adding 0.05 mol/l NaCl to the solution the
17 results of the impedance value do not change and adding a higher amount of NaCl (0.1 mol/l) reduces the total impedance of the system. This is obviously due to more surface corrosion in presence of NaCl in the conversion
solution for Al-4.5 wt.% Si alloy.
Fig. 9. Bode plots of EIS spectra of samples of (a) 2L and (b) 4L alloy treated using the solution of 0.05 mol/l Ce(NO3)3 and 0.01, 0.05 and 0.1 mol/l NaCl (18 h immersion) after 24 hours of immersion in NaCl solution. (c)
Bode plots of EIS spectra of samples of 2L alloy treated using the solution of 0.05 mol/l Ce(NO3)3 and 0.02 mol/l
H2O2 (and 0.05 mol/l NaCl) (20 and 60 min immersion) after 24 hours of immersion in NaCl solution.
Regarding the effect of H2O2 in the conversion solution (Fig. 9 (c)), the conversion coating deposited from the
solution containing 0.02 mol/l H2O2 with the immersion time of 1 hour shows improvement in total impedance values
in comparison to the bare Al-2.5 wt.% Si alloy and to the coating deposited from the same solution with the immersion time of 20 minutes. According to these results, 20 minutes is not enough time to form an adequate coating. By combining NaCl and H2O2, the required immersion time to achieve the same impedance values of the coating from
the solution of 0.05 mol/l Ce(NO3)3 and 0.1 mol/l NaCl reduces from 18 hours to 20 minutes. When using the solution
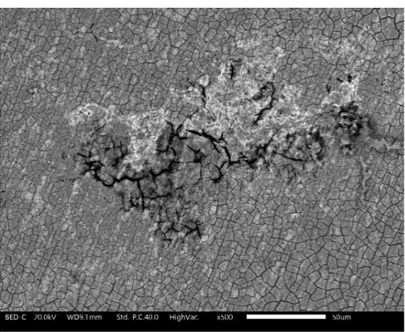
18 solution is so aggressive and the formation of a very thick cracked layer from this solution in higher immersion times results in permeation of NaCl into the surface during the EIS test (Fig. 10).
Fig. 10. SEM-BS image of corroded CeCC on 2L alloy deposited from the solution of0.05 mol/l Ce(NO3)3, 0.05
mol/l NaCl and 0.02 mol/l H2O2 (1 h immersion).
Treating samples of the 4L alloy using the mixed solution of Ce(NO3)3, NaCl and H2O2 with the immersion time of
20 and 60 minutes does not result in corrosion resistance improvement as it is obvious in the EIS results in Fig. 11. It is worth mentioning that, in general, samples of bare Al-4.5 wt.% Si show higher total impedance values compared to those of Al-2.5 wt.% Si. Studies on corrosion behavior of Al-Si alloys have shown the positive effect of silicon on the corrosion resistance of aluminum alloys 68-70 and in general more Si on the surface increases the surface resistance
values. Our previous study on these two Al-Si alloy confirms this fact 64.
Regarding the results of the conversion treatment using the mixed solution of Ce(NO3)3, NaCl and H2O2, obviously,
this solution is too aggressive for the samples of 4L alloy. Since there are more eutectic regions on the alloy surface due to the higher silicon content, more active sites for anodic and cathodic reactions are available. This produces thick and cracked conversion layers without a significant improvement in the corrosion resistance.
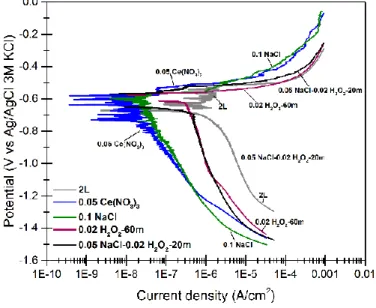
Results of polarization tests on the conversion treated samples of 2L alloy, in the solution of 0.05 mol/l NaCl are presented in Fig. 12. According to this figure, both anodic and cathodic branches are influenced by the presence of cerium-based conversion coatings on the alloy surface. Regarding anodic branches, all the coatings show a decrease in anodic current density, compared to the untreated sample. The best performances in this sense are the coatings deposited from the solutions of 0.05 mol/l Ce(NO3)3 with and without 0.1 mol/l NaCl. However, the coatings deposited
from the solutions containing H2O2 show less improvement. This is probably attributed to the cracked morphology of
coatings from hydrogen peroxide containing solutions, which lets permeation of the corrosive solution to the metal surface and results in higher corrosion rates. Concerning the cathodic branches, the cathodic current density decreases for all the cerium-based conversion coatings in comparison to the bare aluminum alloy. This is attributed to the lower
19 oxygen reduction rate 4, which shows that cathodic sites have been blocked by cerium oxide/hydroxide deposition. In
alignment with the previous results, coatings formed from H2O2-containing solutions present less improvement in the
cathodic branches. For all coatings except for the one deposited from the solution of 0.05 mol/l Ce(NO3)3, 0.05 mol/l
NaCl and 0.02 mol/l H2O2, two reduction peaks are detectable, which can be attributed to two steps in oxygen reduction 4 (Reactions 2 and 3).
Considering results from both EIS and polarization tests, it can be concluded that coatings from the conversion solutions without H2O2 possess higher corrosion resistance. This can be attributed not only to the almost crack-less
structure of these coatings but also to the higher amount of Ce (III) in these coatings, which oxidizes to Ce (IV) and acts as an anti-corrosion mechanism.
Fig. 11. Bode plots of EIS spectra of samples of 4L alloy treated using the solution of 0.05 mol/l Ce(NO3)3, 0.05
mol/l NaCl and 0.02 mol/l H2O2 for 20 and 60 minutes after (a) 12 and (b) 24 hours of immersion in NaCl solution.
20
4. Conclusion
Cerium based conversion coatings were successfully deposited on cast HPDC aluminum low silicon alloys of 2.5 and 4.5 wt.% Si. The effects of different deposition parameters including the immersion time, cerium nitride and sodium chloride concentrations and hydrogen peroxide addition on the microstructure and the corrosion resistance of the coatings were examined. SEM investigations showed that the deposition of cerium hydroxide/oxide starts preferably on iron-rich IM particles inside the eutectic region and it continues to cover the whole surface. Presence of NaCl, in the conversion solution, promotes micro-galvanic coupling accelerating the corrosion reactions and therefore the coating precipitation. It was shown that the addition of H2O2 accelerates cerium hydroxide/oxide deposition and
changes the coating morphology from localized deposited islands to a continuous layer with a crack-mud structure in some regions. Coatings deposited from hydrogen peroxide free solutions possessed a higher amount of Ce (III) compared to the coatings deposited form solutions with hydrogen peroxide, which showed higher percentage of Ce (IV). The treated samples showed significant improvement in their corrosion resistance compared to bare aluminum samples. Higher amount of silicon in the aluminum alloy makes it more active during immersion in the conversion solution. Therefore, these samples cannot be treated using aggressive solutions (containing NaCl and H2O2).
Acknowledgments
The authors would like to thank COMPtech AB, Sweden for the production of the component and the technical support. Dr. Nils-Eric Andersson is gratefully acknowledged for performing FIB/SEM analysis.
References
1. B. Hinton, D. Arnott, and N. Ryan, in "Met. Forum", Vol. 7, p. 211-217. Pergamon Press, 1984. 2. B. Hinton, D. Arnott, and N. Ryan, in "Mater. Forum", Vol. 9, p. 162-173, 1986.
3. B. R. W. Hinton, J. Alloys Compd., 180 (1), 15-25 (1992).
4. M. Olivier, A. Lanzutti, C. Motte, and L. Fedrizzi, Corros. Sci., 52 (4), 1428-1439 (2010). 5. C. S. Linz and S. K. Fang, J. Electrochem. Soc., 152 (2), B54-B59 (2005).
6. C. Wang, S. Zhu, F. Jiang, and F. Wang, Corros. Sci., 51 (12), 2916-2923 (2009). 7. Y. L. Lee, F. J. Chen, and C. S. Lin, J. Electrochem. Soc., 160 (1), C28-C35 (2013). 8. K. Brunelli, M. Dabalà, I. Calliari, and M. Magrini, Corros. Sci., 47 (4), 989-1000 (2005). 9. Y. Kobayashi and Y. Fujiwara, Electrochim. Acta, 51 (20), 4236-4242 (2006).
10. J. Creus, F. Brezault, C. Rebere, and M. Gadouleau, Surf. Coat. Technol., 200 (14–15), 4636-4645 (2006). 11. E. Onofre-Bustamante, M. A. Domínguez-Crespo, A. M. Torres-Huerta, A. Olvera-Martínez, J.
Genescá-Llongueras, and F. J. Rodríguez-Gómez, J. Solid State Electrochem., 13 (11), 1785-1799 (2009).
12. M. A. Arenas, M. Bethencourt, F. J. Botana, J. de Damborenea, and M. Marcos, Corros. Sci., 43 (1), 157-170 (2001).
13. Y. Xingwen, C. Chunan, Y. Zhiming, Z. Derui, and Y. Zhongda, Corros. Sci., 43 (7), 1283-1294 (2001). 14. A. E. Hughes, J. D. Gorman, P. R. Miller, B. A. Sexton, P. J. K. Paterson, and R. J. Taylor, Surf. Interface
Anal., 36 (4), 290-303 (2004).
15. P. Campestrini, H. Terryn, A. Hovestad, and J. H. W. de Wit, Surf. Coat. Technol., 176 (3), 365-381 (2004). 16. C. Wang, F. Jiang, and F. Wang, CORROSION, 60 (3), 237-243 (2004).
17. N. Birbilis, R. G. Buchheit, D. L. Ho, and M. Forsythb, Electrochem. Solid-State Lett., 8 (11), C180-C183 (2005).
18. L. E. M. Palomino, I. V. Aoki, and H. G. de Melo, Electrochim. Acta, 51 (26), 5943-5953 (2006). 19. C. M. Rangel, T. I. Paiva, and P. P. da Luz, Surf. Coat. Technol., 202 (14), 3396-3402 (2008).
21 20. A. de Frutos, M. A. Arenas, Y. Liu, P. Skeldon, G. E. Thompson, J. de Damborenea, and A. Conde, Surf.
Coat. Technol., 202 (16), 3797-3807 (2008).
21. P. S. Jones, P. Yu, W. R. Pinc, M. J. O'Keefe, W. G. Fahrenholtz, and T. J. O'Keefe, Int. J. of Appl. Ceram.
Technol., 5 (1), 63-73 (2008).
22. D. Lau, A. M. Glenn, A. E. Hughes, F. H. Scholes, T. H. Muster, and S. G. Hardin, Surf. Coat. Technol., 203 (19), 2937-2945 (2009).
23. D. K. Heller, W. G. Fahrenholtz, and M. J. O’Keefe, J. Electrochem. Soc., 156 (11), C400-C406 (2009). 24. W. Pinc, S. Maddela, M. O'Keefe, and W. Fahrenholtz, Surf. Coat. Technol., 204 (24), 4095-4100 (2010). 25. D. K. Heller, W. G. Fahrenholtz, and M. J. O’Keefe, Corros. Sci., 52 (2), 360-368 (2010).
26. H. Shi, E.-H. Han, and F. Liu, Corros. Sci., 53 (7), 2374-2384 (2011).
27. D. K. Heller, W. G. Fahrenholtz, and M. J. O'Keefe, Mater. Charact., 62 (11), 1071-1075 (2011).
28. F. Andreatta, M. E. Druart, A. Lanzutti, M. Lekka, D. Cossement, M. G. Olivier, and L. Fedrizzi, Corros.
Sci., 65 376-386 (2012).
29. A. C. Balaskas, M. Curioni, and G. E. Thompson, J. Electrochem. Soc., 161 (9), C389-C394 (2014). 30. L. Paussa, F. Andreatta, D. De Felicis, E. Bemporad, and L. Fedrizzi, Corros. Sci., 78 215-222 (2014). 31. L. Paussa, F. Andreatta, N. C. Rosero Navarro, A. Durán, and L. Fedrizzi, Electrochim. Acta, 70 25-33
(2012).
32. X. Yu and G. Li, J. Alloys Compd., 364 (1–2), 193-198 (2004).
33. B. Y. Johnson, J. Edington, and M. J. O’Keefe, Mater. Sci. Eng., A, 361 (1–2), 225-231 (2003).
34. B. F. Rivera, B. Y. Johnson, M. J. O'Keefe, and W. G. Fahrenholtz, Surf. Coat. Technol., 176 (3), 349-356 (2004).
35. B. Y. Johnson, J. Edington, A. Williams, and M. J. O'Keefe, Mater. Charact., 54 (1), 41-48 (2005). 36. S. Joshi, W. G. Fahrenholtz, and M. J. O'Keefe, ECS Trans., 28 (24), 217-228 (2010).
37. S. Joshi, B. L. Treu, M. J. O’Keefe, and W. G. Fahrenholtz, J. Electrochem. Soc., 158 (3), C88-C93 (2011). 38. S. Joshi, W. G. Fahrenholtz, and M. J. O'Keefe, Surf. Coat. Technol., 205 (17–18), 4312-4319 (2011). 39. W. G. Fahrenholtz, M. J. O'Keefe, H. Zhou, and J. T. Grant, Surf. Coat. Technol., 155 (2–3), 208-213 (2002). 40. S. Joshi, W. G. Fahrenholtz, and M. J. O’Keefe, Appl. Surf. Sci., 257 (6), 1859-1863 (2011).
41. M. Bethencourt, F. J. Botana, M. J. Cano, and M. Marcos, Appl. Surf. Sci., 189 (1–2), 162-173 (2002). 42. M. Bethencourt, F. J. Botana, M. J. Cano, and M. Marcos, Appl. Surf. Sci., 238 (1–4), 278-281 (2004). 43. M. Dabalà, E. Ramous, and M. Magrini, Mater. Corros., 55 (5), 381-386 (2004).
44. S. Kiyota, B. Valdez, M. Stoytcheva, R. Zlatev, and J. M. Bastidas, J. Rare Earths, 29 (10), 961-968 (2011). 45. B. Valdez, S. Kiyota, M. Stoytcheva, R. Zlatev, and J. M. Bastidas, Corros. Sci., 87 141-149 (2014). 46. M. Dabalà, L. Armelao, A. Buchberger, and I. Calliari, Appl. Surf. Sci., 172 (3–4), 312-322 (2001). 47. D.-c. Chen, W.-f. Li, W.-h. Gong, G.-x. Wu, and J.-f. Wu, Trans. Nonferrous Met. Soc. China, 19 (3),
592-600 (2009).
48. M. Kanani, I. Danaee, and M. H. Maddahy, Mater. Corros., 65 (11), 1073-1079 (2014). 49. A. Decroly and J.-P. Petitjean, Surf. Coat. Technol., 194 (1), 1-9 (2005).
50. A. Pardo, M. C. Merino, R. Arrabal, F. Viejo, and M. Carboneras, J. Electrochem. Soc., 153 (2), B52-B60 (2006).
51. A. Pardo, M. C. Merino, R. Arrabal, F. Viejo, and J. A. Muñoz, Appl. Surf. Sci., 253 (6), 3334-3344 (2007). 52. T. G. Harvey, Corr. Eng. Sci. Technol, 48 (4), 248-269 (2013).
53. M. Bethencourt, F. J. Botana, M. J. Cano, R. M. Osuna, and M. Marcos, Mater. Corros., 54 (2), 77-83 (2003). 54. F. H. Scholes, C. Soste, A. E. Hughes, S. G. Hardin, and P. R. Curtis, Appl. Surf. Sci., 253 (4), 1770-1780
(2006).
55. B. L. Treu, S. Joshi, W. R. Pinc, M. J. O'Keefe, and W. G. Fahrenholtz, J. Electrochem. Soc, 157 (8), C282-C287 (2010).
56. D. Zhao, J. Sun, L. Zhang, Y. Tan, and J. Li, J. Rare Earths, 28 371-374 (2010).
57. D. R. Arnott, N. E. Ryan, B. R. W. Hinton, B. A. Sexton, and A. E. Hughes, Appl. Surf. Sci., 22/23 236-251 (1985).
58. S. Geng, P. Yu, M. J. O’Keefe, W. G. Fahrenholtz, and T. J. O’Keefe, J. Appl. Electrochem., 40 (3), 551-559 (2010).
59. A. E. Hughes, F. H. Scholes, A. M. Glenn, D. Lau, T. H. Muster, and S. G. Hardin, Surf. Coat. Technol., 203 (19), 2927-2936 (2009).
60. W. Pinc, S. Geng, M. O'Keefe, W. Fahrenholtz, and T. O'Keefe, Appl. Surf. Sci., 255 (7), 4061-4065 (2009). 61. J. O. Park, C. H. Paik, Y. H. Huang, and R. C. Alkire, J. Electrochem. Soc., 146 517-523 (1999).
22 63. R. Arrabal, B. Mingo, A. Pardo, M. Mohedano, E. Matykina, and I. Rodríguez, Corros. Sci., 73 342–355
(2013).
64. M. Eslami, F. Deflorian, M. Payandeh, A. E. W. Jarfors, and C. Zanella, in "EuroCorr 2016", Montpellier, 2016.
65. M. Payandeh, A. E. W. Jarfors, and M. Wessén, Metall. Mater. Trans. A, 47A 1215-1228 (2016). 66. W. Pinc, S. Maddela, W. Fahrenholtz, and M. O’Keefe, ECS Trans., 28 (24), 187-201 (2010).
67. M. Romeo, K. Bak, J. El Fallah, F. Le Normand, and L. Hilaire, Surf. Interface Anal., 20 (6), 508-512 (1993). 68. S. S. A. Rehim, H. H. Hassan, and M. A. Amin, Corros. Sci., 46 1921–1938 (2004).
69. C. M. Dinnis, A. K. Dahle, and J. A. Taylor, Mater. Sci. Eng., A, 392 (1–2), 440-448 (2005).