Investigation of radiation
doses in conjunction with
CT thorax examinations
performed in Vietnam
SUBJECT AREA: Radiography
AUTHORS: Amanda Hammerö & Ellinore Morberg EXAMINATOR: Carina Johansson, assistant professor
SUPERVISOR: Berit Björkman Dr.Fil. and Doan Van Dung Dr.Med.
JÖNKÖPING 2016 June
Summary
Lung cancer is today causing a higher mortality rate than other types of cancer all over the world and there are two types of lung cancer: non- small cell lung cancer and small cell lung cancer. Computed Tomography (CT) is one method to detect lung cancer and is today an important part of the radiological diagnostics of tumours. The purpose of this study was to investigate image quality of a CT thorax examination with the question of issue being tumor obtained with a dose according to ALARA (As low as reasonably achievable). The study was designed with a quantitative approach where three different simulated tumours were put in a thorax phantom and scanned in the CT. A total of 12 images were performed. Two radiologists reviewed the images using European Guidelines and the outcome was used for statistical calculations. The results of the reviewing were identical and all the tumours could be found in each of the images regardless of the decrease in mAs. In conclusion, with the knowledge from this study it may be possible to decrease the radiation dose to the patients going through a CT-thorax examination with the question of issue being tumour and still provide sufficient image quality for the radiologist to set a diagnose.
Sammanfattning
Undersökning av stråldoser i samband med DT-thorax undersökningar utfört i Vietnam: En fantomstudie
Lungcancer är idag den dödligaste cancerformen I hela världen. Det finns två olika typer av cancer: icke småcellig cancer och småcellig cancer. Datortomografi (DT) är en metod för att upptäcka cancer och är idag en viktig del inom den radiologiska diagnostiken av tumörer. Syftet med studien är att undersöka bildkvalitén under DT thorax undersökningar med frågeställning tumörer med samtidigt som ALARA följs. Studien följer en kvantitativ metod där 3 olika simulerade tumörer placerades i en thorax fantom och scannades av DT. Totalt 12 undersökningar utfördes. Två radiologer granskade bilderna med hjälp av European Guidelines och resultatet användes för statistiska beräkningar. Resultatet från granskningen var identiskt och alla tumörer kunde hittas i varje bild trots sänkningen i mAs. Med kunskapen från denna studie kan det vara möjligt att sänka stråldosen till patienter som genomgår DT-thorax undersökningar med frågeställning tumörsjukdom och fortfarande bibehålla tillräckligt god bildkvalité för diagnostiken av radiologerna.
Index
Introduction ... 1
Background ... 1
Vietnam ... 1 Radiographer ... 2 Thorax anatomy ... 2 Pathology ... 3 Computed tomography ... 4 Radiation dose ... 7Rationale ... 9
Purpose ... 9
Material and method ... 9
Computed tomography ... 10 Chest Phantom N1 ... 10 Data collection ... 12 Data analysis ... 13
Ethical Considerations ... 14
Results ... 14
Discussion ... 16
Method discussion ... 16 Result discussion ... 17Conclusion ... 20
Acknowledgements ... 20
References ... 21
Appendix 1
Appendix 2
Appendix 3
Introduction
A scholarship for Minor Field Studies was granted in order to do a data-collection in the student-clinic at University of Medical Technology and Pharmacy in Da Nang, Vietnam. For the data-collection, a thorax phantom was used, in which a variety of simulated tumors were placed. The phantom was scanned in the Computed
Tomography (CT) using different scan-parameters in order to study how low the radiation dose can be to still get as good image quality as possible. This study was conducted in Vietnam because previous studies have shown that Europe have a little bit lower doses compared to Asia (1). Based on that, there might be potential for improvement regarding decreased doses in CT-examinations and still obtain a sufficient image quality. Another reason why the study was conducted in Vietnam was because the University in Da Nang kindly let us use their equipment in the student-clinic for the data collection (appendix 1 and 2).
Background
Vietnam
The official name of Vietnam is Cong Hoa Xa Hoi Chu Nghia Viet Nam. We did our Minor Field Studies ina city called Da Nang, one of the largest cities in Vietnam. In Vietnam the population is 90 million people and the capital is Hanoi. Approximately 80 % of the population does not belong to a religion but the rest are Buddhists. In Vietnam the mother tongue is Vietnamese but also a little bit of English and French is spoken. The climate is very tropical with large temperature variations between north and south. The north region in Vietnam has four seasons and the south region, south of Da Nang, have two seasons (2).
In Vietnam, there are 54 recognized ethnic groups but a large majority belongs to the Viet people (also known as kinh). The Viet people are dominating the country in politics, economy and culturally. Almost half of Vietnams labor force is in the farming. A fifth are working in the industry and the rest receive their income from services. There is officially one third of the labor force that work in the informal sector (2).
Between 1962 -1971 an important incident in Vietnam’s history appeared. That was the time for the preparation known as Agent Orange. US military forces sprayed nearly 19 million gallons of herbicides over approximately 3.6 million acres in South Vietnam. The reason for Agent Orange was to strip the thick jungle canopy that helped conceal opposition forces. The main reason for lung cancer is tobacco,
however lung cancer has also been associated with exposure to other substances, such as arsenic 8 and phenoxy herbicides that were used by the US military forces in Agent Orange. However the study does not have enough evidence regarding an eventual increased risk in lung cancer associated with service in Vietnam at this time (3).
Radiographer
In Vietnam the equivalent profession to a radiographer in Europe is called radiological technologist. Radiologists and radiographers together share the
responsibility for the patient’s safety. They are both responsible for the radiation dose obtained in conjunction with the radiographic examination. Therefor as a
radiographer it is our duty if possible to decrease the radiation dose. In our
profession we are responsible for our self-development and improvement proposals (4).
As a radiographer it is also important to be respectful toward the patient no matter age, colour, faith, culture, gender, disabled or any disease, nationality, social status and sexual orientation. An investigation should only be done if the benefit outweighs the risk. It is our obligation to act in a way so confidence and trust in the profession is maintained. A radiographer works for human rights and peoples equal value (4).
Thorax anatomy
The thorax anatomy contains: trachea, bronchi and bronchioles and lungs. Trachea is a tubular passageway for air. Trachea is located anterior to the esophagus and it extends from larynx to the upper part of T5 (fifth thoracic vertebra) and then it divides into right and left primary bronchi. Cartilage is supporting the trachea and the wall of trachea is creased with mucous membrane. The mucous membrane consist ciliated columnar cells, goblet cells and basal cells (5).
The trachea divides into right primary bronchus (goes to right lung) and left primary bronchus (goes to left lung). The primary bronchus contains incomplete rings of cartilage and pulmonary blood vessels, lymphatic vessels and nerves enter and exit the lungs with the bronchi. When entering the lungs, primary bronchi divide to form the secondary bronchi. It forms one for each lobe of the lung. As the secondary bronchi continues to branch it forms smaller bronchi called tertiary bronchi. These divide several times and leads to bronchioles. Bronchioles branch into smaller tubes called terminal bronchioles (5).
The lungs are located in the thoracic cavity. The heart and other structures in mediastinum separate each lung from each other. The pleural membrane (double-layered serous membrane) encloses and protects the lungs. The outer layer (parietal pleura) is attached to the wall of the thoracic cavity and diaphragm. The inner layer is called the visceral pleura and it is attached to the lungs. Between the outer and the inner layer is a slight space called the pleural cavity. The pleural cavity holds a lubricating fluid secreted by the membranes. This lubricating fluid reduces friction between the membranes. It is allowing them to slide over one another easily during breathing (5).
Pathology
An article published Nawi et al (2009) shows that in less-developed regions like Asia pacific countries, the estimated rates for lung cancer reach higher levels of mortality than other countries (6). Lung cancer is right now the leading cause of cancer deaths worldwide. In Vietnam, lung cancer is ranked the second most common reason for mortality in the population (7).
The epidemic of lung cancer is increasing and there are different ways of detecting the disease earlier and these are imaging using the chest radiograph and CT. In a study by Van Beek et al (2015) about lung cancer screening they concluded that the CT is a better choice than the chest radiograph. The chest radiograph is though cheaper than the CT and is also more commonly available so it could still play a potential roll in the screening of lung cancer. In general, they mention that low-dose CT screening for patients with high risk of developing lung cancer is a cost-effective method, which will lead to earlier detection and better treatment (8).
Tumors occur in most of the cases from a cell, called monoclonal tumor. This characterizes especially tumors caused by radiation and chemical substances. In some cases the tumor diseases can occur in more cells at the same time and that is called a polyclonal tumor. Substances that initiate the development of a tumor are called initiations. Initiations are for example some chemicals and ionizing radiation. When there is a mutation in a cell there may be a genetic damage that leads to a genetic changed cell that own the ability to multiply itself and this could lead to cancer. All mutations however do not lead to cancer development. The cell can die or lay at rest after a genetic damage has occurred (9).
In this investigation the focus will be on thorax tumors and the most common one is lung cancer. Lung cancer can be divided into two main groups: non-small cell lung cancer and small cell lung cancer. Non-small lung cancer affects about 80% of the people who are diagnosed with lung cancer. The main reason of lung cancer is smoking, both active and passive. Even ionizing radiation, asbestos, car exhaust and industrial emissions are factors that may contribute to the development of lung cancer, especially when combined with smoking (10).
Symptoms
Many different symptoms may occur in lung cancer. They are unfortunately often late in the progression of the disease, which complicates early detection. Cough is the most common symptom and cough that changes character in smokers should lead them to medical appointments, as well as coughing up blood (hemoptysis). Other symptoms are shortness of breath, pain in the chest and pneumonia. Pneumonia may occur if the tumor blocks the airways and causes inflammation and infection (10).
Computed tomography
One of the methods for detecting lung cancer is CT, which is going to be used in this study. CT is often used for metastasis investigation (10).
CT is today an important part of the radiological diagnostics of tumors. CT has replaced the conventional X-ray imaging in many areas and has supplied several new applications. CT provides transverse slice 3D images of the human body in digital form. Each single scan aims to determine the composition of one transverse cross-section. CT visualizes both organs and tissues of the body (11).
It requires special dosimetric measurements to calculate the dose in CT. These are: Computerized Tomography Dose Index (CTDI), the weighted CTDI (CTDIw) for a single slice and the Dose Length Product (DLP) for a complete examination. An introduction of this will continue bellow (12).
First up is Computerized Tomography Dose Index. CTDI is defined by the following equation:
𝐶𝑇𝐷𝐼 = 𝑇1 𝐷 𝑧 𝑑𝑧
!! !!
T stands for nominal slice thickness and D (z) stands for the dose profile along a line parallel to the Z-axis (tube rotation axis). CTDI combines the radiation dose within and beyond a single slice (12).
Next up is CTDIw. CTDIw is used for estimating the average dose over a single slice. The purpose of this is to regard variations in dose values between the periphery and center of the slice (12).
To regulate the radiation dose in one tube rotation in multidetector-row scanners CTDIvol is used. DLP stands for Dose Length Product. DLP is used to calculate the dose for a whole series of slices or the total radiation exposure to the patient (12). The parameter that reflects the risk of a non-uniform exposure in terms of a whole body exposure is called effective dose. Effective dose is a concept, which is used to normalize partial body irradiations comparative to the whole body irradiations to compare the risk. MilliSieverts (mSv) is the unit, which effective dose is expressed in. mSv can be compared to the effective dose from other sources of ionizing radiation, such as background radiation (e.g., radon, cosmic radiation, etc.). Depending on the location these are typically in the range of 1-3 mSv (12).
International Commission on Radiological Protection (ICRP) underlines that effective dose is intended for use as a protection quantity on the basis of reference values. This should not be used for epidemiological evaluations and not for
investigations of human exposure (12).
Choosing exposure parameters can be difficult and depends on many different aspects. Example how big the anatomical region for scanning is, the size and what type of pathology the patient has. The parameters that are picked should result in adequate good image quality in order to facilitate the clinical diagnosis. Image noise and its effect on image quality is the central problem for choosing the expose
parameters. These are some parameters that are in control of operators (12):
The parameter mAs affects image quality and dose. It is the product of tube current and rotation time and is an important parameter that is related to image noise.
Radiation dose is linearly related to mAs when kVp and filtration is fixed. This means that by reducing the mAs by half, the patient dose will be reduced by half. The
reduction by half of the mAs will though give 50 % increase in image noise (12). The parameter kV is not provided in most CT systems to have the possibility to adjust kilo voltage (kV) or kilo voltage peak (kVp), but is possible in some settings. Tube kVp is one of them and it determines the quality and quantity of radiation. The X-ray beams intensity is normally proportionate to square of kVp applied to the tube. Minimal changes in the tube potential value could result in important changes of image noise and radiation dose (12). If decreasing the kVp with 20 kVp the dose to the patient will decrease with 35-40%. By lowering the kVp the quantum mottle and artifacts can increase (13).
The scan length for a specific examination can vary because of these aspects: patient pathology, patient length and size, pathology and how much work experiences the radiographer has. The amount of body length covered in scanning will affect the DLP but not the CTDI value (12).
The pitch depends on collimation and table feed. Pitch will be increased if the table moves faster and it will also be less time for the patient in the tube, which will lead to reduction in radiation dose because of increased exposure time. If the table is moving faster this will result in certain artifacts and these artifacts could have a big impact on the image quality (12).
Lung window usually has a mean of -600 to -700 Hounsfield units. Lung window shows the best lung anatomy, pathology and contrasting soft-tissue structures with surrounding air-filled lung parenchyma. Mediastinal window has a mean of 20 to 40 Hounsfield units. That window shows soft-tissue anatomy in the mediastinum and in other areas of the thorax. Mediastinal window shows differentiations of fluid, fat, calcium, tissue and contrast-opacified vessels. This window can also facilitate in showing pleura disease, the hila, consolidated lung and structures of the chest wall. To detect lung embolism or dissection diagnose, a window with higher mean of HU than what the mediastinal window can provide is used (14).
Radiation dose
The ALARA (As low as reasonably achievable) principle is the main rule when
performing optimizing in every radiology department. CT is restricted as a procedure of high radiation dose. Therefore it is important that it is requested by properly trained practitioners to collaborate with CT radiologists. International Basic Safety Standards stage that only if the case has a clinical indication it should be completed (12).
When it comes to patient positioning its important that the patient is placed centered in the CT gantry. This will decrease artifacts and it increases the distance from the radiation source, which means that the dose will decrease (13).
The best way of reducing the dose is to lower the mAs. mAs can have effects in image quality but it does not usually have an impact in clinical diagnosis especially not in chest and pelvic exams (12).
CT is today an important method for diagnosis, follow-up and aid in intervention. CT is a resource that saves many lives and has many important benefits, for example
when quick decisions need to be taken in the emergency. Studies about CT developing are increasing all over the world because of the increasing in CT examinations (1). In a study by Muhogora et al (2009) the aim of the study was to investigate if the CT doses to adult patients in developing countries are higher than international
standards. Table 1 shows that Eastern Europe has lower doses compared to Asia. The brackets show the reference value, which means that Asia remains within the
framework set but in comparison to Eastern Europe they have higher dose of radiation (1).
Table 1. Reference value by region. Mean CTDIw(mGy).
By Region
Chest Chest HR
Africa 9.2-24.3 6.8-25.8 Asia 12-18.6 14.4-24.3 Eastern Europé 6.9-21.3 10-20.6
In the article it is also apparent why this could be so and the reasons may be that the increasing frequency of CT examinations, changes in clinical applications and the increasing contribution of CT to collective dose. The study showed that in many developing countries there is lack of information on obtainable methods and also the awareness of CT dose. This could therefore lead to higher patient doses than
necessary (1).
In the same article, it appears that none of the developing countries are objectively changing CT exposure parameters to patient size. Differences in the level of filtration, collimator, detector efficiency and different iso-center distances may have an impact on patient dose. Not many CT facilities had automatic exposure control (AEC)
devices. For a standard-sized patient, AEC could reduce the dose with about 50% in some anatomical regions (1).
Another study that investigated lung cancer screening states that for reducing the radiation dose a fixed low tube current (mA) should be used. This study was made to decide optimal scan conditions for AEC in a CT, at low-dose chest screening, and to provide a consistent image quality without increasing the dose (15).
Rationale
CT examinations are increasing a lot worldwide (1), and studies have shown that Asia has higher radiation doses than Eastern Europe. This is a risk for both patients and staff who are staying in this environment. Therefore it is important that the patient safety regarding CT radiation doses is prioritized. As a radiographer, our task is to decrease the radiation dose to the patient if possible. We must also help to develop and improve the care (4).
Lung cancer is now the form of cancer causing most death around the world, so it is important to be able to set reliable diagnosis based on examinations with good image quality. However, based on previous research it has been shown that theoretically it is possible to combine good image quality with decreased radiation dose to patient. The most effective way to reduce the radiation dose is by lowering mAs. Lowered mAs effects the image but often not the clinical diagnosing. And so it might be that the higher radiation doses reported in previous research performed in Asia can be decreased and still obtain an adequate image quality (7).
Purpose
The purpose of this study was to investigate image quality of a CT thorax examination with the question of issue being tumor obtained with a dose according to ALARA (As low as reasonably achievable).
Material and method
This study is an experimental study using a quantitative method. The data collection contained measurements on a Chest Phantom N1 (Kyoto Kagaku) inherited by Da Nang University of medical technology and pharmacy. This type of phantom is used to test or evaluate the image quality of a CT-scanner (11).
Computed tomography
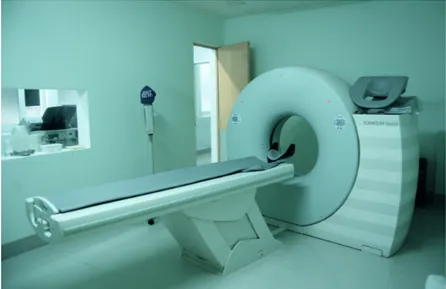
The machine that has been used in this study is a Siemens Somatom Spirit- quick starter syngo 2007P, made in Germany. (Figure 1)
Figure 1. Siemens Somatom Spirit- quick starter syngo 2007P. Photo: Amanda Hammerö
Chest Phantom N1
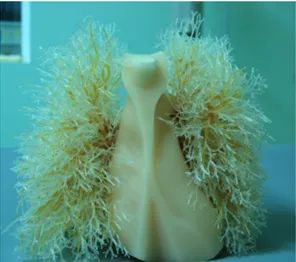
This phantom is designed for examinations with conventional x-ray and CT scanning. It allows us to perform images that are similar to the human body (chest). The
phantom contains pulmonary vessels and bronchus up to the first bifurcation. It is placed in the phantom lung field. The arms of the phantom are placed so lateral and CT scanning is allowed. The phantom also has a mediastinum and pulmonary vessels that are put together as one piece (Figure 2 and 3).
In the mediastinum heart and trachea is included. The phantom consist of three main parts:
• Main body (chest wall) • Mediastinum
• Abdomen (diaphragm)
Figure 2. Thorax phantom. Photo: Figure 3. Pulmonary vessels. Photo: Amanda Hammerö Amanda Hammerö.
The size of the phantom is 45 cm and the measurements around the chest 94 cm. It weights 18 kg. In table 2 the material of the phantom is described.
Table 2. Material of phantom
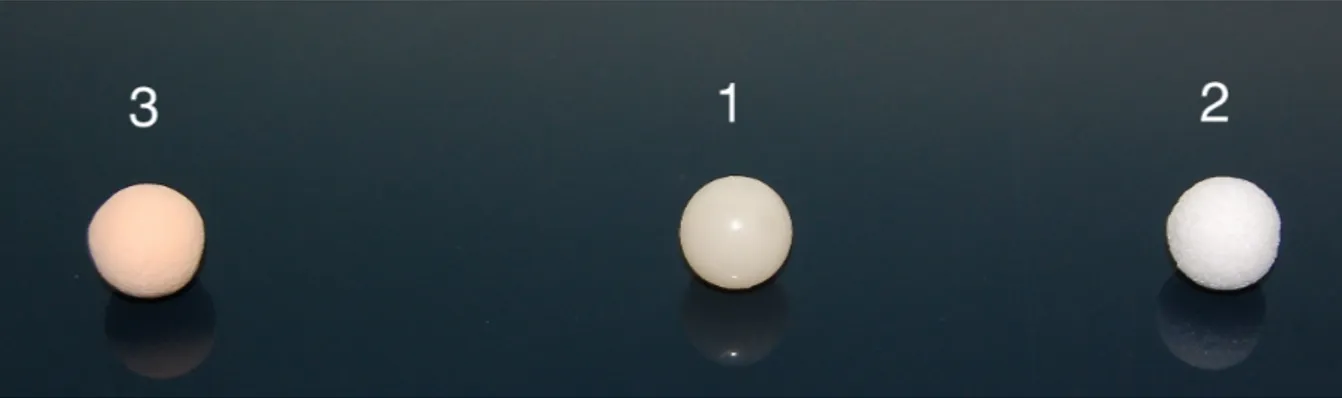
Three types of simulated tumors were used. Table 3 and figure 4 shows the simulated tumors. They come in different color, Hounsfield number and material. Each
simulated tumor is 10 mm in diameter and the shape sphere.
Table 3. Simulated tumors
Color Hounsfield number Material
1 Cream HU +100 polyurethane SZ50 and hydroxyapatite 2 White HU -800 Urethane foam
3 Pale orange HU -630 Urethane foam Soft tissue and vessels Polyurethane (gravity1.06)
Figure 4. Simulated tumors. Number 3: Pale orange tumor HU -630. Number 1: Cream tumor HU +100. Number 2: White tumor HU -800. Photo: Amanda Hammerö.
Data collection
First the white simulated tumour (10mm) was put inside the phantom. The phantom was placed in the CT- scanner head first- supine. The first pace contained tests with different mAs to work out how many steps, were appropriate when reducing the mAs. The only parameter that was used was mAs because it is the best way of reducing the radiation dose (12). To come to a suitable reduction the tumour appearance was followed in each reduction of the mAs. This was made to see the differences in each image. With a small reduction of the mAs the image will look similar to each other, that’s why the big step of 15 was used.
This was done in consensus with thesupervisors. After that an audit was made to analyse how much the image quality has been decreased in each mAs change. The conclusion was that four images for each simulated tumour were going to be performed with 15 steps (mAs steps) for each change. Except the last image, which only could be 13 because the machine could not go lower. This procedure was repeated for each simulated tumour. A total of 12 images were performed.
Protocol for ThorRoutine was used for imaging. First a Topogram of the phantom was performed. After that an image with the standard protocol was performed. For the second image the mAs/ref were lowered from 40/60 to 30/45. The third image was lowered even more from 30/45 to 22/30. The last image was lowered to the lowest possible, which is 17/17. Two different windows were used: mediastinal window and lung window. Ref which stands for mAs reference value is the pre-sets for the CT
scanner. mAs stands for the value that the CT scanner gives automatically to the phantom.
Data analysis
This study is a blinded study meaning that the radiologists were anonymous and does not know where the tumors were put in the phantom. The writers did not know who the radiologists were. As a guide for the reviewing the European Guidelines for image quality (16) was used (figure 5). Appendix 3 shows a template for the radiologist to use when reviewing. Two radiologists were reviewing and sending their dictation back to us anonymous. The reason for this procedure is because the radiologists have different work experience and each of them must be able to review the images
correctly with help of European Guidelines for image quality.
The images were named image 1, image 2 and image 3 so the radiologists did not know which tumors that were put in each image. Image 1 consisted the tumor with 100 Hu, image 2, the tumor with 800 Hu and image 3, consisted the tumor with -630 Hu.
Statistical package for the social sciences (SPSS) has been used in this study for the calculations of how the mAs were increasing, which can be found in figure 6.
Spearman correlation was used to calculate the correlation between the radiologist’s answers from the template and the correlation was considered significant at 0,01 level.
IMAGE CRITERIA ACCORDING TO EUROPEAN GUIDELINES (16). 1. Diagnostic requirements for chest, general.
1.1 Visualization of 1.1.1 Entire thoracic wall
1.1.2 Entire thoracic aorta and vena cava 1.1.3 Entire heart
1.1.4 Entire lung parenchyma
1.1.5 Vessels after intravenous contrast media 1.2 Critical reproduction
1.2.1 Visually sharp reproduction of the thoracic aorta
1.2.2 Visually sharp reproduction of the anterior mediastinal structures, including thymic residue (if present)
1.2.3 Visually sharp reproduction of the trachea and main bronchi 1.2.4 Visually sharp reproduction of the paratracheal tissue
1.2.5 Visually sharp reproduction of the carina and lymph node area 1.2.6 Visually sharp reproduction of the oesophagus
1.2.7 Visually sharp reproduction of the pleuromediastinal border
1.2.8 Visually sharp reproduction of large and medium sized pulmonary vessels 1.2.9 Visually sharp reproduction of segmental bronchi
1.2.10 Visually sharp reproduction of the lung parenchyma
1.2.11 Visually sharp reproduction of the border between the pleura and the thoracic wall
CRITERIA FOR RADIATION DOSE TO THE PATIENT
CTDIw : Routine chest: 30 mGy DLP : Routine chest: 650 mGy cm Figure 5. European Guidelines
Ethical Considerations
A radiographer works in a high technology environment with nursing, medicine, radiation physics, imaging and functional medicine. A radiographer operates for all human rights and culture rights, the right to live, the right to dignity and that everyone are treated with respect. Radiographers also conduct research and development and are responsible for research ethics guidelines (4).
Ethics is about building up, stimulate and keep alive a consciousness and a discussion about how to act. Science is important for both the individuals and for the
development of society (17).
Since we are using a phantom no people are getting harmed. However, we have considered ethical issues in regard to Vietnamese culture and people, how the
Vietnamese people live and work in Da Nang. The idea is to minimize the risk related to radiation for both staff and patients in conjunction with radiographic
examinations. It is important for us to respect them and present our study without any bias. We are aware that our study might be used in the future and that we therefore have to be very steady. The advantage of this study is to decrease the radiation dose and increase the patient safety.
Results
The results from the 2 radiologists reviewing shows that despite the decreased
radiation dose, tumors were detected while maintaining a sufficient image quality. In the process of gathering research data, it was detected that the results from both of the radiologists were identical. Two of the questions in the European Guidelines were not relevant for this study. One of the questions was about contrast media, which
were never used in the exams contained in this data collection. The other question was about if the lymphs could be visualized in the image but the phantom that has been used do not have lymphs. These two questions were the only ones that the two radiologists answered with no.
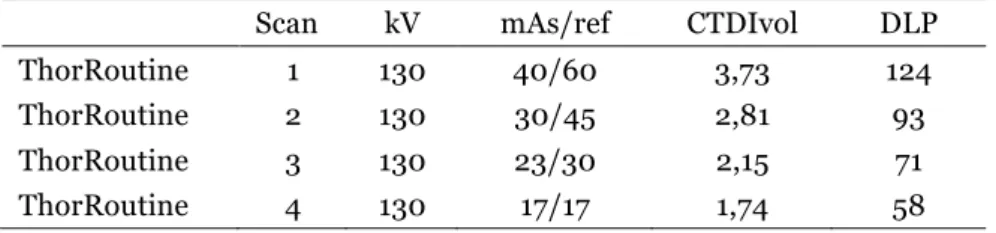
Table 4 shows the decrease of the radiation dose. kV 130 has been used for all the images and only the mAs has been changed with an decrease of 15 steps between each image acquisition. The last decrease could only be 13 because the CT-machine could not go any lower than that. The total radiation dose (DLP) has been decreased from 124 (mAs 60, which was the standard parameters) to 93 (mAs 45), 71 (mAs 30) and 58 (mAs 17). This is a decrease of 47 % (58/124=46,77*100=47%).
Table 4. Protocol of ThorRoutine scans
In the template for reviewing (appendix 3) the radiologists were asked to write a comment about what they found in the images, where the tumors could be found and in which image windows they could see it. They could find the tumors in every image but not all in both windows, often the tumors could only be found in the lung
window. The two different windows are mediastinal (soft-tissue) and lung window. Mediastinal window is standard and lung window is a window with different HU then mediastinal window that help detect tumors easier.
Radiologist 1 could see four out of 16 tumors in both windows. All four tumors that could be seen belonged to image 1, which had the tumor +100 HU. Radiologist 2 had exactly the same comments on the reviewing, only the tumor with +100 HU could be seen in both windows.
Calculations using Spearman correlation showed that correlation coefficient was 1,00 between the radiologists’ answers. This means that the radiologists described the 16 images equally. The correlation is significant at 0,01 level.
Scan kV mAs/ref CTDIvol DLP
ThorRoutine 1 130 40/60 3,73 124
ThorRoutine 2 130 30/45 2,81 93
ThorRoutine 3 130 23/30 2,15 71
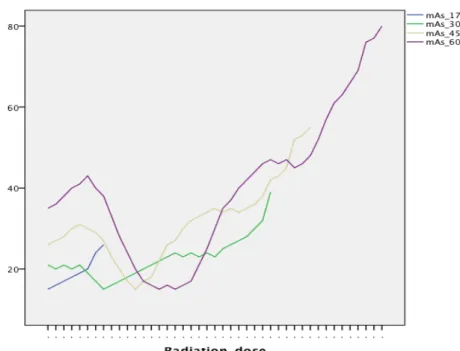
Figure 6 shows the highest and the lowest mAs for every step the mAs were decreased.
Figure 6. Highest and lowest mAs for the investigation
Figure 6 is illustrating how the radiation dose is changing depending on the thickness of tissue, for each decrease of radiation doses. The ups and downs in the lines show how the CT have changed the mAs automatically when it measured that more or less radiation is needed.
Discussion
Method discussion
The Hounsfield for lungs is approximately -800 HU. Water density has zero in HU and air has -1000 HU. The lungs are filled with air and are therefore near -1000 HU. The tumors used in this study had different HU and is visualized differently in the images. The closer the tumors HU are to -800 the harder they will be to find. One of the tumors has HU +100, which is a big difference from -800, therefore these tumors will be much easier to find. It does not matter how much the mAs is reduced these tumors will still be easy to detect (18).
That is the main reason why three different tumors were used, to do it more reality likely. Real tumors have different HU so just because one can be detected easy does
not mean that another will be so simple to find, for example the tumor with HU -800. However, it is urgent that all tumors can be detected even with the lowest mAs for a sufficient assessment.
To be able to have a lower mAs as standard the images quality must be good enough to discover all types of tumors. Another reason for using three different tumors and use different location for the tumors in each image were in order to make it a little bit hard for the radiologists to find the tumors, also more reality likely. If the tumors were placed at the same spot in every image the radiologist would know where to look for the tumors and probably find it easier than if he did not know where it could be found.
The phantom is similar to a human body but it is in one shape and form. Real human bodies are more complex. The human body comes in different size, anatomy, age, gender and medical history. Some people may have been treated for different diseases and operations where the organs have been removed or medical devices have been implemented. Therefore, no human being are exactly identical to each other. The thorax phantom is simulating a standard healthy human body. Based on that, it may be easier to detect tumors in a phantom than in a real human being. This study could not be performed on real humans, since it is not ethical right to do that. Even if the tumors could be detected and diagnosed at mAs 17, the radiologist may not be able to detect at the same mAs on a real patient.
Result discussion
Although the mAs were decreased as much as possible the radiologists were still able to see the tumors in every image. Even if some tumors must have been harder to find they could still find them. It is always a risk to decrease the dose because the risk of missing something important increases. The radiologists were able to find the tumors at 17 mAs, which mean that there was a possibility to lower the dose to the patient and get a decent image quality for diagnosing. Previous research showed that by using mAs 25 the CT scan produced satisfactory image quality and also reduced the CTDI and in this way they were protecting patients from unnecessarily radiation. Our results and the results from this study indicate the fact that the radiation dose can be reduced and still keep a decent image quality (19).
Lower the mAs to 17 may be unreasonable, but make some kind of lowering seems fair. By studying the tables and how the mAs reduces the radiologists may found a reasonable lowering for the mAs, which will reduce the radiation doses to patients. When the radiologists reviewed the images they were able to visualize all the tumors using lung window. This shows the importance of using the lung window setting. In a study mentioned previously, results showed the percentage of normal-quality images was higher in the lung window than in the mediastinal window. In concordance with our study, this shows the need and the meaning of having the lung window setting (19).
A large amount of studies has been performed about CT radiation reduction. Even if there is a lot of information in the medical community about radiation reduction, not many professionals decide to use this information. As an example a typical low dose examination is stone protocol (for question kidney stone). It has been shown that more than 90% of these examinations were performed with higher dose technique. This study has shown that professionals have ignored recommendation of CT dose reduction. Our study showed that the radiation dose can be reduced, but it could still be a long way for this information to reach the actual optimization of the CT radiation dose in the radiology department (20).
Previous studies and the results from our study show that this information cannot be ignored for patient’s sake and therefor it is needed to take this information into the practical actual part of the optimization and also raise awareness of the importance of dose reduction (21). An example of how the information can reach the professionals would be that the physicians, radiologists and radiographers take this information into action. There is a need for a better cooperation between the professions. Each profession has the responsibility to constantly optimize the radiation dose and we as radiographer have a huge responsibility for the improvement (4). Sometimes it feels that we all are scared to try to reduce the radiation dose but this is an important topic that needs constant development.
Earlier studies have found an ability to lower the radiation dose with help from simple adjustments. For example: mAs and kV reduction, reduction of scan coverage
and number of acquisitions. A phantom-study performed in China showed that they were able to reduce the effective dose by 53% to 90 % (20). In our study we were able to reduce the radiation dose with 47% and still get a decent image quality by only changing the parameter mAs.
ALARA is about optimization of CT radiation dose. It is not all about decreasing the radiation dose. It is about producingan acceptable diagnostic image with the lowest dose possible. Focus is image quality because that constrains the dose. Optimization is about doing the best for each individual. Dose optimization does not necessarily mean dose reduction because it can lead to poor image quality. An important factor is patient size. Different radiation doses need to be adjusted according to the patient size. Recommendation for radiation dose is 80 kV for infants, 100 kV for children, 120 kV for most adults, and higher voltages for obese adolescents and adults in CT examinations ofabdomen and pelvis (21). In our study we used 130 kV and a phantom, which represent a normal sized patient.
Using these parameters on a much bigger patient would result in poor images quality. That is why it is important not to only focus on the radiation dose but the focus is on optimization of the CT radiation dose. Our result shows that the radiation dose could be lower while maintaining a good images quality on an average patient, but the lowering could probably not go that far if the patient was obese, because bigger patients require more radiation dose. We chose not to change the kV because it was a fixed parameter, we only changed the mAs but we think this is worth considering in every changing of parameters. Good images quality should be in focus and try to achieve that with the lowest radiation dose possible (21).
In this study a helical CT scanner was used. This type of scanner performs good images with decent quality and radiation dose. The fact that CT scanners are
developing continuously makes the future bright for patients. An article about dual-energy of the lungs describes the current applications of Dual-dual-energy CT, the imaging techniques in the thorax with focus on diagnosis and characterization of pulmonary disorders. They come to the conclusion that dual-energy CT can give both anatomic and functional information about the lungs. The quality of the dual-energy CT has shown improvement in diagnosing lung disorders (22).
It is important to keep developing the CT scanners for better diagnosing. Better technique, better quality, lower radiation dose might give us an opportunity to diagnose much faster and would make it easier for us as radiographers, for the radiologists and especially for the patients. The radiation dose has shown to be
substantially lower than the reference value according to the European Guidelines on quality criteria for CT. By using the dual-energy technique it might obviate additional clinical tests (involving radiation investigations), which will decrease the net
exposure to the individual patient. Today the main reason not using this type of technique might be the cost of it (22).
Conclusion
This study shows that is was possible to reduce the radiation dose while maintaining sufficient image quality when using a phantom with simulated tumours. The
radiologists’ assessment was consistent which shows high credibility. Using the results the radiologist might come to the conclusion that a reduction of the mAs can be made. However, more research would be needed, and a suggestion could be to perform a similar study with real patients. This in order to evaluate the effect of the reduced radiation dose when detecting tumours in a human body of various sizes.
Acknowledgements
We want to say thank you to our supervisor in Sweden, Berit Björkman who has supported us through this thesis and journey. A big thank you to Dr. Dung which was our supervisor in Da Nang, Vietnam. We are very thankful for the cooperation with Danang University of Medical technology and pharmacy for letting us do the data collection at their student medical center.
References
1. Muhogora WE, Ahmed NA, Beganovic A, Benider A, Ciraj-Bjelac O, Gersha V et al. Patient doses in CT examinations in 18 countries: Initial results from
international atomic energy agency projects. Radiation Protection Dosimetry (2009), Vol. 136, No. 2, pp. 118–126.
2. Landguiden. Available at: http://www.landguiden.se/Lander/Asien/Vietnam [Retrieved: 2015-04-06]
3. Mahan CM, Bullmari TA, Kang HK, Selvin S. A case-contol study of lung
cancer among Vietnam veterans. Volume 39(8), August 1997, pp 740-747.
4. The Swedish society of radiographers. Code of Ethics for Radiographers.
5. Tortora GJ, Derrickson B. Essentials of anatomy and physiology. 9. ed., international student version. Singapore: Wiley; 2013.
6. Nawi NG, Winkler V, Hoang VM, Tesfaye F, Wall S, Becher H. Predicting
lung cancer death in Africa and Asia: differences with WHO estimates.
Cancer Causes Control (2009) 20:721-730.
7. Anh H, Thi P, Thi- Ngoc H, Thi -uyet N, Duc N, Thi Phuong D et al. Spectrum
of EGFR gene mutations in Vietnamese patients with non-small cell lung cancer. Asia-Pacific Journal of Clinical Oncology 2016; 12: 86–90
8. Van Beek E-JR, Mirsadraee S, Muchison JT. Lung cancer screening:
Computed tomography or chest radiographs? . World J Radiol 2015 August
28; 7(8): 189-193
9. Olsson, H. Tumörsjukdomar. Lund: Studentlitteratur; 1996.
10. Ericson E, Ericson T. Medicinska sjukdomar: patofysiologi, omvårdnad,
behandling. 4., rev. och utök. uppl. Lund: Studentlitteratur; 2012.
11. Kalender WA. Computed tomography: fundamentals, system technology,
image quality, applications. 3. ed. Erlangen: Publicis Corp. Publ.; 2011.
12. Tsapaki V, Rehani M. Dose management in CT facility. Biomed Imaging Interv J 2007; 3(2):e43.
13. Callahan MJ. CT dose reduction in practice. Pediatr Radiol (2011) 41 (Suppl 2):S488–S492.
15. Gomi S, Muramatsu Y, Tsukagoshi S, Suzuki M, Kakinuma R, Tsuchiya R et al. Low-dose CT screening for lung cancer with automatic exposure contral: phantom study. Radiol Phys Technol (2008) 1:244–250
16. European guidelines on quality criteria for computed tomography. Available at:
http://w3.tue.nl/fileadmin/sbd/Documenten/Leergang/BSM/European_Gui delines_Quality_Criteria_Computed_Tomography_Eur_16252.pdf
[Retrieved: 2015-04-07]
17. Vetenskapsrådet. Forskningsetiska principer. Available at: http://www.codex.vr.se/texts/HSFR.pdf[Retrieved: 2015-04-05]
18. Karthikeyan D. High resolution computed tomography of the lungs: a practical
guide. 2 uppl. London: Jaypee; 2013.
19. Xiaohua Z, Jianqun Y, Zheng H. Low-Dose Chest CT: Optimizing Radiation Protection for Patients. AJR: 183, September 2004.
20. Sulagaesuan C, Saksobhavivat N, Asavaphatiboon S, Kaewlai R. Reducing emergency CT radiation doses with simple techniques: A quality initiative project. Journal of Medical Imaging and Radiation Oncology 60 (2016) 23-24 21. Larson DB. Optimizing CT radiation dose based on patient size
and image quality: the size-specific dose estimate method. Pediatr Radiol (2014) 44 (Supply 3):S501–S505
22. Guang ML, Zhao Y, Long JZ, Schoepf JU. Dual-energy CT of the lung.
AJR:199, November 2012.
Appendix 1
Appendix 2
TEMPLATE FOR REVIEWING
Image _, ref mAs:__ Description
Please review the images by using European Guidelines. Follow each point from 1.1.1 until 1.2.11 and circle yes or no. Do this on each image!
Please dictate each image about your founding’s.
IMAGE CRITERIA ACCORDING TO EUROPEAN GUIDELINES (8).
1.1 Visualization of
1.1.1 Entire thoracic wall YES NO
1.1.2 Entire thoracic aorta and vena cava YES NO
1.1.3 Entire heart YES NO
1.1.4 Entire lung parenchyma YES NO
1.1.5 Vessels after intravenous contrast media YES NO
1.2 Critical reproduction
1.2.1 Visually sharp reproduction of the thoracic aorta YES NO 1.2.2 Visually sharp reproduction of the anterior YES NO mediastinal structures, including thymic residue (if present)
1.2.3 Visually sharp reproduction of the trachea and main bronchi YES NO 1.2.4 Visually sharp reproduction of the paratracheal tissue YES NO 1.2.5 Visually sharp reproduction of the carina and lymph node area YES NO 1.2.6 Visually sharp reproduction of the oesophagus YES NO 1.2.7 Visually sharp reproduction of the pleuromediastinal border YES NO 1.2.8 Visually sharp reproduction of large and medium sized YES NO pulmonary vessels
1.2.9 Visually sharp reproduction of segmental bronchi YES NO 1.2.10 Visually sharp reproduction of the lung parenchyma YES NO 1.2.11 Visually sharp reproduction of the border between the YES NO pleura and the thoracic wall
CRITERIA FOR RADIATION DOSE TO THE PATIENT
CTDIw : Routine chest: 30 mGy DLP : Routine chest: 650 mGy cm !
!
Thank you for your cooperation and for helping us in our project. We really appreciate that you are doing this for us.
Please contact us if there are any questions about this template!
Amanda Hammerö. Email: amandahammero@hotmail.com
Ellinore Morberg. Email: ellinoremorberg@hotmail.com