Mergers and acquisitions impact
on short-term performance for
acquiring firms
A study of the Nordic countries
MASTER THESIS WITHIN ECONOMICS THESIS WITHIN: Finance
NUMBER OF CREDITS: 30 ECTS
PROGRAMME OF STUDY: Civilekonomprogrammet AUTHOR: Lovisa Hallström
TUTOR:Michael Olsson JÖNKÖPING May 2019
ii
Acknowledgements
First of all, I would like to thank my supervisor Michael Olsson for challenging and supporting me during this semester, as well as encouraging me to focus on quality rather than the number of words. The thesis would not be the same without you. I would also like to express my gratitude for the students participating in my seminar group, contributing with valuable insights and encouraging words.
______________________ Lovisa Hallström
iii
Master Thesis in Economics
Title: Mergers and acquisitions impact on short-term performance for acquiring firms, a study of the Nordic countries
Author: Hallström Lovisa Tutor: Olsson Michael Date: 2019-05-20
Key terms: M&A (merger and acquisition), Nordic countries, abnormal return, short-term performance, finance, insurance and real estate industry.
Abstract
The international literature on M&As is extensive, but evidence from the Nordic countries is scarce. The primary focus of this study is to examine whether the short-term performance of Nordic bidders is affected by the announcement of M&As conducted within the finance, insurance and real estate industry. This study analyzes 173 deals conducted between 01-01-2000 and 12-31-2018. An event study was conducted to isolate the abnormal returns resulting from M&A announcements, followed by a multiple regression analysis. The multiple regression analysis was used to gain further knowledge about performance factors influencing cumulative abnormal return (𝐶𝐴𝑅), considering (1) payment method, (2) cross-border versus domestic deals, (3) market capitalization and (4) relative size. No evidence is found that the method of payment influences bidder abnormal return, whereas cross-border versus domestic transactions are found to influence Nordic countries differently. Market capitalization impact 𝐶𝐴𝑅 negatively, moreover relative size is found to impact 𝐶𝐴𝑅 positively in a majority of the cases.
iv
Table of Content
1. Introduction ... 1
2. Theory and Literature Review ... 4
2.1 Efficient Market Hypothesis ... 4
2.2 Motives for M&As ... 5
2.3 Previous Research on Stock Performance ... 6
2.3.1 Finance, Insurance and Real Estate Industry ... 6
2.3.2 Nordic M&As ... 7
2.3.3 Payment Method ... 8
2.3.4 Cross-border versus Domestic M&As ... 9
2.4 Market Capitalization ... 10
2.5 Relative Size ... 10
2.6 Hypotheses ... 11
3. Data and Methodology ... 12
3.1 Data ... 12
3.1.1 Deal Characteristics ... 13
3.2 Event Study Methodology ... 14
3.2.1 Event Window ... 15
3.2.2 Estimation Window ... 15
3.2.3 Normal Return ... 16
3.2.4 Abnormal Returns ... 17
3.2.5 Cumulative Abnormal Returns ... 18
3.2.6 Descriptive Statistics ... 18
3.2.7 Limitations of Event Studies ... 20
3.3 Regression Analysis ... 20
3.3.1 Assumptions of OLS ... 22
4. Result and Analysis ... 24
4.1 CAAR – Cumulative Average Abnormal Return ... 24
4.2 Regression ... 25
4.2.1 Finnish Bidders ... 25
4.2.2 Danish Bidders ... 25
4.2.3 Norwegian Bidders ... 26
4.2.4 Swedish Bidders ... 27
4.2.5 Robustness Test - Full Sample ... 29
4.3 Conclusion ... 30
5. Discussion and Suggestions for Future Studies ... 31
References ... 32
1
1. Introduction
Mergers and acquisitions (M&As) result in a change of ownership and control of resources. A merger results in mutual ownership of a new legal entity by the shareholders of former separate firms. There are three types of mergers: horizontal, vertical and conglomerate mergers. Horizontal mergers require that merging companies are in the same line of business, vertical mergers involve companies at different stages in the value chain and conglomerates refers to a merger of two unrelated businesses (Berk & DeMarzo, 2014). An acquisition on the other hand refer to the process of an acquiring firm getting access to a minimum of 50 percent of a targeted firm through a cash or stock payment (Piesse, Lee, Lin, & Kou, 2013). M&As are used as a method for growth or expansion of an organization (Teerikangas, Faulkner, & Joseph, 2012), and often serve as a strategic choice with the development of essential, core competence (Piesse et al., 2013). Further reasons for conducting acquisitions are the enhancement of geographical reach and a broadening product line (Walker, 2000). Hereafter the terms bidding and target firms are used, independent of whether the transaction is a merger or an acquisition. The occurrence of merger waves, periods of intense merger activity commonly followed by periods of very few deals, started in the late 1800s (Berk & DeMarzo, 2014). During each of the six merger waves the reason for engaging in M&A activities has been different, where creating monopolies were the main reason behind the first wave. This was followed by anti-trust regulation that consequently diminished monopoly power, leading to a second wave which increased vertical integration as a response to the enhanced regulation (Goergen & Renneboog, 2004). The most recent merger wave took place from 2003-2008, mainly resulting from private equity companies capitalizing on all-time low interest rates and inexpensive credits (McCarthy & Dolfsma, 2013).
Kiymaz and Baker (2008) argue that mergers tend to cluster both in time as well as in certain industries, such as the banking, real estate and hotel industries during 1990-1999. Furthermore, a majority of these industries were deregulated and M&A activity tends to increase after regulatory changes and during economic expansions (Berk & DeMarzo, 2014; Andrade, Mitchell, & Stafford, 2001). The integration of national markets towards a single European market was one of the major goals established at the Lisbon Summit,
2
encouraging cross-border activities and M&A activity in general (Campa & Hernando, 2004).
The findings of M&As impact on short-term performance and value creation for bidding firms is not uniform. Some argue that it results in minor, but positive short-term announcement effects (e.g. Eckbo & Thorburn, 2000; Goergen & Renneboog, 2004), where others argue that there are none or negative effects (e.g. Campa & Hernando, 2004; Kiymaz & Baker, 2008). However, that M&As generate positive effects for targets is supported by the vast majority of previous researchers (e.g. Campa & Hernando, 2004; Kiymaz & Baker, 2008; Rose, Sørheim, & Lerkerød, 2018; Goergen & Renneboog, 2004).
Previous studies show that the outcome of the bidding firm may vary on grounds such as geographical location, financial decisions made when conducting the deal or whether it is a domestic or cross-border transaction (Goergen & Renneboog, 2004). The financial decisions usually consist of the choice between cash or stocks, or a mix of both. Moreover, announcement returns can fluctuate due to size effects. More specifically, smaller firms tend to earn greater returns than larger firms (Moeller, Schlingemann, & Stulz, 2004), and the relative size, measured as deal value divided by the market capitalization of the bidding firm, generally has a positive relationship with abnormal returns (Fuller, Netter, & Stegemoller, 2002).
Furthermore, it is important to distinguish between different industries when talking about effects resulting from M&As, as industry classification heavily influences the outcome both for targets and bidding firms. In this study, industries are defined by the US SIC division structure. The Standard Industrial Classification (SIC) uses combinations of two to four digits to specify an industry, where the use of two digits serves as a general categorization whereas four digits lead to more niche industries (Rose et al., 2018). The finance, insurance and real estate industry, SIC (60-67), experience a lot of M&A activity (Kiymaz & Baker, 2008).
The number of M&As conducted within the Nordic countries, i.e. Sweden, Denmark, Finland, Norway and Iceland are growing. Even though the subject has been thoroughly investigated in many other regions, studies providing evidence of the Nordics are scarce (Rose et al., 2018).
3
Hence, it is interesting to investigate how stock prices behave in the finance, insurance and real estate industry within the Nordics. The aim is to answer the following research questions:
RQ 1: Is there a positive short-term effect resulting from M&A announcements in the Nordic countries within the finance, insurance and real estate industry for bidding firms 2000-2018?
RQ 2: Do short-term effects resulting from M&A announcements differ between the Nordic countries?
RQ 3: Does the payment method influence the short-term effect of the bidding firms stock performance?
RQ 4: Is there a difference in the short-term effects between domestic and cross-border deals within this geographical area and industry?
RQ 5: Do smaller firms enjoy a greater abnormal return than larger ones?
4
2. Theory and Literature Review
In the second chapter, underlying theories of M&As are presented together with a review of previous studies. The theory behind the efficient market hypothesis is presented along with motives for conducting M&As, previous research on stock performance, information regarding the finance, insurance and real estate industry as well as Nordic M&As. Thereafter, research conducted on the payment methods influence, domestic versus cross-border M&As and size effect are presented. In the end of chapter two, hypotheses based on the research questions and previous literature are presented.
2.1 Efficient Market Hypothesis
Price movements caused by firm events such as M&As, stock splits, earnings announcements and so on have been thoroughly investigated by economists and psychologists. Observations on stock fluctuations caused by such events bring the efficient market hypothesis (EMH) to light. EMH states that security prices fully reflect all available information on the market and is one of the cornerstones of financial economics (Fama, 1991; Poitras & Jovanovic, 2010).
In the study conducted by Fama (1970), three forms of EMH based on the nature of information are presented: weak-form, semi-strong-form and strong-form. Weak-form suggests that historical prices and past information are incorporated into the stock price. Semi-strong states that all publicly available information is reflected in the market price, whereas the strong-form states that stock price quickly reflects all privately and publicly available information. To conclude, investors should not be able to continuously realize an excess return.
The EMH has received strong criticism since the earlier contributions in the early 1960s, where suggestions for improvement and the reasoning behind the theory are questioned (Jovanovic, 2018). Fama (1991) argues that the clearest evidence of market efficiency comes from event studies on daily returns. Through event studies, information regarding the speed of adjustment of prices to information can be obtained, and the results of the research indicate that stock prices quickly adjust to information regarding dividend changes, investment decisions and changes in the capital structure.
5
2.2 Motives for M&As
Firms can have many reasons for engaging in M&As, where the reasons often are reflected by the time when the M&A is conducted (Kiymaz & Baker, 2008). In times of enhanced regulation or deregulation, new possibilities for firms might arise that benefits from a future merger. Harford (2005) investigates whether the underlying reasons for M&As are behavioral or neoclassical. Neoclassical reasons are based on a changing industry environment, where players in these industries try to take advantage of the changing environment and create synergies. The behavioral perspective on the other hand focuses on managerial hubris and self-serving management.
In the study conducted by Berkovitch & Narayanan (1993), the possibility of value-increasing and value-decreasing motives for M&As are explored. Value-value-increasing motives are usually connected with neoclassical reasons and value-decreasing motives are usually associated with the behavioral perspective. They argue that the three main motives for M&As are synergy, agency and hubris. Synergy refers to the possibility of two or more companies joining forces to increase competitiveness and cash flows, producing more than they could have independently (Sirower, 1997). In general, synergies can be classified as either operational or financial. The agency hypothesis suggests that M&As are conducted because they will benefit the acquiring management at the expense of their shareholders, whereas the hubris hypothesis states that managers make mistakes when evaluating targets and engage in acquisitions even when no synergy exists (Kiymaz & Baker, 2008).
Mueller and Sirower (2003) support the agency and hubris hypotheses but find weak or no evidence that M&As actually create synergies. In contrast, Berkovitch and Narayanan (1993) and Goergen and Renneboog (2004) find evidence that the synergy motive is dominant. Realized synergies resulting from M&As are further supported by Maquieira, Megginson and Nail (1998).
Synergies may generate further positive impacts such as an increased market share, increased geographical reach and a broader product line (Campa & Hernando, 2004; Walker, 2000). Moreover, operational synergies are synergies resulting in economies of scale or scope. Merged firms may realize economies of scale and scope through decreased
6
operation costs, such as the reduction in research, development and production costs (Campa & Hernando, 2004).
2.3 Previous Research on Stock Performance
When studying previous research regarding short-term wealth effects resulting from the announcement of M&As, one can draw the conclusion that results differ to a large extent. Perspectives that one may analyze are the bidding firms, the target firms or the combined outcome of the bidding and target firms. An empirical question of great importance concerning M&A research is whether the combined return of bidders and targets are positive or negative (Kiymaz & Baker, 2008).
When examining whether an event such as an M&A generates a return or not, the return of interest is the abnormal stock return. The abnormal stock return refers to the difference between the actual return and the expected return (Sorescu, Warren, & Ertekin, 2017). Kiymaz and Baker (2008) present evidence that targets enjoy significantly positive cumulative abnormal returns (𝐶𝐴𝑅: 𝑠) of 12.55 percent with an event window of (−1, 0), hence one day before the announcement until the end of the announcement day. The bidding firms on the other hand experience an average of significantly negative returns of -0.82 percent. Research conducted by Campa and Hernando (2004) points to significantly positive 𝐶𝐴𝑅:s for targets, whereas the 𝐶𝐴𝑅: 𝑠 for bidding firms were negative in 55 percent of the transactions. Several studies indicate that target firms tend to enjoy higher abnormal returns than bidding firms. Support for significantly positive returns for both bidding and target firms are found by Goergen and Renneboog (2004) for the (−1, 0) event window and is further supported by Eckbo and Thornburn (2000) and Loderer and Martin (1990).
2.3.1 Finance, Insurance and Real Estate Industry
Kiymaz and Baker (2008) state that it is important to distinguish between different industries when talking about effects resulting from M&As, as industry classification heavily influences the outcome for both target and bidding firms. The majority of M&As within the financial industry in Europe is accounted for by bank mergers, especially within the eurozone (Campa & Hernando, 2006).
7
Further, Kiymaz and Baker (2008) argue that bidder returns are positively related to being in a heavily regulated industry, like the finance industry. This is further strengthened by Campa and Hernando (2004) that find that mergers within the EU, both financial and non-financial, create larger value in regulated industries given that the merger is domestic. The results found by Kiymaz and Baker (2008) by examining the 𝐶𝐴𝑅: 𝑠 of the bidding firms varies within the financial industry. The result for financials (SIC 60-61) do not differ significantly from zero, depository/non-depository institutions (SIC 62-63) have significantly positive results and holding companies and other investment offices (SIC 67) have significant negative results.
Campa and Hernando (2006) study M&As in the financial industry within Europe and find that the returns to shareholders of the bidding firm do not differ significantly from zero around the announcement. Goergen and Renneboog (2004) report that bidders within the financial industry experience positive returns, although statistically insignificant.
2.3.2 Nordic M&As
There are some characteristics that make the Nordic countries differ slightly. Denmark, Sweden and Finland are part of the European Union (EU), while Norway and Iceland are members of the European economic area (EEA) agreement. All Nordic countries use their local currency with the exception of Finland who implemented the EU currency. Rose, et al. (2018) argue that the similarities between the Nordic countries will not breed locational advantages such as cheaper production facilities or labor. They further argue that clear differences between the Nordic countries such as languages, cultures and traditions can make the integration process more complex. Sometimes these differences hinder the transfer of knowledge and hence synergies also decrease.
Despite being a rather well-researched topic, there is little evidence from M&As in the Nordic countries, although Rose et al. (2018) attempt to fill the gap, and further states that the Nordic M&A market is growing.
Their study investigates value drivers for Nordic M&As and examines the hypothesis of “Bidder stock return zero upon announcement of acquisition”. The study applies different length of event windows and measures the result in relation to those. Small, negative and insignificant abnormal returns are found for the 21-day event window. Slightly positive, but insignificant abnormal returns are found with an 11-day event window and for a
three-8
day event window the abnormal return is 0.98 percent, meaning that it is significant on a ten percent level. Hence, they fail to reject the hypothesis. However, the results are overall insignificant and there is only weak evidence of value creation for shareholders of the bidding firm within the Nordic countries.
2.3.3 Payment Method
M&As can be executed with several different payment methods. Cash, stock or a mix of both are commonly used (Brown & Ryngaert, 1991). Evidence suggests that the method of payment strongly influences the outcome of M&As (Uddin & Boateng, 2009; Chang, 1998; Walker, 2000; Hazelkorn, Zenner, & Shivdasani, 2004). A number of researchers debate that acquisitions financed through cash create superior value compared to stock or other payment methods, while others argue the opposite.
Fuller and Glatzer (2003) conducted a study on returns for cross-border M&As and method of payment choice. They argue that deals conducted with cash rather than stock results in significantly higher returns than stock payments. Cash deals generate higher values for both target and targeted firms, regardless of whether they are private or public companies. That all-cash deals result in higher returns for acquiring firms is further strengthened by Goergen and Renneboog (2004), Yook (2003) and Travlos (1987). Yook (2003) argues that the payment method may send a message to the market. By using equity, a firm might lead the market to believe that their shares are overvalued. In accordance with Yook (2003), Fishman (1989) and Brown and Ryngaert (1991) argue that acquisitions financed by cash do lead to higher returns for bidders, as the payment method conveys information regarding bidder value to the market. They further debate that bidders only reason for offering stock would be if they had private information regarding overvaluation. Thus, by offering cash, asymmetric information may be mitigated.
Goergen and Renneboog (2004) on the other hand argues that the market reacts more positively towards bidders who use equity to conduct deals, which implies that financial decisions do not send signals to the market regarding over- or undervaluation of the acquirer’s equity.
As opposed to previously mentioned researchers, Fuller et al. (2002) argue that by engaging in stock offers, bidders receive higher returns when acquiring private firms.
9
Higher returns may originate from tax considerations and monitoring benefits, as target owners can delay their tax liability until the position is liquidated. In accordance with Fuller et al. (2002), Chang (1998) found evidence of superior performance for stock acquisitions conducted on privately held firms.
2.3.4 Cross-border versus Domestic M&As
Enhancing geographical coverage, lower labor costs and accelerated growth are reasons for conducting cross-border M&As (Hazelkorn et al., 2004; Dutta, Saadi, & Zhu, 2013). Hazelkorn et al. (2004) found evidence that cross-border operations are more successful than domestic ones, but they also come with cultural and integrational challenges (Dutta et al., 2013). On the one hand, the possibility to optimize tax systems and take advantage of favorable exchange rates as operations are moved into other countries are reasons encouraging cross-border transactions (Kang, 1993; Rose et al., 2018). On the other hand, when moving operations into a different geographical area, the bidding firm is exposed to a different legal system that includes different taxation and accounting regulations. These differences within the economic environment force domestic investors to analyze a new market (Rose et al., 2018).
Goergen and Renneboog (2004) argue that foreign direct investment (FDI) theories predict the possibility for foreign acquirers to benefit from factor and capital market imperfections, and hence cross-border operations should be superior according to theory. Kang (1993) further strengthens the reasoning that multinational firms should have a competitive advantage over domestic firms and that cross-border operations are likely to end with the highest benefits. However, Goergen and Renneboog’s (2004) findings suggest the opposite, that domestic mergers and acquisitions generate superior results compared to cross-border operations.
Eckbo and Thorburn (2000) study gains to bidding firms from a domestic and foreign point of view and concludes that domestic operations generate statistically significant positive returns, while cross-border transactions result in insignificant abnormal returns. Evidence is found that the combination of a domestic bid and payment with shares generates the greatest wealth effects and that similar total equity size of bidder and targets results in the most profitable acquisitions.
10
Rose et al. (2018) investigate value drivers in M&As in the Nordic countries. In agreement with Eckbo and Thorburn (2000), their research indicates that cross-border transactions result in lower announcement effects compared to domestic ones. However, their findings are not statistically significant. Moreover, Cybo-Ottone and Murgia (2000) argue that M&As of European banks do create value if they are domestic, whereas cross-border M&As result in negative abnormal returns.
2.4 Market Capitalization
The bidding firm’s size can be measured by its market capitalization, often included as a performance factor influencing announcement returns. In the study conducted by Moeller et al. (2004), evidence is found that smaller bidders enjoy announcement returns two percentage points higher than larger bidders, regardless of how the deal is financed. Furthermore, evidence suggests that the size effect is robust, it does not change over time. Eckbo and Thornburn’s (2000) findings support that smaller firms enjoy greater returns than larger ones.
2.5 Relative Size
The size of a deal might impact bidder returns for several reasons. At first glance, deal size conveys information about the target, whether it is large, small or similar to the bidder. The acquisition of larger firms can benefit bidding firms by an increase of managers power, a greater reputation and economies of scale and scope. Consequently, the acquiring of bigger targets might serve as a source for the creation of empires (Uddin & Boateng, 2009).
Fuller et al. (2002) investigate the relative size’s impact on the acquisition of both public and private firms, where evidence is found of a positive relationship between relative size and private targets. The evidence for public targets on the other hand is scattered, and highly dependent on payment method. A positive relationship is found for public targets acquired with cash, and a negative relationship for public targets acquired with stocks. Overall, the evidence points towards a positive relationship between relative size and bidder return.
Kiymaz and Baker (2008), as well as Fuller and Glatzer (2015), found evidence that bidder returns increase with the relative size of the target.
11
On the other hand, the acquisition of larger firms might increase the conflict in organizational cultures, making the acquisition of smaller firms more profitable. Oh, Peters and Johnston (2014) found that the acquisition of smaller targets generated higher returns than larger ones. They further argue that their findings support their claim that the acquisition of larger firms delays post-merger integration and therefore might lead to lower post-merger performance, compared to the acquisition of smaller targets.
2.6 Hypotheses
Based on the assumption of an efficient market, all new information, such as the announcement of M&As, is reflected in the stock price and in the market. A positive reaction following an M&A announcement indicates that the participants expect the firm to perform better after the deal, whereas a negative reaction signals that investors anticipate the deal to be value destroying. Characteristics such as payment method and geographical differences may influence abnormal returns. Previous M&A studies are scattered with both negative and positive reactions, which combined with the arguments on the motivations of M&As, would suggest that the bidding returns should be close to zero. Given previous literature and based on the research questions presented in the introduction, six hypotheses have been developed to gain further knowledge about relevant factors determining the outcome of Nordic M&As:
H1: The bidding firm will experience positive returns during the period surrounding the M&A announcement.
H2: The returns for bidding firms will not differ between the Nordic countries.
H3: The bidding firm will experience a greater announcement return when the M&A is financed with cash rather than by stock or a combination of both.
H4: Cross-border deals yield higher returns than domestic M&A transactions. H5: Smaller firms enjoy greater abnormal returns than larger firms.
12
3. Data and Methodology
In the third chapter, the data and method used in this study are presented. First, different aspects of the data are presented along with all steps included in the event study methodology, followed by a description of the regression analysis.
3.1 Data
The data concerning M&As analyzed in this study is gathered from the database Zephyr. Zephyr contains extensive information about rumored and completed M&A transactions, provided by the analytics company Bureau Van Dijk. Zephyr is updated hourly and allows you to sort data by numerous characteristics of interest, such as geography, time period, industry, deal status, etc. (Bureau Van Dijk, 2019). Reiter (2013) argues that Zephyr is a solid resource for M&A research that shows its reliability as well as consideration for transparency by including original sources for their information. Data regarding stock price was extracted from Thomson Reuter Datastream. Datastream is a global financial and macroeconomic data platform who provides comprehensive coverage of publicly listed international stocks (Eun, Lai, de Roon, & Zhang, 2010).
Characteristics of interest for this study are: (1) publicly-listed Nordic bidders; (2) deals within the finance, insurance and real estate industry (SIC 60-67); (3) deals paid with either cash, stock, or a mix of both; (4) bidding firms’ final stake in the targeted firm is at least 51 percent; (5) deals announced between 01/01/2000 and 31/12/2018 and (6) completed deals, hence the sample does not include any rumored deals. A 19-year time-span was chosen to ensure that sufficient data was collected and to cover both economic cycles as well as merger waves. Zephyr applied a different data collection method before 2000 (Reiter, 2013), therefore deals announced before 2000 are excluded to maintain consistency. There are 248 deals satisfying the mentioned criteria, moreover, several deals are excluded due to unavailable data and overlapping M&A activities, resulting in 173 deals. By ensuring the absence of overlapping event windows, the abnormal returns as well as the cumulative abnormal returns will be independent (MacKinlay, 1997). Iceland is excluded from the study since only two deals occurred over 19 years and therefore the sample is too small to draw any conclusions from.
13
3.1.1 Deal Characteristics
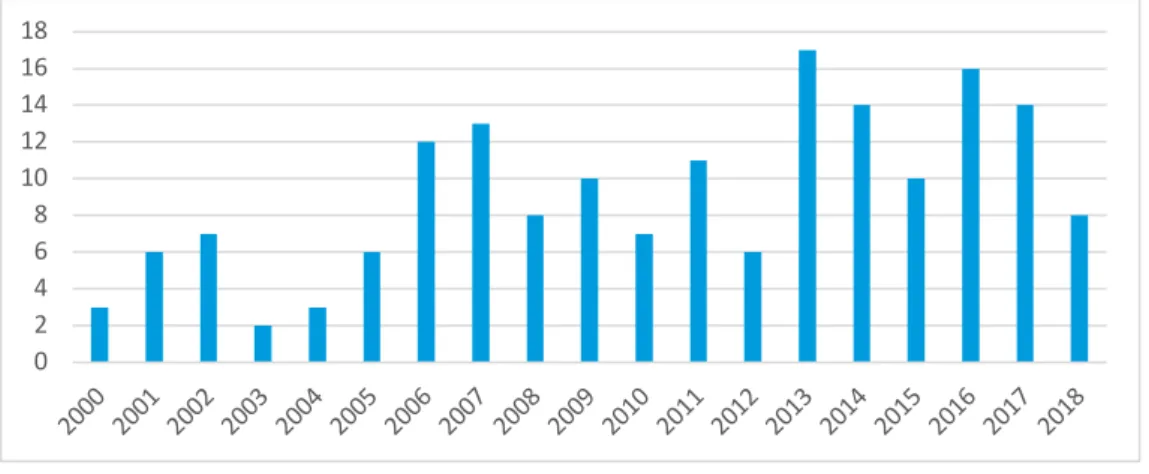
Figure 1 shows the distribution of M&A activity from 2000-2018. Spikes of M&A activity occur 2013, 2014, 2016 and 2017, while downward trends are seen 2000, 2003 and 2004. The last merger wave took place from 2003-2008, which comes with certain expectations of higher activity during that period. The merger activity within the finance, insurance and real estate industry does not seem to follow that pattern this time since higher activities are observed during later years in the sample. However, the decreasing trend following 2007 supports the theory behind merger waves and their cyclical pattern. Higher numbers observed in the later years of the sample may be supported by stronger economies, recovering after the financial crisis.
Figure 1: M&A Activity Over Time
Given the data in Table 1, showing deal characteristics, we can see that Swedish bidding firms completed 76 deals between 2000-2018, almost twice as many as bidding firms in Denmark completed under the same period, namely 39. Norwegian bidders conducted 31 deals and Finnish bidders 27. A greater number of deals conducted by Swedish bidding firms seems natural as the Swedish economy is larger than the other Nordic economies.
Table 1: Deal Characteristics
Finland Denmark Norway Sweden Total
Cash 6 11 16 24 57 Stock/ Mixed 21 28 15 52 116 Total 27 39 31 76 173 Cross-border 3 7 13 29 52 Domestic 24 32 18 47 121 Total 27 39 31 76 173 0 2 4 6 8 10 12 14 16 18 2000 2001 2002 2003 2004 2005 2006 2007 2008 2009 2010 2011 2012 2013 2014 2015 2016 2017 2018
14
Studying the full sample of all Nordic countries, deals financed with cash are roughly as common as cross-border transactions, they occur 33 and 30 percent of the time. The distribution of payment method varies between the countries, however, deals financed by shares or a mixed payment is used in a majority of the deals within the Nordic area. In Finland, a majority of the deals are conducted in shares or mixed payment, 78 percent, while 22 percent are conducted in cash. Denmark shows a similar trend where 28 percent of the deals are financed with cash and 72 percent with shares or mixed payment. The only country in which a majority of the deals are conducted in cash is Norway. Bidding firms situated in Sweden conducted 32 percent of their deals in cash, and 68 percent in stocks or mixed payment.
In Denmark and Finland, a majority of M&A activity is conducted domestically. Finnish bidders conduct domestic deals most frequently, namely 89 percent of the time. In Denmark, 82 percent of the deals are conducted domestically, while Swedish and Norwegian bidders conduct domestic deals 62 and 58 percent of the time, respectively. In broad terms, this allocation of domestic versus cross-border deals is similar to the findings of both Goergen and Renneboog (2004) as well as Rose et al. (2018), who find that 71 percent of the deals in their sample of Nordic M&As are conducted domestically. By studying all performance factors in Table 1, we can see that Denmark and Finland share similar trends, often with a majority of one characteristic. Norwegian bidders on the other hand have a more even allocation of the performance factors, and Swedish bidders are somewhere in between.
3.2 Event Study Methodology
Fama (1991) states that event studies are an essential part of finance, and further that the majority of what we know about corporate finance originates from event studies. As the purpose of this study is to see whether short-term performance is affected by the announcement of M&As, an event study will be conducted.
An event study refers to the act of observing stock price movements around corporate events, such as the announcement of M&As. The purpose of an event study is to evaluate if there are abnormal stock returns present as a result of corporate events. As a foundation for an event study, there are assumptions of market efficiency, which further assumes that
15
all publicly available information is reflected by stock prices and that stock prices will change immediately when new information is available (Sorescu et al., 2017).
According to MacKinlay (1997), the first step in conducting an event study is to define the event, followed by defining an event window, which is the period of time when the event took place. It is common to make the event window larger than the specific period of interest, as this allows for an analysis of periods surrounding the event. The following step is to decide which criteria firms need to satisfy in order to be included in the study. After deciding said criteria’s, the normal and abnormal returns are calculated. The timeline of an event study is presented in Figure 2.
3.2.1 Event Window
In this study, the event is defined as the announcement of M&As. Andrade et al. (2001) argue in agreement with Tuch and O'Sullivan (2007) that short event windows provide the most reliable evidence regarding M&A transactions, as they are associated with less methodological problems. Previous literature suggests that to ensure that the actual abnormal returns are always captured, the window must cover deals that were announced after the market is closed, and hence the event window must cover a minimum of the announcement day and the day after.
An event window is typically expressed as (−𝑥, +𝑦), where 𝑥 is the number of days prior to the announcement day and 𝑦 is the number of days after. The announcement day is commonly expressed as “day 0” (Konchitchki & Oleary, 2011).
Konchitchki and Oleary (2011) recommend the use of the (−1, +1) window and suggest the use of an additional window to support the main one. Therefore, two windows will be used, (−1, +1) is used as the main window and (−2, +2) as a supporting window. The chosen event windows allow for a minor misplacement of the announcement day since the windows will capture the returns of the previous and following days (MacKinlay, 1997).
3.2.2 Estimation Window
The time during which information is gathered to estimate the normal return is called the estimation window. Estimation windows are normally set between 200 and 250 days prior
16
to the (−1, +1) event window (Bartholdy, Olson, & Peare, 2007; Goergen & Renneboog, 2004).
The event period is often excluded from the estimation period to minimize the influence on normal returns, and therefore the estimation window is set to (−210, −20) (MacKinlay, 1997). A 20-day time interval is removed to avoid the inclusion of any information connected to the event in the approximation of normal returns. Supposing there are roughly 22 trading days per month, the normal performance is measured for nine months, which should be enough time to determine the normal performance.
Figure 2: Timeline of an Event Study – The Estimation and Event Windows
3.2.3 Normal Return
There exists a large number of models for estimating normal returns, where two commonly used models are the constant mean return model and the market model (MacKinlay, 1997). The market model relates the return of a stock to the return of the market portfolio and is considered to detect abnormal returns more accurately, due to its possibility to remove some of the returns incorporated in the market returns. Hence, only abnormal returns associated with the announcement of M&As will be highlighted. The market model is thereby chosen for this study as MacKinlay (1997) suggests that it comes with potential improvements over the simple constant mean return model. Further, the market model assumes a normal distribution.
The natural logarithm is used in the calculation of the daily return for the stock prices and market indexes, equation (1). Calculating the return with the natural logarithm of the price is argued to come with certain advantages, such as improvement of the normality of the return distribution (Hendersson, 1990).
𝑡12 𝑡13 𝑡4 𝑡53 𝑡52
𝑡124
𝑡1234
17
𝑅6 = ln 𝑃6
𝑃613 (1)
where:
𝑅6 = the return on day 𝑡,
𝑙𝑛 = the natural logarithm, 𝑃6 = stock price on day 𝑡, 𝑃613 = stock price on day 𝑡 − 1.
In order to estimate each country’s market returns four indexes are used; MSCI Sweden, MSCI Denmark, MSCI Norway and MSCI Finland. Bloomberg and Financial Times are regular users of the MSCI Nordic indexes, supporting the choice of indexes.
The following formula shows the estimation of the normal return of the security 𝑖 on day 𝑡 according to the market model:
𝑅𝑖𝑡 = 𝛼𝑖+ 𝛽𝑖𝑅𝑚𝑡+ 𝜀𝑖𝑡, (2)
𝐸(𝜀D6) = 0; 𝑣𝑎𝑟 (𝜀D6) = 𝜎JD2,
where:
𝑅D6 = actual return of security 𝑖 at time 𝑡, 𝑅K6= return of the market, MSCI, at time 𝑡, 𝛼D = alpha for security 𝑖,
𝛽D= beta of security 𝑖,
𝜎JD2 = sample variance of the market model,
𝜀D6= the zero mean disturbance term.
The normal or expected return can also be written as: 𝐸(𝑅D6) = 𝛼D + 𝛽D𝑅K6 +𝜀𝑖𝑡.
3.2.4 Abnormal Returns
After computing the normal returns, they are compared with the returns observed within the event window. Abnormal return (𝐴𝑅) is the difference between the return observed
18
in the event window and the estimated normal return calculated in the estimation window (MacKinlay, 1997). Moreover, this is the unanticipated return that derives from the M&A. Having the expected return, we are able to calculate the 𝐴𝑅 for any given stock at time period t. Equation (3) shows the calculation of the 𝐴𝑅 of the security 𝑖 on day 𝑡.
𝐴𝑅D6 = 𝑅D6− 𝐸(𝑅D6) (3)
3.2.5 Cumulative Abnormal Returns
In order to draw conclusions about the event analyzed, the 𝐴𝑅: 𝑠 must be aggregated since tests with one event are not likely to be useful (MacKinlay, 1997). By summing the abnormal returns per firm for each event window we receive the 𝐶𝐴𝑅.
𝐶𝐴𝑅D(6M,6N)= O 𝐴𝑅D6
6N
6P6M
(4)
Haleblian and Finkelstein (1999) argue that using 𝐶𝐴𝑅 as a measure of performance comes with certain advantages over other performance measures if certain assumptions are upheld. The underlying assumption of 𝐶𝐴𝑅 as a measure of M&A performance is based on market efficiency. By using 𝐶𝐴𝑅: 𝑠, both market performance and firms market risk (beta) are considered in the performance measure.
3.2.6 Descriptive Statistics
In Tables 2-5 payment method is presented as “PM”, cross-border versus domestic deals as “CBD”, market capitalization as “Mcap” and relative size as “Rsize”. Tables 2-5 displays the descriptive statistics for each individual country. The mean represents the average 𝐶𝐴𝑅, and by studying the tables we can see that it is positive for all countries, for both event windows. The standard deviation shows the dispersion from the mean, which is higher for all countries in the (−2, +2) event window. Moreover, the maximum and minimum values show the highest and lowest values observed in the sample. The higher standard deviation in (−2, +2) may be connected to longer time period as well as the more extreme values generally observed in that event window.
Finnish bidders experience rather similar results in both event windows. The lowest relative size ratio and the largest bidder among the countries are observed in Table 2.
19
Danish bidders are on average the smallest in size, moreover, their relative size ratio is the highest. Norwegian bidders are on average remarkably larger in size than their Nordic peers. The relative size ratio is the second highest of the Nordic countries. The highest maximum and minimum values are observed in Table 5 for Swedish bidders, where the maximum value for (−2, +2) nearly reaches 100 percent. Descriptive statistics for the full sample is found in Table A1 in the appendix.
Table 2: Descriptive Statistics Finnish Bidders
CAR (-1, +1) CAR (-2, +2) PM CBD Mcap Rsize Observations 27 27 27 27 27 27
Mean 0.0221 0.0317 0.2222 0.8889 2 018 471 0.7306 St. Dev 0.0548 0.0612 0.4237 0.3203 6 353 313 0.1196 Maximum 0.2507 0.2247 1.0000 1.0000 29 443 150 1.0028 Minimum -0.0346 -0.0750 0.0000 0.0000 14 993 0.4582
Table 3: Descriptive Statistics Danish Bidders
CAR (-1, +1) CAR (-2, +2) PM CBD Mcap Rsize Observations 39 39 39 39 39 39
Mean 0.0392 0.0502 0.2821 0.8205 1 661 283 0.8804 St. Dev 0.0852 0.1101 0.4559 0.3888 4 108 397 0.1243 Maximum 0.2779 0.3990 1.0000 1.0000 15 471 239 1.1139 Minimum -0.0645 -0.0620 0.0000 0.0000 4 599 0.6809
Table 4: Descriptive Statistics Norwegian Bidders
CAR (-1, +1) CAR (-2, +2) PM CBD Mcap Rsize Observations 31 31 31 31 31 31
Mean 0.0155 0.0230 0.5161 0.5806 5 217 922 0.8027 St. Dev 0.0760 0.0855 0.5080 0.5016 8 574 942 0.1425 Maximum 0.3680 0.4212 1.0000 1.0000 22 275 583 1.0640 Minimum -0.0981 -0.0869 0.0000 0.0000 15 911 0.4829
Table 5: Descriptive Statistics Swedish Bidders
CAR (-1, +1) CAR (-2, +2) PM CBD Mcap Rsize Observations 76 76 76 76 76 76
Mean 0.0381 0.0394 0.3158 0.6184 2 820 362 0.7605 St. Dev 0.0926 0.1443 0.4679 0.4890 5 586 775 0.1358 Maximum 0.5357 0.9988 1.0000 1.0000 21 829 090 1.0618 Minimum -0.1089 -0.2177 0.0000 0.0000 1 654 0.4283
20
3.2.7 Limitations of Event Studies
The outcome of an event study can be altered by biasedness. Daily closing prices for all stocks included in the study are commonly used to estimate returns, with the underlying assumption that the prices are registered during the same time on a daily basis. However, the closing prices are registered during the last transaction of the day, which in return fluctuates depending on day and trading volume, possibly resulting in further issues. A low trading volume means that new information not necessarily is incorporated as clear in the stock price as it would have been with a higher trading volume. This assumption that closing prices are set the same time daily leads to estimation errors in the market model (MacKinlay, 1997).
Further assumptions of an event study are market efficiency and unexpected announcements of upcoming events. The event window should also be limited to the announcement of one event as other important information can influence the abnormal return. By using a small sample, issues regarding the normality distribution could influence the study. The statistical tests used to ensure the significance of the results assume a normal distribution, which is required for the tests to be trustworthy (McWilliams & Siegel, 1997).
Even though certain estimation errors appear using the market model, the advantages are considered higher than the disadvantages. To prevent overlapping event windows and the associated issues, several overlapping announcements have been excluded from this study. Furthermore, the use of short event windows makes it easier to control for overlapping announcements. In order to make sure that each individual sample is large enough, Iceland is excluded from the study since only two events occurred during the 19-year timespan.
3.3 Regression Analysis
In order to investigate how different factors influence stock performance during the announcement of M&As, a multiple regression analysis is conducted. A multiple regression allows the investigation of the relationship between the dependent and independent variables. A separate regression is performed for each country, however, the function looks the same for all countries, seen in (5) and (6).
21
The dependent variables in (5) and (6) are identified as the cumulative abnormal return calculated during the event windows. More specifically, the two event windows and dependent variables are (−1, +1) and (−2, +2).
The intercept, or 𝛼, is the mean of the dependent variable 𝐶𝐴𝑅 if all independent variables are zero.
Moreover, four independent variables are used in (5) and (6). First, a dummy variable indicating which payment method is used, where 1 means that the deal was conducted with cash and 0 indicating a share or mixed payment. The payment methods impact on the dependent variable is estimated by 𝛽3. H3, “The bidding firm will experience a greater announcement return when the M&A is financed with cash rather than by stock or a combination of both”, indicates that 𝛽3 is expected to be positive. When using dummy variables, one needs to be careful to avoid perfect collinearity. Perfect collinearity, or dummy traps, are avoided by using one less dummy variable than categories included in the regression (Gujarati & Porter, 2009). Since two payment methods are included in the regression, only one dummy is needed to represent the combination of the two methods. Second, a dummy variable showing whether the deal was conducted domestically, or cross-border is used. 1 indicates that the deal is domestic and 0 is used for the cross-border deals, 𝛽2 estimates the impact on the dependent variable. H4, ”Cross-border deals yield higher returns than domestic M&A transactions”, yields expectations of a negative 𝛽2. The market capitalization of the bidding firm converted into its natural logarithm, is the third independent variable, measured by 𝛽T. H5, “Smaller firms enjoy greater abnormal returns than larger firms”, yields expectations of a negative 𝛽T.
The fourth independent variable represents the relative size of the firm, expressed as the ratio of the deal value divided by the pre-deal market capitalization of the acquirer. The relative size’s impact is measured by 𝛽U. H6, “There is a positive relationship between
relative size and abnormal return”, yields expectations of a positive 𝛽U. Lastly, 𝜀D is the residual term of this regression model.
𝐶𝐴𝑅 (−1, +1) = 𝛼 + 𝛽3𝑃𝑀 + 𝛽2𝐶𝐵𝐷 + 𝛽T𝑀𝐶𝑎𝑝 + 𝛽U𝑅𝑆 + 𝜀D (5) 𝐶𝐴𝑅 (−2, +2) = 𝛼 + 𝛽3𝑃𝑀 + 𝛽2𝐶𝐵𝐷 + 𝛽T𝑀𝐶𝑎𝑝 + 𝛽U𝑅𝑆 + 𝜀D (6)
22
An additional regression model of the entire sample was included to test the model’s robustness and validate the results, seen in (7) and (8). The fifth, sixth and seventh independent variables are dummy variables representing which country the bidding firm is situated in. In Table 6 the combination representing the different countries can be seen:
Table 6: Country Dummy Variable Combinations
Country Combination (D,N,S) Finland 0,0,0
Denmark 1,0,0 Norway 0,1,0 Sweden 0,0,1
𝛽], 𝛽^ and 𝛽_ estimate the impact on the dependent variable. Based on H2, “The returns for bidding firms will not differ between the Nordic countries”, 𝛽], 𝛽^ and 𝛽_ are not
expected to diverge significantly from each other.
𝐶𝐴𝑅(−1, +1) = 𝛼 + 𝛽3𝑃𝑀 + 𝛽2𝐶𝐵𝐷 + 𝛽T𝑀𝐶𝑎𝑝 + 𝛽U𝑅𝑆 + 𝛽]𝐷 + 𝛽^𝑁 + 𝛽_𝑆 + 𝜀D (7) 𝐶𝐴𝑅(−2, +2) = 𝛼 + 𝛽3𝑃𝑀 + 𝛽2𝐶𝐵𝐷 + 𝛽T𝑀𝐶𝑎𝑝 + 𝛽U𝑅𝑆 + 𝛽]𝐷 + 𝛽^𝑁 + 𝛽_𝑆 + 𝜀D (8)
3.3.1 Assumptions of OLS
There are several assumptions underlying the method of ordinary least squares (OLS), such as the absence of multicollinearity, autocorrelation and heteroscedasticity (Gujarati & Porter, 2009).
Multicollinearity refers to a perfect relationship between some or all of the independent variables in a regression, which might cause distorted results. The variance-inflating factor (VIF) is an indicator of multicollinearity, which by a rule of thumb is said to be troublesome if VIF exceeds a value of ten (Gujarati & Porter, 2009). Furthermore, in
order for regression results to be trustworthy, the correlations should stay within a [−0.8; 0.8] interval, as too high correlation between variables might distort the results
(Brooks, 2008).
The presence of autocorrelation in a model indicates that the error terms are correlated, which can lead to insignificant estimators, even though they are in fact, significant
23
(Gujarati & Porter, 2009). In order to test for autocorrelation in this study, the frequently used Durbin-Watson d test is applied. As a rule of thumb, a value of 1.5-2.5 indicates that no autocorrelation, positive or negative, is present in the model.
A non-constant error variance indicates heteroscedasticity in a model. If heteroscedasticity is present, then t-tests based on the variance might be misleading, consequently leading to wrongful conclusions. Heteroscedasticity can be detected by graphical methods or different tests (Gujarati & Porter, 2009), in this study the Breusch-Pagan test is applied.
24
4. Result and Analysis
The fourth chapter presents the empirical results together with an analysis and conclusion of the findings in this study. First, 𝐶𝐴𝐴𝑅 is presented, followed by the regression results for each individual country and for the full sample. Lastly, a conclusion based on all findings is given.
4.1 CAAR – Cumulative Average Abnormal Return
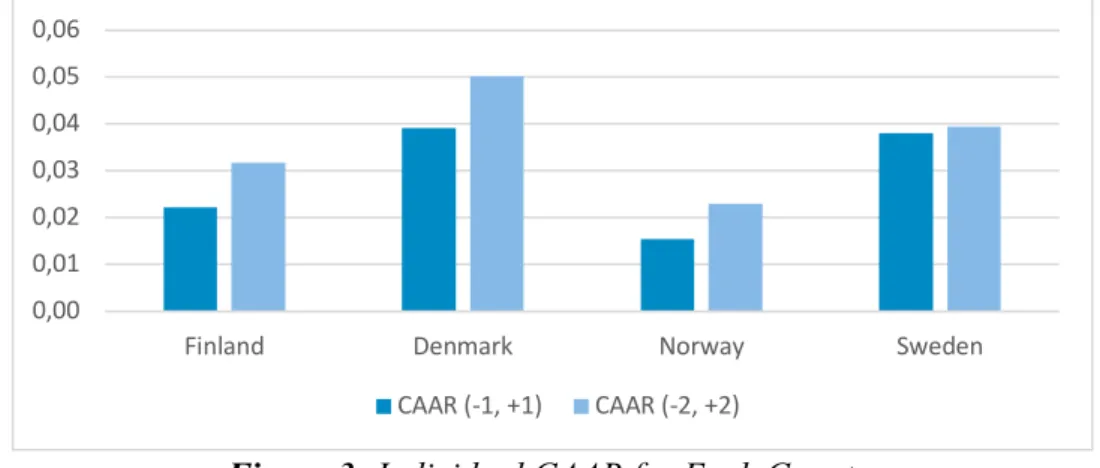
By studying the mean 𝐶𝐴𝑅, or 𝐶𝐴𝐴𝑅 in Figure 3, clear differences between the Nordic countries are observed, however, all countries have a higher 𝐶𝐴𝐴𝑅 in the (−2, +2) event window. Danish bidders enjoy the highest average return for both event windows, reaching five percent in (−2, +2). The lowest average returns are realized by Norwegian bidders for both event windows. Swedish bidders enjoy the most even average return over the two event windows, where the average return during (−2, +2) is slightly higher.
Figure 3: Individual CAAR for Each Country
The longest event window (−2, +2) has the highest 𝐶𝐴𝐴𝑅 for the full sample. This is seen in Figure 4 where the average cumulative abnormal returns are 3.18 and 3.77 percent.
Figure 4: CAAR Full Sample
0,00 0,01 0,02 0,03 0,04 0,05 0,06
Finland Denmark Norway Sweden
CAAR (-1, +1) CAAR (-2, +2) 0,00 0,01 0,02 0,03 0,04 CAAR (-1, +1) CAAR (-2, +2)
25
4.2 Regression
In order to test the performance factors impact on Nordic bidder return in times surrounding the announcement of M&As, the sample was divided into four subgroups, one for each country. First, a regression model showing Finnish bidder return is presented, followed by Danish, Norwegian and Swedish bidders. Following each individual country’s regression model is an additional regression of the full sample.
4.2.1 Finnish Bidders
There are 27 M&As observed in the Finnish regression model, presented in Table 7. The positive cross-border versus domestic coefficients for Finnish and Swedish bidders are in line with the findings of Rose et al. (2018), that cross-border transactions result in lower announcement effects compared to domestic ones. However, their findings, just as the Swedish and Finnish samples, are not statistically significant.
Table 7: Regression Results Finland
CAR (-1, +1) CAR (-2, +2) 𝛽 t 𝛽 t Intercept -0.109 -0.646 -0.240 -1.305 Payment Method -0.002 -0.056 -0.004 -0.128 Cross-border vs Domestic 0.045 0.946 0.068 1.330 Market Capitalization 0.014 0.839 0.024 1.362 Relative Size 0.025 0.213 0.112 0.877
*** = significance at the 1 percent level, ** = significance at the 5 percent level, * = significance at the 10 percent level
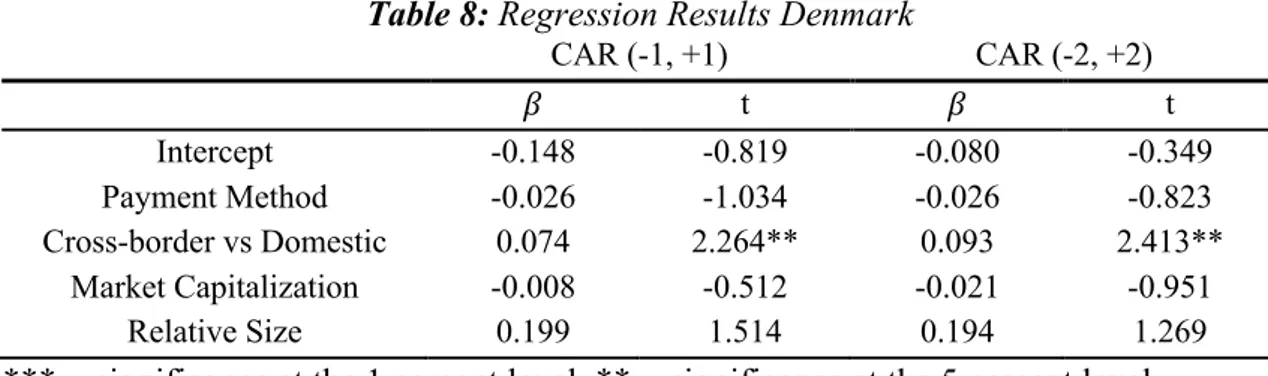
4.2.2 Danish Bidders
There are 39 observations included in the regression model showing M&A transactions performed by Danish bidders, presented in Table 8. Cross-border versus domestic deals is the only significant variable, which is positive and significant at a 5 percent level. In the main event window (−1, +1), the results indicate that domestic deals generate a positive return of 7.4 percent for the bidding firm. In the supporting event window (−2, +2) an even higher return of 9.3 percent for domestic bidders is observed. Said results lead to a rejection of H4, for Danish bidders domestic M&As generate a higher return than cross-border M&As. This evidence is consistent with the findings of Goergen and Renneboog (2004), who’s theories predict an advantage for firms conducting
cross-26
border activities, however, their findings conclude that domestic transactions generate the highest returns.
Table 8: Regression Results Denmark
CAR (-1, +1) CAR (-2, +2) 𝛽 t 𝛽 t Intercept -0.148 -0.819 -0.080 -0.349 Payment Method -0.026 -1.034 -0.026 -0.823 Cross-border vs Domestic 0.074 2.264** 0.093 2.413** Market Capitalization -0.008 -0.512 -0.021 -0.951 Relative Size 0.199 1.514 0.194 1.269
*** = significance at the 1 percent level, ** = significance at the 5 percent level, * = significance at the 10 percent level
4.2.3 Norwegian Bidders
There are 31 M&As conducted by Norwegian bidders included in the sample, presented in Table 9, with a majority of the variables being significant in both event windows. For the main event window (−1, +1) the intercept is significant at a 1 percent level, indicating that Norwegian bidders enjoy a positive return of 45.3 percent if all independent variables are zero. The intercept for the supporting event window shows similar results, the coefficient is significant at a 5 percent level and generates a positive return of 45.2 percent, all else equal to zero. The positive returns found for the Norwegian sample support H1. Moreover, Norwegian bidders enjoy the highest returns of the Nordic countries during the announcement period.
Cross-border versus domestic deals have a negative coefficient significant at a 5 and 10 percent level, for (−1, +1) and (−2, +2), respectively. This essentially means that Norwegian bidders benefit by engaging in cross-border deals, in line with H4 and the results of Hazelkorn et al. (2004). The finding that cross-border deals create superior value suggests that synergies and other benefits from engaging in overseas transactions breeds strategic values.
Market capitalization showed a significant negative coefficient for the main event window. The consequence of this finding is that larger bidding firms generate lower returns than smaller ones, in accordance with H5 and most prior literature. The findings of Moeller et al. (2004) are very similar to the Norwegian bidders in this study, they find
27
that smaller firms enjoy two percentage points higher returns than larger bidders. Moreover, market capitalization is found negative in four out of five regression models, supporting H5. Moeller et al. (2004) mean that the size effect is robust, smaller firms have earned greater returns than larger firms in the past, and they will continue to do so in the future.
Relative size is negative and statistically significant for both event windows, implying that a larger relative size had a negative impact on Norwegian bidders’ performance. This is in line with the findings of Oh et al. (2014), who means that integration challenges have a strong, negative impact on performance.
H3 and H4 presents the belief of a higher return when deals are financed with cash on a cross-border basis. Norwegian bidders finance their deals with cash most frequently of the countries included in the study, moreover, they also perform cross-border M&As to the greatest extent. The result of the Norwegian sample is in accordance with the findings of Fuller and Glatzer (2003), cross-border M&As financed with cash yield the highest returns. The combination of these characteristics might be the reason for the higher returns observed for the Norwegian sample.
Table 9: Regression Results Norway
CAR (-1, +1) CAR (-2, +2) 𝛽 t 𝛽 t Intercept 0.453 2.905*** 0.452 2.407** Payment Method -0.053 -1.514 -0.046 -1.105 Cross-border vs Domestic -0.073 -2.487** -0.072 -2.036* Market Capitalization -0.031 -1.874* -0.029 -1.445 Relative Size -0.232 -2.121** -0.242 -1.841*
*** = significance at the 1 percent level, ** = significance at the 5 percent level, * = significance at the 10 percent level
4.2.4 Swedish Bidders
There are 76 observations included in the regression for Swedish bidders. For the main event window, there are two statistically significant variables, the intercept and the relative size. The intercept is significant at a 10 percent level and indicates a negative return of 17.3 percent for Swedish bidders if all independent variables are equal to zero. The result in Table 10 leads to a rejection of H1, Swedish bidders do not experience a
28
positive return resulting from the announcement of M&As. A negative trend for Swedish bidders might suggest that Swedish management suffer from hubris or engage in transactions benefitting the management rather than the shareholders, in accordance with the agency hypothesis.
Relative size on the other hand is positive and significant at a 1 and 5 percent level for the (−1, +1) and (−2, +2) event windows, respectively, showing how a larger relative size has a positive impact for Swedish bidders, supporting H6. The positive relationship might indicate that Swedish bidders enjoy economies of scale and scope as well as a greater reputation when acquiring larger firms. Moreover, positive relationships are found by Kiymaz and Baker (2008) as well as Fuller and Glatzer (2015). The coefficient representing payment method for bidders in Finland, Denmark and Norway are negative, indicating lower returns for bidders financing deals with cash. On the other hand, the coefficient for Swedish bidders is positive and therefore supporting H3, “The bidding firm will experience a greater announcement return when the M&A is financed with cash rather than by stock or a combination of both”. However, the payment method is not statistically significant at any level for any of the countries, hence no empirical evidence for the payment methods impact on short-term performance is found. That the financial decision has a big impact on the outcome of M&As is argued by several studies (e.g. Uddin & Boateng, 2009; Chang, 1998; Walker, 2000; Hazelkorn et al. 2004), which makes it surprising that it shows no impact whatsoever in this study. In the study by Rose et al. (2008), the payment method used by Nordic bidders is not found significant either, suggestively due to weak signaling effects. Consequently, bidders in the Nordic countries have more flexibility with regards to payment method as negative market reactions resulting from financing does not have to be considered.
Table 10: Regression Results Sweden
CAR (-1, +1) CAR (-2, +2) 𝛽 t 𝛽 t Intercept -0.173 -1.943* -0.156 -1.190 Payment Method 0.019 1.031 0.037 1.321 Cross-border vs Domestic 0.025 1.387 0.026 1.070 Market Capitalization -0.008 -0.791 -0.022 -0.781 Relative Size 0.306 3.067*** 0.383 2.469**
*** = significance at the 1 percent level, ** = significance at the 5 percent level, * = significance at the 10 percent level
29
4.2.5 Robustness Test - Full Sample
A regression of the full sample was used to test the model’s robustness. Moreover, the full sample regression also serves as an additional source of insight in the search of M&A value drivers.
Most coefficients in Table 11 are not significant at any significance level, with the exception of relative size for both event windows. Relative size is found positive and significant, as it was in the Swedish sample, further strengthening the support for a positive relationship between 𝐶𝐴𝑅 and the acquisition of larger firms. The country dummies are all insignificant, suggesting that there is no difference between the return for bidders in the Nordic countries.
When examining the results of the full sample, only one variable is found significant. However, when testing the countries separately, the payment method is the only variable that is found insignificant in all regression models.
Table 11: Regression Results Full Sample
CAR (-1, +1) CAR (-2, +2) 𝛽 t 𝛽 t Intercept -0.051 -0.574 -0.026 -0.238 Payment Method -0.005 -0.420 0.004 0.208 Cross-border vs Domestic 0.017 1.020 0.023 1.041 Market Capitalization -0.009 -1.141 -0.017 -1.092 Relative Size 0.151 2.174** 0.182 2.071** Denmark -0.012 -0.310 -0.017 -0.564 Norway -0.011 -0.259 -0.012 -0.377 Sweden 0.015 0.794 0.008 0.305
*** = significance at the 1 percent level, ** = significance at the 5 percent level, * = significance at the 10 percent level
When controlling for VIF and correlation, no signs of multicollinearity is present in the models, see Table A2-A7 in the appendix. All VIF values range between acceptable values of 1.103-2.251, which in combination with the values in the correlation matrix, kept within the [-0.8;0.8] interval, indicates that multicollinearity does not exist in the models. Moreover, by studying Durbin-Watson statistics in Table A8, no signs of autocorrelation are present in the models.
30
By studying the Breusch-Pagan test in Table A9 we can see that heteroscedasticity is present in the full, Danish and Swedish samples for at least one of the independent variables. To remedy these violations, robust standard errors are used which according to Hoechle (2007) remedies both heteroscedasticity and autocorrelation.
4.3 Conclusion
Insight on which factors influence the short-term announcement effect of M&As, and how they influence it, might be crucial information for bidders considering engaging in M&A activities and how to pursue them. Based on the findings in this study, it cannot be established with certainty that Nordic bidders within the finance, insurance and real estate industry enjoy positive short-term announcement returns. Once again, results are scattered, pointing towards positive returns for bidders in some countries, while others experience negative returns. The country dummies in the full sample regression are all insignificant, suggesting that there is no difference between the return for bidders in the Nordic countries. Consequently, H1 cannot be proved for the full sample and the findings support H2.
The payment method is not found significant for any sample, which leads to a rejection of H3. The consequence of such findings leads to an increased flexibility with regards to the choice of payment method for Nordic bidders, as it is not found to have a significant impact on announcement returns.
Domestic deals benefit some bidders, while cross-border transactions generate a greater return for others. Firm size, measured by market capitalization is found to have a negative significant impact, supporting H5. Relative size is proven to have a significant impact on performance, generally a positive one, in accordance with H6.
31
5. Discussion and Suggestions for Future Studies
One of the major goals established at the Lisbon Summit was the integration of national markets towards a single European market, serving as a prerequisite for the EU to achieve its desired world leadership. To achieve such an objective, the corporate ownership and structures of the member states should strive towards the economic structure of an integrated Europe. Today, the countries in Europe typically have relatively small firms with their activity heavily concentrated within their national borders, particularly compared to the United States. Knowledge about M&As, especially cross-border transactions, how they most efficiently can be constructed and awareness of how they benefit society is an essential source of information contributing to the goal set at the Lisbon Summit and society in general.
Increased deregulation of economic sectors in Europe has decreased the costs associated with corporate acquisitions and transactions, consequently encouraging and simplifying the integration of the European corporate sector. Even after deregulation and increased integration within Europe, there are still a number of economic, cultural and legal obstacles hindering the success of cross-border activity.
This study created a deeper interest in M&As and brought new research questions to life. Future studies conducted on M&A activities in the Nordic countries could match different performance factors, in order to see how they affect each other. Which combination of performance factors yields the highest returns for Nordic bidders? Fuller et al. (2002) find that the acquisition of public targets is highly dependent on the payment method. Are there possibly different combinations of deal characteristics more suitable for certain countries? Furthermore, an increase of sample size should be considered to see if it increases significance.
32
References
Andrade, G., Mitchell, M., & Stafford, E. (2001). New Evidence and Perspectives on Mergers. Journal of Economic Perspectives, 15(2), pp. 103-120.
Bartholdy, J., Olson, D., & Peare, P. (2007). Conducting Event Studies on a Small Stock Exchange. The European Journal of Finance, 13(3), pp. 227-252. Berk, J., & DeMarzo, P. (2014). Corporate finance. 3. ed. Global ed. Harlow: Pearson
Education Limited.
Berkovitch, E., & Narayanan, M. (1993). Motives for Takeovers: An Empirical Investigation. Journal of Financial and Quantitative Analysis, 28 (3), pp. 347- 362.
Brooks, C. (2008). Introductory Econometrics for Finance. 2. ed. Cambridge: Cambridge University press.
Brown, D., & Ryngaert, M. (1991). The Mode of Acquisition in Takeovers: Taxes and Asymmetric Information. Journal of Finance, 46(2), pp. 653-669.
Bureau Van Dijk. (2019). Zephyr.
Campa, J., & Hernando, I. (2004). Shareholder Value Creation in European M&As.
European Financial Management, 10(1), pp. 47-81.
Campa, J., & Hernando, I. (2006). M&As performance in the European financial industry. Journal of Banking and Finance, 30(12), pp. 3367-3392.
Chang, S. (1998). Takeovers of Privately Held Targets, Methods of Payment, and Bidder Returns. Journal of Finance, 53(2), pp. 773-784.
Cybo-Ottone, A., & Murgia, M. (2000). Mergers and shareholder wealth in European banking. Journal of Banking and Finance, 24(6), pp. 831-859.
Dutta, S., Saadi, S., & Zhu, P. (2013). Does payment method matter in cross-border acquisitions? International Review of Economics and Finance, 25, pp. 91-107. Eckbo, B., & Thorburn, K. (2000). Gains to Bidder Firms Revisited: Domestic and
Foreign Acquisitions in Canada. Journal of Financial and Quantitative Analysis,
35(1), pp. 1-25.
Eun, S., Lai, S., de Roon, F., & Zhang, Z. (2010). International Diversification with Factor Funds. Management Science, 56(9), pp. 1500-1518.
Fama, E. (1970). Efficient capital markets: a review of theory and empirical work.