Information Sharing In Independent Dyadic
Business Relationships:
- A Case Study of Four Focal Companies in the Clothes Manufacturing Industry
of Imbaba and Warrak, Great Cairo, Egypt.
Andreas Edestav
Johanna Linder
BACHELOR THESIS 2008
INDUSTRIAL ENGINEERING AND MANAGEMENT
SCHOOL OF ENGINEERING
Information Sharing In Independent Dyadic
Business Relationships:
- A Case Study of Four Focal Companies in the Clothes Manufacturing Industry
of Imbaba and Warrak, Great Cairo, Egypt.
Andreas Edestav
Johanna Linder
This thesis is carried out at the School of Engineering, Jönköping University, and is a part of a Bachelor of Science in Industrial Engineering and Management. The authors are liable for presented opinions, conclusions and findings.
Supervisor: Jörgen Dernroth
Paper extent: 15 hp (C-level)
Date:
Number:
SCHOOL OF ENGINEERING
Abstract
3
Abstract
Purpose - The purpose of the thesis is to record the content of the information shared by buyer to supplier in independent dyadic business relationships in the clothes manufacturing industry of Imbaba and Warrak, Great Cairo, Egypt. The objective is as well to describe how this sharing is managed in terms of communication frequency, order cycle time and information technology used.
Methodology – A case study was performed on four companies in the clothes manufacturing industry of Imbaba and Warrak, Egypt. The empirical data was collected through six semi-structured interviews. The results were thereafter analyzed through a summarized framework.
Findings - The content of shared information is mainly of traditional character, nevertheless do 50 % of the relationships as well include elements of additional soft information. When the information sharing is performed through regular communication do the frequency vary with an average of 0.43, once every 2.3 days. The order cycle times vary from delivery the same day as order placement to three days after order placement, with an average of 0.5 days. The information is shared through two different information technologies: face-to-face and telephone.
Research implications – Imbaba and Warrak are considered one of the poorest districts in the Great Cairo region. The region has although seen great development the last 12-15 years and is today a main district for the industry of clothes manufacturing in Cairo. The role of information sharing yet appears to be poorly examined.
Originality/value - Making the situation evident to the case companies will impact on their possibilities to make further improvements within the area of information sharing.
Key words Information sharing, dependence, independence, dyad, content, frequency, order cycle time, information technologies.
Acknowledgement
Acknowledgement
Special thanks to:
Said Sadaan Maximous Attia - for your undying generosity
Thanks to:
Nazer Zakari, Romani Kamel
and
SIDA, The Swedish International Development Cooperation Agency, and its scholarship for “Minor Field Study”
Table of Content 5
Table of Content
Abstract ... 3
Acknowledgement ... 4
1
Introduction ... 7
1.1 BACKGROUND ... 71.1.1 Imbaba and Warrak ... 7
1.1.2 Case Companies ... 7
1.1.3 Theoretical Background ... 8
1.2 PURPOSE AND GOAL ... 9
1.3 DELIMITATIONS ... 9
1.4 THESIS OVERVIEW ...10
2
Theoretical Framework ... 11
2.1.1 Level of Dependence ...11
2.1.2 Content and Managing of Information Sharing...12
3
Methodology ... 14
3.1 RESEARCH STRATEGY ...14 3.2 RESEARCH APPROACH ...15 3.3 QUALITY OF RESEARCH ...16 3.3.1 Validity ...16 3.3.2 Reliability ...164
Empirical Study ... 17
4.1 SUMMARY OF INTERVIEWS ...17 4.2 FINDINGS ...18 4.3 ANALYSIS ...19 4.3.1 Level of dependence ...194.3.2 Content and Managing of Shared Information ...20
5
Conclusions and Discussion ... 23
5.1 CONCLUSIONS ...23 5.2 DISCUSSION ...23
6
References ... 25
6.1 BOOKS ...25 6.2 ARTICLES ...25 6.3 INTERNET ...267
Appendix ... 28
7.1 APPENDIX 1:INTERVIEW QUESTIONS ...29
7.2 APPENDIX 2:INTERVIEW ANSWERS ...30
Focal Company one: Stevano Factory, trousers ...30
Focal Company two: Stevano Factory, shirts ...32
Focal Company three: Kaukab el Sobeh ...33
Focal Company four: El Batel ...35
7.3 APPENDIX 3:ORDER CYCLE TIME SCORE ...38
Figures and Tables
Figures
1
Introduction ... 7
FIGURE 1 THESIS OVERVIEW………...10
2
Theoretical Framework ... 11
FIGURE 2 FRAMEWORK, LEVEL OF DEPENDENCE (HILL, 2000) ………..12
3
Methodology ... 14
4
Empirical study ... 17
FIGURE 3 CONTENT OF INFORMATION SHARING……….……… 18
FIGURE 4 FREQUENCY……….………..18
FIGURE 5 ORDER CYCLETIME……….………...19
Tables
1
Introduction ... 7
2
Theoretical Framework ... 11
3
Methodology ... 14
TABLE 1 TABLE OF INTERVIEWS………15
4
Empirical study ... 17
TABLE 2 SUMMARY OF INTERVIEWS….………..17
TABLE 3 INFORMATION TECHNOLOGY………19
TABLE 4 FREQUENCY SCORE, REGULAR COMMUNICATION………..…22
Introduction
7
1 Introduction
This chapter will give a background to the thesis and describe the purpose and goal. Furthermore it will explain which delimitations are made as well as give a general overview of the report.
1.1 Background
The thesis is carried out at the School of Engineering, Jönköping University, and is the final fragment of a Bachelor of Science in Industrial Engineering and Management. The thesis is as well conducted as a “Minor Field Study” accompanied by a scholarship from the Swedish International Development Cooperation Agency, SIDA. Besides this, the thesis is made in collaboration with four case companies in the clothes manufacturing industry of Imbaba and Warrak, Great Cairo, Egypt.
1.1.1 Imbaba and Warrak
Imbaba and Warrak are two closely united areas in the governorate of Giza on the west bank of the Nile. Together they are considered one of the poorest districts in the Great Cairo region and inhabit somewhere between one and three million people (S. Sadaan Maximous Attia, 2008 pers. comm., 25 May).
In 1994 Chris Hedges described Imbaba in The New York Times as “…one million people crammed into tottering mud-walled buildings and narrow dirt alleys…” The area has seen great development the last 12-15 years and is today a main district for the industry of clothes manufacturing in Cairo (S. Sadaan Maximous Attia, 2008 pers. comm., 25 May). The industry is today the unquestionably largest provider of jobs in the district, which also relates well to the numerous amounts of low- and uneducated people.
1.1.2 Case Companies
Stevano Factory, trousers is a manufacturer of trousers located in Imbaba. It was established in 1996. Total sales are about 100 000 pieces annually. The factory employs 40 – 50 workers. The production is based on ten different models of trousers. Stevano Factory, shirts, is the other of the two factories included in the company Stevano Factory. This factory was established in 2002 and employs 25 workers. Its annual sales are between 130 000 and 140 000 pieces. The production contains a big variety of shirts for men and children.
Kaukab el Sobeh was established in 1993 and is a manufacturer of abeya, clothing for women, located in Warrak. The company’s sales are about 18 000 pieces annually. The factory employs 14 workers. The production is partly automated and is based on five different models of abeya.
Introduction
El Batel is a manufacturer of abeya, clothing for women. The company was established in 2005 in Warrak. The factory employs six people. The annual sales are 18 000 pieces divided on 20 models.
1.1.3 Theoretical Background
Slack and Lewis (2002) determine that no operation can be seen as existing in isolation. All operations are part off an interconnected network. Further on is the idea of buyer-supplier relationship described as the heart of the supply network concept and also the heart of all business. In other words, no operation or organization can survive solely on its own. Business is based on dyadic relationships of buyer-supplier character.
To achieve better integration in the global marketplace many firms have established strong relationships with their supply chain members (Wu, W-Y., Chiag, Wu, Y-J. & Tu, 2004). To achieve this Goodman and Dion (2001) describe three categories of factors that are most influential, including:
- Supply chain management commitment,
- Marketing determinants of supply chain management, and - Behavioural determinants of supply chain management.
Additionally, Mohr and Spekman (1996) define communication as the “Key to vitality” in a partnership and Goodman and Dion (2001) continue their paper with describing the behavioural determinants of supply chain management as,
- Continuity, - Communication, - Power, and - Trust
In their construction of a model for channel communication Mohr and Nevin (1990) explore four aspects of communication. These are: (a) frequency - as an indicator of the amount of communication, (b) direction - to explain the movement of the communication, vertically and/or horizontally, (c) modality - to identify the information technology and (d) content of shared information. Tayi and Srinidhi (2006) furthermore argue that the design and management of information sharing between organizations plays one of the most important roles in improving both inter and intra organizational productivity.
Cox, Ireland, Lonsdale, Sanderson and Watson (2002) declare that the society in general, together with individual customers, is the major beneficiary from a relationship where no actor has power over the other, a relationship of independent character. Additionally, Andersson, Håkansson and Johanson (1994) acknowledge the business dyad as the, most often, considered best approach for studying relationships between firms. In this manner the authors decide to focus on the information shared from buyer to supplier in independent dyadic buyer-supplier relationships.
Introduction
9
1.2 Purpose and Goal
The purpose of the thesis is to record the content of the information shared by buyer to supplier in independent dyadic business relationships in the clothes manufacturing industry of Imbaba and Warrak, Great Cairo, Egypt. The objective is as well to describe how this sharing is managed in terms of communication frequency, order cycle time and information technology used.
Furthermore the purpose is to make the situation evident to the case companies with the optimism of creating possibilities for further improvements in their management of information sharing.
The goal is to (a) record the content of the information shared by four manufacturing companies to their suppliers respectively. The goal is furthermore to (b) describe how this information sharing is managed considering communication frequency, order cycle time and information technology.
1.3 Delimitations
- To verify the level of dependence no other variables than share of purchase and sale together with the environment nature described by Cox et al. (2002) will be considered.
- No other relationships than those of independent character will be further reflected.
- The quality of the shared information will not be evaluated.
- The authors will not consider the information sharing on strategic and tactical level.
- To examine the managing of information technologies no other variables than methods used will be considered.
Introduction
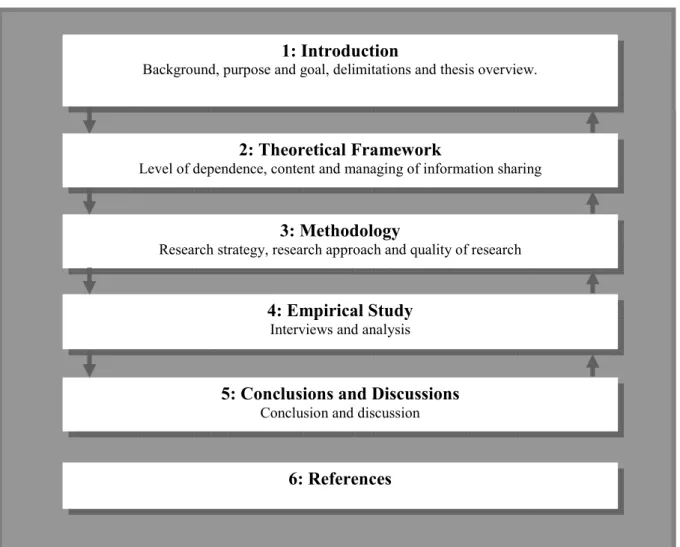
1.4 Thesis Overview
Figure 1 Thesis overview
Figure 1 is a general overview of the thesis; it explains the content for each chapter respectively. The first chapter accordingly comprise the background of research district, case companies and theory. Furthermore it includes the purpose and goal, delimitations and this actual thesis overview.
The theoretical framework is placed in the second chapter, which includes a framework of the level of dependence as well as of the content and managing of information sharing. The third chapter explains how the research methodology is chosen and approached. The quality of the research is as well discussed here.
The fourth chapter will show the findings from each interview respectively and altogether. The findings from the interviews are later analyzed in the same chapter. The conclusions made from the findings are presented in the fifth chapter together with an evaluating discussion. Chapter six is a list of references.
1: Introduction
Background, purpose and goal, delimitations and thesis overview.
2: Theoretical Framework
Level of dependence, content and managing of information sharing
3: Methodology
Research strategy, research approach and quality of research
4: Empirical Study
Interviews and analysis
5: Conclusions and Discussions
Conclusion and discussion
Theoretical Framework
11
2 Theoretical Framework
This chapter presents the theoretical framework. The level of dependence, content of shared information, communication frequency, order cycle time and information technologies are included.
2.1.1 Level of Dependence
Håkansson and Snehota (1995) explain that dependence derives from the fact that there is a link between companies. Moreover, does Emerson (1962) define dependence as “the extent to which a trade partner provides important and critical resources for which there are few alternative sources of supply”. Cox et al. (2002, p. 26) additionally determine that “a power relationship exists if actor A desires outcome x and actor B desires outcome y, and if A can achieve its preferred outcome against the explicit and direct opposition of B”.
Together with the understanding of the importance of the buyer’s cost of search, Cox
et al. (2002), explain the role of buyer scarcity and supplier scarcity in a dyadic
relationship and their importance for determining the level of dependence. They continue by explaining that linking these three variables together will lead to a possible creation of different categories for dyadic exchange. Cox et al. (2002) continue describing the resource scarcity as the relative possibility to imitate or substitute a resource.
Hill (2000) ascertain that the level of a buyer’s total purchase that is from a certain supplier, in relation to the level of the same supplier’s total sales that goes to the same buyer, decides the level of dependence of the relationship. Interestingly it is agreed that dependence properly can be structured into a framework of four groups (Cox et
al., 2002; Hill, 2000), namely,
- Supplier is dominant,
- Buyer and supplier are mutually dependent,
- Buyer and supplier are independent of one another, and - Buyer is dominant.
Theoretical Framework
Although, Cox et al. (2002) further conclude that the four levels of dependence are not unchangeable, but can also be subdivided to eight categories, which are,
- Buyer-supplier independence
- Buyer dominance with transparent supply-side contestation - Opportunistic supplier dominance with many potential suppliers - Buyer dominance with opaque supply-side contestation
- Transparent supplier dominance - Buyer-supplier interdependence - Opaque supplier dominance
- Opportunistic supplier dominance with few potential suppliers
Cox et al. (2002) further explain that buyer-supplier independence commonly arises from an environment of certain nature. That is, (a) a highly competitive supply market where the supplier offers his products to a fragmented buyer market (Cox et al., 2002). (b) A market where suppliers offering products to a customer base that is fragmented but well informed about the supply market offerings. And (c) when scarcity of supply market and demand is low.
2.1.2 Content and Managing of Information Sharing
Cachon and Fisher (2000) describe the content of information sharing in two groups, namely;
§ Traditional information sharing, where only the orders are shared between buyer and suppliers.
§ Full information sharing, where the supplier has immediate access to the buyer’s inventory data.
0
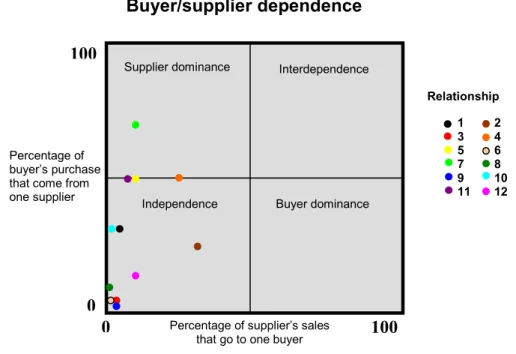
0 100
100
Percentage of buyer’s purchase that come from one supplier
Percentage of supplier’s sales that go to one buyer
Supplier
dominance Interdependence
Independence Buyer dominance
Buyer/supplier dependence
Theoretical Framework
13
Håkansson (1982) differently divide the information shared in a business relationship into (a) basic technical and/or commercial information and (b) “soft” data e.g. the use of the product, conditions of agreement and general information about the transacting players. Mintzberg (1973) further defines the “soft” data as the unsolicited and privileged information that is not asked for and that is frequently external to the company and exchanged during face-to-face encounters.
In the late 1980s Lengel and Daft (1988) illustrate the term of media “richness”. They describe that the “richness” of the media is defined from its ability to (a) handle multiple information cues simultaneously (b) make rapid feedback easy and (c) establish a personal focus. Additionally they explain that face-to-face communication followed by telephone communication are the “richest” media and that the kind of message should decide the information technology and consequently the media “richness”. Leek, Turnbull and Naude (2003) further include fax, the Internet, e-mail, intranets, extranets and audio- and video-conferencing as information technologies. Lengel and Daft (1988) later explain that there is a risk of communication failure when a routine message is communicated through a “rich” media.
Mohr and Nevin (1990) explain that regular communication is an exchange of information that occurs in frequent intervals. A high frequency of these intervals will, in a business network, later lead to relationship stability (Burkink, 2002). Further on, is a company’s satisfaction explained to be positively related to the communication frequency (Wagner & Bukó, 2005). Mohr and Sohi (1995) further explain that a communication frequency score could be created to correlate the values found in an organization context. This score is defined through calculating the deviation of the average frequency values.
The order cycle time is the time elapsed from an order placement until the order is received and accepted by the buyer (McLaughlin, Perosio & Park, 1998; Francis, 2008). Furthermore do Strader T.J., Strader, F.L. and Shaw (1999) demonstrate that order cycle times shortens through sharing of supply and demand information.
Methodology
3 Methodology
This chapter explains how the research methodology is chosen and approached. It further includes a discussion of the quality of the research.
3.1 Research Strategy
Patel and Davidson (1994) explain that a research can be of three types, (a) exploratory - used when there is a knowledge gap within the research area. (b) Descriptive - used when the researchers start with a theoretical framework or construct a framework that describes how the problem will be approached. (c) Hypothesis testing - used when the knowledge within the research area is plentiful. A descriptive strategy was chosen since the research was established through a theoretical framework. Patel and Davidson (1994) further explain that a descriptive research describes a delimited group of aspects existing in previous or existing conditions, which is also the case in this study.
Furthermore, do Patel and Davidson (1994) distinct between quantitative and qualitative research and explain that this feature is decided from the way the collected information is worked on and analyzed. A quantitative research works with statistical information, but a qualitative works with verbal methods of analysis. It is also explained that research might, and is commonly, conducted somewhere in between these two distinct extremes. In this research is information many times of statistical character, but even though collected through qualitative methods since there is an enormous lack of statistic material in the examined business environment.
According to Patel and Davidson (1994) should the data collection method be decided from the research problem and be in congruence with the choice of organizations and techniques. In this research the method was chosen to be a case study including the information sharing process in four manufacturing companies. The generalizability of this information is decided from the choice of case companies, where a random choice motivates generalization (Patel & Davidson, 1994). Interview was chosen as the technique for data collection.
Merriam (1998) describe three different types of interviews used to collect information, namely
• Highly structured interview,
- Oral survey with predetermined questions. Does not allow any free conversation.
• Semi-structured interview,
- Conducted with flexibility. Predetermined framework, allows explanations within the topic.
• Unstructured interview,
- Essentially exploratory, the interviewers focus on gaining experience within the topic.
Methodology
15
3.2 Research Approach
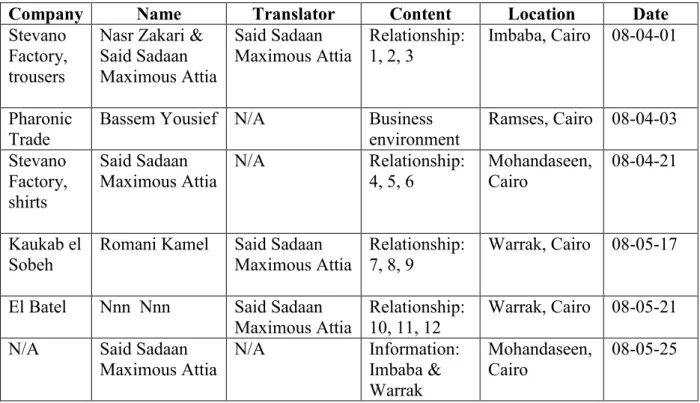
To conduct this case study according to used methodology literature (Patel & Davidson, 1994; Merriam, 1998) the process was started through a general literature overview of the topics included, namely; supply chain networks, dependence in business relationships, information sharing, knowledge sharing, information management and knowledge management. This was made through both primary- and secondary sources. In accordance to the research problem the authors later focused on the aspects of (a) level of dependence, (b) content of shared information, (c) communication frequency, (d) order cycle time and (e) information technologies used. The case study thereafter continued by looking at four manufacturing companies. The choice of these companies was made principally random and according to the purpose of looking at the clothes manufacturing industry of Imbaba and Warrak, Great Cairo, Egypt. The choice was, although, as well made in collaboration with Said Sadaan Maximous Attia, Stevano Factory, to (a) find companies that were willing to interact and (b) get assistance in achieving a general insight into the studied market. The three suppliers on each company were chosen randomly, but yet arranged by the manufacturing companies themselves. The empirical data was collected through six interviews, showed in Table 1, and conducted with the companies respectively. Interviews were as well made to collect information describing the local business environment.
Company Name Translator Content Location Date
Stevano Factory, trousers
Nasr Zakari & Said Sadaan Maximous Attia Said Sadaan Maximous Attia Relationship: 1, 2, 3 Imbaba, Cairo 08-04-01 Pharonic Trade
Bassem Yousief N/A Business environment Ramses, Cairo 08-04-03 Stevano Factory, shirts Said Sadaan Maximous Attia N/A Relationship: 4, 5, 6 Mohandaseen, Cairo 08-04-21 Kaukab el Sobeh
Romani Kamel Said Sadaan Maximous Attia
Relationship: 7, 8, 9
Warrak, Cairo 08-05-17
El Batel Nnn Nnn Said Sadaan Maximous Attia
Relationship: 10, 11, 12
Warrak, Cairo 08-05-21 N/A Said Sadaan
Maximous Attia N/A Information: Imbaba & Warrak Mohandaseen, Cairo 08-05-25
Table 1 Table of interviews
The data from the interviews was later on analyzed. The level of dependence was decided through analysis of levels of purchase and sale, but also through the environment nature. The content of shared information was recorded and categorized as either, traditional or as including additional “soft” data. The communication
Methodology
frequency was analyzed through a score calculated from the average frequency values. In the same way was the order cycle time data approached. The information technology was recorded and related to the media “richness”. Furthermore the authors searched to find similarities and differences between the four aspects included in the second part of the goal.
3.3 Quality of Research
3.3.1 Validity
Validity concerns the relevance of the report, the bearing of goal and purpose and its connection between theories, framework used, results and analyses (Merriam, 1998). The choices of case companies and suppliers are made randomly, but yet in assistance with a local supervisor. There might, through this, be a possible uncertainty in generalizing these findings. The findings should not be applied on other manufacturing industries or differently located markets.
3.3.2 Reliability
The reliability relates to how credible the information in the study is (Merriam, 1998). The choices made throughout the study, in terms of continually recurring delimitations, are based on earlier research, including, particularly primary-, but also secondary sources. In the same way is the theoretical background and framework created.
The outcome of the framework by Hill (2000) is analyzed together with the findings from observations made according to Cox et al. (2002) on the characteristics of environments where independent relationships appear.
The choice of semi-structured interview to collect the empirical data was made according to literature on research methodology and the interview questions were shaped according to the theoretical framework and consequently towards purpose and goal. The interviews were as well made in good conditions of translation and open conversations. A traditional pilot-interview could unfortunately not be conducted depending on lack of contacts in the actual industry. Needed experience could, nevertheless, be conducted through the first interview.
Empirical Study
17
4 Empirical Study
This chapter will present a summary of the answers found from the interviews. It will as well contain findings and analysis found from this information.
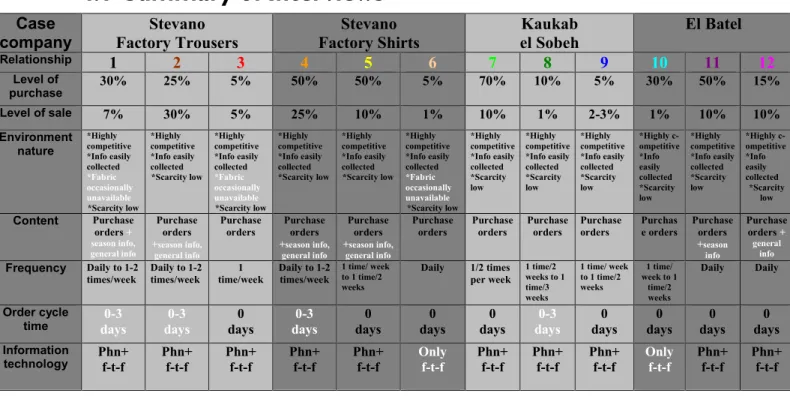
4.1 Summary of Interviews
Case company Stevano Factory Trousers Stevano Factory Shirts Kaukab el Sobeh El Batel Relationship 1 2 3 4 5 6 7 8 9 10 11 12 Level of purchase 30% 25% 5% 50% 50% 5% 70% 10% 5% 30% 50% 15% Level of sale 7% 30% 5% 25% 10% 1% 10% 1% 2-3% 1% 10% 10% Environment nature *Highly competitive *Info easily collected *Fabric occasionally unavailable *Scarcity low *Highly competitive *Info easily collected *Scarcity low *Highly competitive *Info easily collected *Fabric occasionally unavailable *Scarcity low *Highly competitive *Info easily collected *Scarcity low *Highly competitive *Info easily collected *Scarcity low *Highly competitive *Info easily collected *Fabric occasionally unavailable *Scarcity low *Highly competitive *Info easily collected *Scarcity low *Highly competitive *Info easily collected *Scarcity low *Highly competitive *Info easily collected *Scarcity low *Highly c- ompetitive *Info easily collected *Scarcity low *Highly competitive *Info easily collected *Scarcity low *Highly c-ompetitive *Info easily collected *Scarcity low Content Purchase orders + season info, general info Purchase orders +season info, general info Purchase orders Purchase orders +season info, general info Purchase orders +season info, general info Purchase orders Purchase orders Purchase orders Purchase orders Purchas e orders Purchase orders +season info Purchase orders + general info Frequency Daily to 1-2 times/week Daily to 1-2 times/week 1 time/week Daily to 1-2 times/week 1 time/ week to 1 time/2 weeks Daily 1/2 times per week 1 time/2 weeks to 1 time/3 weeks 1 time/ week to 1 time/2 weeks 1 time/ week to 1 time/2 weeks Daily Daily Order cycletime days 0-3 days 0-3 days 0 days 0-3 days 0 days 0 days 0 days 0-3 days 0 days 0 days 0 days 0 Information
technology Phn+ f-t-f Phn+ f-t-f Phn+ f-t-f Phn+ f-t-f Phn+ f-t-f Only f-t-f Phn+ f-t-f Phn+ f-t-f Phn+ f-t-f Only f-t-f Phn+ f-t-f Phn+ f-t-f
Table 2 Summary of interviews
Empirical Study
4.2 Findings
Figure 3 Content of information sharing
The content of shared information is of three types, (a) purchase orders, (b)
information about season changes and (c) general market information. These different content types are devided on the case companies, according to Figure 4. Hence, purchase orders are shared in all relationships. Information about season changes as well as general market informatioin are shared in five out of twelve relationships.
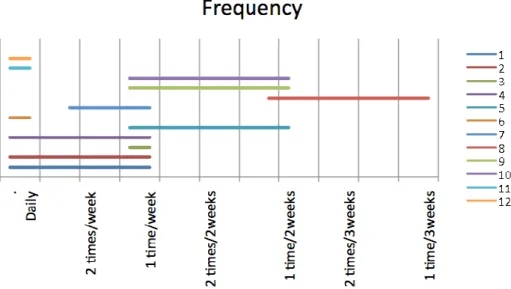
Figure 4 Frequency
The communication frequency differs abundantly, ranging from daily contact up to once every three weeks. It also varies within each relationship.
Empirical Study
19
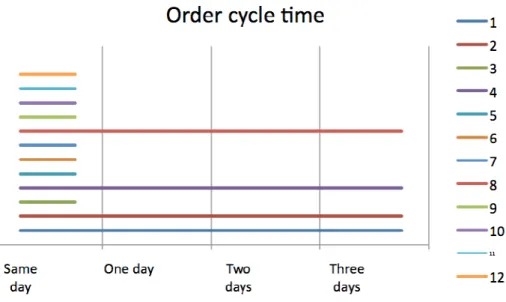
Figure 5 Order cycle time
The time from order placement to received order is in eight relationships constantly less than 24 hours. The additionally four relationships have an order cycle time that varies up to a maximum of three days.
Case company Stevano Factory Trousers Stevano Factory Shirts Kaukab el Sobeh El Batel Relationship 1 2 3 4 5 6 7 8 9 10 11 12
Telephone Yes Yes Yes Yes Yes No Yes Yes Yes No Yes Yes
Face-to-face Yes Yes Yes Yes Yes Yes Yes Yes Yes Yes Yes Yes
Table 3 Information technology
All relationships use face-to-face communication to share this information. Ten relationships as well use telephone communication. No other technologies are used.
4.3 Analysis
4.3.1 Level of dependence
According to the framework by Hill (2000) are 11 out of 12 relationships positioned in the “independent” fraction of the framework. Relationship seven would at the time for the interview be positioned in the “supplier dominance” fraction. Although, it is considered “independent” since the relationship exist in a highly competitive market. The scarcity of market supply is also low and the case company could, in that way, easily find alternative supply.
Empirical Study
The environment is, according to Cox et al. (2002), in nine relationships out of twelve completely of a nature where buyer-supplier independence commonly arises. In relationship one, three and six certain fabrics are occasionally unavailable. Even though, the authors consider them to be of independent character since it would be easy for the buyer to change type of fabric (pers. comm., N. Zakari, 2008-04-01; S. Sadaan Maximous Attia, 2008-04-21).
4.3.2 Content and Managing of Shared Information
The content of shared information is in all relationships considered traditional. Relationship one, two, four, five, eleven and twelve would although as well, include some “soft” data, where both “General market information” and “Information about season demand changes” is considered “soft”. The information is thus in these relationships more detailed than the average relationship. In these relationships including “soft” data is the average order cycle time 1.5 days, compared to 1.33 days, when all relationships are included.
0
0 100
100
Percentage of buyer’s purchase that come from one supplier
Percentage of supplier’s sales that go to one buyer
Supplier dominance Interdependence
Independence Buyer dominance Buyer/supplier dependence 1 2 3 4 5 6 7 8 9 10 11 12 Relationship
Empirical Study
21
Figure 7 Content/order cycle time
When the only content of shared information is purchase orders (relationship three, six, seven, eight, nine and ten) is the average order cycle time 1.17 days. In five out of these six relationships is the order cycle time always less than 24 hours.
Relationship six and ten only use face-to-face communication, which is the “richest” media, the other ten relationships use face-to-face together with telephone communication. In the two information technology dissimilar relationships, is the content of shared information only purchase order.
The sharing of information is considered regular communication in all relationships except number three and six. In these two is information shared only in case of transaction. The content of shared information is in these two relationships only purchase order and the order cycle time is less than one day.
Empirical Study
Table 4 Frequency score, regular communication
When comparing those relationships that have a regular communication it is shown that relationship eleven and twelve share information most frequent. Both these relationships as well include soft data as content of shared information and the orders are delivered the same day as order placement. Relationship eight has the lowest communication frequency, including only purchase order, and the order cycle time is up to three days long
In 50 % of the relationships (relationship three, six, seven, eight, nine and ten) looked at are purchase orders the only content of shared information. Hence, the communication frequency only describes how often the buyer actually wants to do business with the supplier. Altogether, including these relationships in an evaluation of the communication frequency might be misleading.
Average frequency when regular communication and including soft data
Relationship Most frequent value Least frequent value
Average frequency value Score One 1,00 0,14 0,57 -0,10 Two 1,00 0,14 0,57 -0,10 Four 1,00 0,14 0,57 -0,10 Five 0,14 0,07 0,11 -0,83 Eleven 1,00 1,00 1,00 0,57 Twelve 1,00 1,00 1,00 0,57 Average (mean) 0,64
Table 5 Frequency score, regular communication including soft data
Instead the remaining six relationships might give a better understanding of the actual situation. Relationship eleven and twelve still have the highest frequency score and the information is hence shared very often. The lowest communication frequency is here, although, represented by relationship five, which have an order cycle time that is less than one day.
Average frequency when regular communication
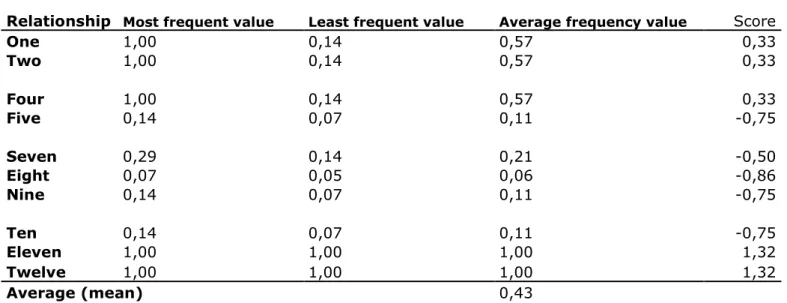
Relationship Most frequent value Least frequent value Average frequency value Score
One 1,00 0,14 0,57 0,33 Two 1,00 0,14 0,57 0,33 Four 1,00 0,14 0,57 0,33 Five 0,14 0,07 0,11 -0,75 Seven 0,29 0,14 0,21 -0,50 Eight 0,07 0,05 0,06 -0,86 Nine 0,14 0,07 0,11 -0,75 Ten 0,14 0,07 0,11 -0,75 Eleven 1,00 1,00 1,00 1,32 Twelve 1,00 1,00 1,00 1,32 Average (mean) 0,43
Conclusions and Discussion
23
5 Conclusions and Discussion
In this chapter are the conclusions made from the findings presented together with an evaluating discussion.
5.1 Conclusions
§ The content of shared information is mainly of traditional character, nevertheless do 50 % of the relationships as well include elements of additional soft information.
§ The information sharing is regular communication in ten out of twelve relationships.
§ The regular communication varies in frequency with an average of 0.43, once every 2.3 days.
§ When soft data is included in the regular communication is the average communication frequency 0.64, once every 1.6 days.
§ The order cycle times vary up to a maximum of three days, with an average of 1.33 days.
§ The order cycle time has an average of 1.5 days when the shared information as well includes soft data.
§ All information is shared through two different information technologies, of which both are “rich”: face-to-face and telephone. Two relationships do not use telephone communication.
5.2 Discussion
Information sharing in the clothes manufacturing industry of Imbaba and Warrak appear to have an obvious and important influence on the manufacturing efficiency. In agreement with Mohr and Spekman (1996) the communication made from buyer to supplier indeed emerges as a ”key to vitality”. This particularly in terms of the overall business flexibility, which as well look to be the solution to the market’s distinct requirements on an ability to quickly adjust to constantly occurring changes. In addition to this, the flexibility also seem to be a behaviour that the overall market environment encourages, in terms of e.g. low cost of search, low personnel costs, a huge local fairly constant demand and a demand that, depending on low end customer market requirements, most often actually seems to be controlled by the manufacturing industry itself.
The frequent use of so-called “rich” media to communicate routine messages, despite the risk of communication failure (Lengel & Daft, 1988), probably arrives from these, just mentioned, facts. It is an obvious, but not necessarily intentional, choice. A change, where a “rich” media would be changed to a less “rich”, would probably intrude a whole lot on the case companies’ ability to match expectations from other supply chain members and also to exist in the very business environment. The case companies basically seem to prioritize flexibility instead of having high specific requests on certain materials and suppliers. The relationship between individual people representing different organizations is instead highly valued and focused as the way of sharing information.
Conclusions and Discussion
The frequent use of “rich” media furthermore as well seems to encourage the sharing of soft information. The content of the shared information has shown to be mainly of traditional character, although, is elements of additional soft data included in 50 % of the relationships. The situation might be that the buyer is sharing more information than what he is aware of and the findings are showing. The authors find this likely, even though the additional information shared might not necessarily be of significant importance for the outcome of the transaction. The categorization of content of shared information might seemingly be better executed according to Cachon and Fisher (2000) than Håkansson (1982). This made to focus on traditional information sharing, along with additional input, instead of applying the concept of soft data.
In addition to the findings on communication frequency did all the interviewees as well point out that seasons of high demand from their customers leads to high inventory turnover which in next turn leads to even more and closer contact with the suppliers. If the content of this communication exceeds “purchase orders” the higher frequency could in next term lead to more relationship stability and company satisfaction (Burkink, 2002; Bukó & Wagner, 2005).
From a general perspective of looking at a rather poor district in continuing development the authors have seen, and been positively surprised by, a tremendous manufacturing productivity and efficiency.
References
25
6 References
6.1 Books
Cox, A., Ireland, P., Lonsdale, C., Sanderson, J. and Watson, G. (2002), Supply
Chains, Markets and Powers, Routledge, London.
Hill, T. (2000) “Manufacturing strategy”, 2nd edition, Antony Row Ltd, Withshire, England
Håkansson H. Editor (1982) “International Marketing and Purchasing Project
Group: International marketing and purchasing of industrial goods: an interaction approach” Johan Wiley and Sons LTD, Hampshire
Håkansson, H. and Snehota, I., (1995), Developing Relationships in Business
Network, Routledge, London.
Merriam, S. (1998) Qualitative Research and Case Study Applications in
Education, 2nd edition, Jossey-Bass Publishers, San Francisco.
Mintzberg, H. (1973). The nature of managerial work, New York, cop
Patel, R. and Davidson, B. (1994) Forskningsmetodikens grunder. Studentlitteratur, Lund.
Slack, N. and Lewis, M. (2002) Operations strategy, Pearson Education Ltd, England.
6.2 Articles
Anderson, J. C., Håkansson, H., and Johansson, J. (1994) “Dyadic relationships within a business network context” Journal of Marketing, Vol. 28, p.337-358. Burkink, T. (2002) "Cooperative and Voluntary Wholesale Groups: Channel
Coordination and lnterfirm Knowledge Transfer," Supply Chain Management. Vol. 7 No. 2 p. 60-70.
Cachon, G.P. and Fisher, M. (2000),“Supply chain inventory management and the value of shared information”, Management Science, Vol. 46 No. 8, p. 1032-48.
Emerson, R. M. (1962) “Power-dependence relations” American Sociological Review. Vol 27, p. 31-41
Lengel, R. H. and Daft, R. L. (1988) “The selection of communication media as an executive skill” The Academy of Management executive, Vol:2 No:3 p:225
Francis, J. (2008) Benchmarking: Get the Gain without the pain, Supply Chain
References
Goodman, L. E. and Dion P. A. (2001) “The Determinants of Commitment in the Distributor-Manufacturer Relationship”, Industrial Marketing Management. Vol. 30, No. 3; p. 287
Leek, S., Turnbull P. W. and Naude, P. (2003) “How is information technology affecting business relationships?” Industrial Marketing Management Vol. 32 p. 119– 126
McLaughlin E. W., Perosio D. J. and Park J. L. (2000)”Retail logistics and merchandising in the USA: current status and requirements in the year 2000”.
International journal of retail & distribution management. Vol.26, No.2, p.97.
Mohr, J and Nevin, J. R. (1990) “Communication Strategies in Marketing Channels: A Theoretical Perspective”. Journal of Marketing. Vol. 54, No. 4, p. 36
Mohr, J. and Sohi, R.S. (1995), "Communication flows in distribution channels: impact on assessments of communication quality and satisfaction", Journal of
Retailing. Vol. 71 No. 4, pp. 393-416.
Mohr, J. and Spekman, R. E. (1996) ”Perfecting Partnerships”, Marketing
Management, Vol. 4 No. 4, p. 34.
Strader, T.J., Strader, F.L. and Shaw, M.J. (1999) "The impact of information sharing on order fulfilment in divergent differentiation supply chain", Journal of Global
Information Management, Vol. 7 No.1, pp.17-25.
Tayi, G. K. and Srinidhi, B. (2006) ”A synthesizing framework for technology and content choices for information exchange”, Springer Science + Business Media, LLC, Vol. 7, pp. 239-247.
Wagner, S. M. and Bukó, C. (2005), “An Empirical Investigation of Knowledge-Sharing in Networks Sources”. The journal of supply chain management, Vol. 41 No. 4 p. 17
Wu, W-Y., Chiag, C-Y., Wu, Y-J. and Tu, H-J. (2004) “The Influencing Factors of Commitment and Business Integration on Supply Chain Management”, Industrial
Management & Data Systems, Vol. 104 No. 4, p. 322-333.
6.3 Internet
The New York Times(1994-11-29)
“
Cairo Journal; In the Slums, a Tug-of-War for Hearts and Minds” Hedges, C:http://query.nytimes.com/gst/fullpage.html?res=9D06E2DA1330F93AA15752C1A96
References
Appendix
7 Appendix
Appendix 1: Interview Question
Appendix 2: Interview Answers
Appendix 3: Order Cycle Time Score
Appendix
29
7.1 Appendix 1: Interview Questions
Focal company, about relationships to suppliers Question 1. - Company information, o Name o Establishing year, o Sales, o Employees. Question 2. - Supplier information, o Name, o Product supplied. Question 3.
- How big share of the supplier’s total sales does your company stand for? - How big share of your company’s total purchase does the supplier stand for? Question 4.
- What does the market environment look like, in terms of, o Competition between suppliers,
o Fragmentation of buyers,
o Information about supply market offerings, o Scarcity of supply market and demand? Question 5.
- Which information do you share to the supplier? Question 6.
- How often do you share this information? Question 7.
- How long is the order cycle time, time from order placement to received order?
Question 8.
Appendix
7.2 Appendix 2: Interview Answers
Focal Company one: Stevano Factory, trousers
Interview was made with Nazer Zakari and Said Sadaan Maximous Attia, Said Sadaan Maximous Attia was translating.
Relationship one
Kourani Brothers supplying Stevano factory, trousers, with fabrics for trousers. Level of dependence
Level of purchase and sale:
- 30 % of Stevano Factory, trousers’ total purchase. - < 7 % of Kourani’s total sales.
Environment nature:
- The market of fabrics for trousers is highly competitive. - Information about the market offerings can be easily collected. - Certain fabrics are occasionally unavailable.
- Scarcity of demand is low. Information sharing:
Content:
- Purchase orders.
- Information about season demand changes. - General market information.
Communication frequency:
- Daily – one/two times per week. Order cycle time:
- Same day – two/three days. Information technology:
- Telephone - Face-to-face
Relationship two - Supplier: Domiati
Supplying Stevano factory with fabrics for trousers. Level of dependence
Level of purchase and sale:
- 25 % of Stevano factory’s total purchase. - 30 % of Domiati’s total sales.
Appendix
31
- The market of fabrics for trousers is highly competitive. - Information about the market offerings can be easily collected. - The scarcity of market supply and demand is low.
Information sharing: Content:
- Purchase orders.
- Information about season demand changes. - General market information.
Communication frequency:
- Daily – one/two times per week. Order cycle time:
- Same day – two/three days. Information technology:
- Telephone - Face-to-face
Relationship three – Supplier: El Alameya Company
Supplying Stevano with fabrics for trousers. Level of dependence
Level of purchase and sale:
- < 5 % of Stevano factory, shirts’ total purchase. - < 5 % of El Alameya’s total sales.
Environment nature:
- The market of fabrics for trousers is highly competitive. - Information about the market offerings can be easily collected. - Certain fabrics are occasionally unavailable.
- Scarcity of demand is low. Information sharing:
Content:
- Purchase orders. Communication frequency:
- Only in times of transaction, one time per week. Order cycle time:
- Same day. Information technology:
- Telephone - Face-to-face
Appendix Focal Company two: Stevano Factory, shirts Interview was made with Said Sadaan Maximous Attia.
Relationship four – Supplier: Domiati
Supplying Stevano factory with fabrics for shirts. Level of dependence
Level of purchase and sale:
- 50 % of Stevano factory’s total purchase. - 25 % of Domiati’s total sales.
Environment nature:
- The market of fabrics for shirts is highly competitive.
- Information about the market offerings can be easily collected. - The scarcity of market supply and demand is low.
Information sharing: Content:
- Purchase orders.
- Information about season demand changes. - General market information.
Communication frequency:
- Daily – one/two times per week. Order cycle time:
- Same day – two/three days. Information technology:
- Telephone - Face-to-face
Relationship five – Supplier: El Wefa
Supplying Stevano with fabrics for shirts. Level of dependence
Level of purchase and sale:
- 50 % of Stevano factory, shirts’ total purchase. - 10 % of El Wefa’s total sales.
Environment nature:
- The market of fabrics for shirts is highly competitive.
- Information about the market offerings can be easily collected. - The scarcity of market supply and demand is low.
Appendix
33 Content:
- Purchase orders.
- Information about season demand changes. - General market information.
Communication frequency:
- One time per week – one time per two weeks. Order cycle time:
- Same day. Information technology:
- Telephone - Face-to-face
Relationship six – Supplier: Soker Company
Supplying Stevano with fabrics for shirts. Level of dependence
Level of purchase and sale:
- 5 % of Stevano factory, shirts’ total purchase. - 1 % of Soker Company’s total sales.
Environment nature:
- The market of fabrics for shirts is highly competitive.
- Information about the market offerings can be easily collected. - Certain fabrics are occasionally unavailable.
- Scarcity of demand is low. Information sharing:
Content:
- Purchase orders. Communication frequency:
- Only in times of transaction, daily. Order cycle time:
- Same day. Information technology:
- Face-to-face
Focal Company three: Kaukab el Sobeh
Interview was made with Romani Kamel, Said Sadaan Maximous Attia was translating.
Appendix
Relationship seven – Supplier: Nazeh
Supplying Kaukab el Sobeh with fabrics for abeya. Level of dependence
Level of purchase and sale:
- Varying, can be up till 70 %, depending on season, of Kaukab el Sobeh’s total purchase.
- 10 % of Nazeh’s total sales. Environment nature:
- The market of fabrics for abeya is highly competitive.
- Information about the market offerings can be easily collected. - The scarcity of market supply and demand is low.
Information sharing: Content:
- Purchase orders. Communication frequency:
- One/two times per week. Order cycle time:
- Same day. Information technology:
- Telephone - Face-to-face
Relationship eight – Supplier: Magdy Hanna
Supplying Kaukab el Sobeh with fabrics for abeya. Level of dependence
Level of purchase and sale:
- 10 % of Kaukab el Sobeh’s total purchase. - 1 % of Magdy Hanna’s total sales.
Environment nature:
- The market of fabrics for abeya is highly competitive.
- Information about the market offerings can be easily collected. - The scarcity of market supply and demand is low.
Appendix
35 Communication frequency:
- One time per two weeks - one time per three weeks. Order cycle time:
- Same day - two/three days. Information technology:
- Telephone - Face-to-face
Relationship nine – Supplier: Heshem
Supplying Kaukab el Sobeh with fabrics for decorations of abeya. Level of dependence
Level of purchase and sale:
- < 5 % of Kaukab el Sobeh’s total purchase. - 2-3 % of Heshem’s total sales.
Environment nature:
- The market of fabrics for decorations of abeya is highly competitive. - Information about the market offerings can be easily collected. - The scarcity of market supply and demand is low.
Information sharing: Content:
- Purchase orders. Communication frequency:
- One time per week - one time per two weeks. Order cycle time:
- Same day. Information technology:
- Telephone - Face-to-face
Focal Company four: El Batel
Interview was made with Nnn Nnn, Said Sadaan Maximous Attia was translating.
Relationship ten – Supplier: Boray
Supplying El Batel with fabrics for abeya. Level of dependence
Appendix
- 30 % of El Batel’s total purchase. - < 1 % of Boray’s total sales. Environment nature:
- The market of fabrics for abeya is highly competitive.
- Information about the market offerings can be easily collected. - The scarcity of market supply and demand is low.
Information sharing: Content:
- Purchase orders. Communication frequency:
- One time per week - one time per two weeks. Order cycle time:
- Same day. Information technology:
- Face-to-face
Relationship eleven – Supplier: Nazeh
Supplying El Batel with fabrics for abeya. Level of dependence
Level of purchase and sale:
- 50 % of El Batel’s total purchase. - < 10 % of Nazeh’s total sales. Environment nature:
- The market of fabrics for abeya is highly competitive.
- Information about the market offerings can be easily collected. - The scarcity of market supply and demand is low.
Information sharing: Content:
- Purchase orders.
- Information about season demand changes. Communication frequency:
- Daily. Order cycle time:
- Same day. Information technology:
Appendix
37 - Face-to-face
Relationship twelve – Supplier: Rashad
Supplying El Batel with fabrics for abeya. Level of dependence
Level of purchase and sale:
- 15 % of El Batel’s total purchase. - 10 % of Rashad’s total sales. Environment nature:
- The market of fabrics for abeya is highly competitive.
- Information about the market offerings can be easily collected. - The scarcity of market supply and demand is low.
Information sharing: Content:
- Purchase orders.
- General market information. Communication frequency:
- Daily. Order cycle time:
- Same day. Information technology:
- Telephone - Face-to-face
Appendix
7.3 Appendix 3: Order Cycle Time Score
Order cycle timeRelationship Shortest max. Longest max.
Average value score One 1 3 2 0,5 Two 1 3 2 0,5 Three 1 1 1 -0,25 Four 1 3 2 0,5 Five 1 1 1 -0,25 Six 1 1 1 -0,25 Seven 1 1 1 -0,25 Eight 1 3 2 0,5 Nine 1 1 1 -0,25 Ten 1 1 1 -0,25 Eleven 1 1 1 -0,25 Twelve 1 1 1 -0,25 Average (mean) 1,333333333
Order cycle time when including soft data
Relationship Shortest Longest
Average value score One 1 3 2 0,33333333 Two 1 3 2 0,33333333 Four 1 3 2 0,33333333 Five 1 1 1 -0,3333333 Eleven 1 1 1 -0,3333333 Twelve 1 1 1 -0,3333333 Average (mean) 1,5
Order cycle time when not including soft data
Relationship Shortest Longest
Average value score Three 1 1 1 -0,1428571 Six 1 1 1 -0,1428571 Seven 1 1 1 -0,1428571 Eight 1 3 2 0,71428571 Nine 1 1 1 -0,1428571 Ten 1 1 1 -0,1428571 1,166666667
Appendix
39
7.4 Appendix 4: Communication Frequency Score
Most Least Average frequent frequent frequency
Relationship value value value Score
One 1.00 0.14 0.57 0.26 Two 1.00 0.14 0.57 0.26 Three 0.14 0.14 0.14 -0.69 Four 1.00 0.14 0.57 0.26 Five 0.14 0.07 0.11 -0.76 Six 1.00 1.00 1.00 1.20 Seven 0.29 0.14 0.21 -0.53 Eight 0.07 0.05 0.06 -0.87 Nine 0.14 0.07 0.11 -0.76 Ten 0.14 0.07 0.11 -0.76 Eleven 1.00 1.00 1.00 1.20 Twelve 1.00 1.00 1.00 1.20 Average (mean) 0.45