ISABE2019
A Modelling Approach of Variable
Geometry for Low Pressure Ratio Fans
Mavroudis D. Kavvalos1,*, Xin Zhao1, Rainer Schnell2, Ioanna Aslanidou1, Anestis I. Kalfas1,3 and Konstantinos G. Kyprianidis1* Corresponding author: mavroudis.kavvalos@mdh.se
1 Mälardalen University (MDH)
Future Energy Center Västerås
Sweden
2 German Aerospace Center (DLR)
Institute of Propulsion Technology Cologne
Germany
3 Aristotle University of Thessaloniki
Department of Mechanical Engineering Thessaloniki
Greece
ABSTRACT
This paper presents the development and application of a modelling approach of variable geometry concepts for low pressure ratio fans; namely Variable Area Nozzle and Variable Pitch Fan. An enhanced approach for Outlet Guide Vane pressure loss predictions and an aerothermodynamic analysis of variable pitch concept are developed and integrated into a multi-disciplinary conceptual engine design framework. A streamline curvature algorithm is deployed for the derivation of the off-design fan performance map, alleviating scaling issues from higher pressure ratio fan designs. Correction deltas are derived through the variable pitch analysis for calculating the re-shaped off-design fan performance map. The aforementioned variable geometry concepts are evaluated in terms of surge margin at engine and aircraft level for a low pressure ratio aft-fan of a hybrid-electric configuration. Performance assessments carried out suggest that a +8° closing of fan blade cascades leads to a 33% surge margin improvement (with reference being the surge margin without variable geometry) compared to a 25% improvement achieved by +20% opening the nozzle area at end of runway take-off conditions. Although weight and complexity implications of variable geometry are not considered, the integrated modelling approach is shown to be able to assess and compare such novel engine technologies for low pressure ratio fans in terms of operability.
Keywords: Low Pressure Ratio Fan; Variable Area Nozzle; Variable Pitch Fan; Conceptual Design;
SRIA Strategic Research and Innovation Agenda
TOC Top Of Climb
UHBR Ultra High Bypass Ratio VAN Variable Area Nozzle VPF Variable Pitch Fan
Symbols
𝐶" Axial Velocity, 𝑚/𝑠
𝑚̇'()) Corrected Mass Flow, 𝑘𝑔/𝑠
𝑁 Rotational Speed
𝑃 Pressure, 𝑃𝑎
𝑆𝑀 Surge Margin
𝑊)23 Relative Velocity, 𝑚/𝑠
𝜂56 Isentropic Efficiency
𝜃 Variable Pitch Angle, °
𝜌 Density, 𝑘𝑔/𝑚9
Subscripts
(. )= Referring to total flow conditions
(. )5> Referring to inlet conditions
(. )>(? Referring to nominal conditions
(. )@AB Referring to fan OGV station
(. )(CD Referring to exit conditions
(. )E Referring to fan rotor station
(. )BFG Referring to Variable Pitch Fan conditions
1.0 INTRODUCTION
1.1 Background
Air traffic growth is anticipated to continue at a fast pace not only in Europe but also worldwide, with the passenger number to double itself within the next 20 years [1]. Public and regulatory bodies have focused their attention on this rapid growth, setting stringent legislation to mitigate the risk of future prohibitive environmental consequences. Advisory Council for Aviation Research in Europe (ACARE) has developed a Strategic Research and Innovation Agenda (SRIA) to meet the challenging goals of reducing gaseous and noise emissions, set by Flightpath 2050 [2]. International Civil Aviation Organisation (ICAO), being at the forefront of aviation environmental issues, has agreed a comprehensive set of emission goals after a decision-making plan based on environmental trends projection [3]. Collaboration between universities, research organisations and industry are of uttermost importance to achieve such environmental targets both, in engine and aircraft mission level, while air traffic management and operations will play a major role as well.
Engine technology is evolving, leading the way for more efficient, silent and environmentally friendly engine concepts. Ultra High Bypass Ratio (UHBR) turbofan engine configurations have been extensively
studied across the globe, showcasing significant fuel saving. The low specific thrust levels lead to higher propulsive efficiency, but nacelle and low pressure spool design become even more demanding in terms of performance, weight and noise [4]. UHBR engines favour the integration with different system technologies such as gearbox, intercooler and heat exchanger. Kyprianidis’ work [5] on three novel engine cycles with the aforementioned technologies highlighted a great potential of UHBR engine configurations to reduce fuel consumption and gaseous emissions. Alexiou et al. [6] explored the design space of engine cycles for a UHBR Geared TurboFan (GTF) in terms of performance assessment at engine level, concluding that multi-disciplinary optimisation of such cycles should be carried out both in engine and aircraft mission level.
Stringent legislation for gaseous and noise emission reduction has been the enabler for investigating more revolutionary engine and aircraft technologies, with the electrification being a promising solution for radical changes in aviation on the upcoming years. While purely electrical concepts seem unlikely to enter the aviation market in near-term due to high specific energy needs, turbo- and hybrid-electric configurations demonstrate substantial potential benefits in terms of main gas generator operability and cycle optimisation [7] as well as distribution of thrust generation. Boundary Layer Ingesting (BLI) propulsion concepts have been broadly investigated as potential hybrid-electric configurations and are of major interest for the current work. Within this context, NASA developed and studied the STARC-ABL concept [8], comprising a tube-and-wing aircraft with two conventional under-wing engines along with an axisymmetric electrically-driven rear fuselage BLI fan (aft-fan). Dedicated studies on BLI concepts [9] have outlined a considerable installed block fuel benefit due to increased propulsive efficiency [10] and reduced overall weight of the downsized underwing turbofans.
1.2 Low pressure ratio fans with variable geometry
Low pressure ratio fans or propulsors constitute one of the most important components of the aforementioned engine technologies, whose contribution is crucial for the overall thrust requirements. Improving engine specific fuel consumption can be achieved either be increasing thermal or propulsive efficiency. The latter achievement can be obtained through reduced specific thrust, which corresponds to a lower Fan Pressure Ratio (FPR) and in principle a higher ByPass Ratio (BPR) [11], as illustrated in Figure 1. It is generally accepted that low FPR are associated with values below 1.45 [6, 11, 12]. For low pressure ratio fans, nozzle is well unchoked at take-off and initial climb, where fan surge and operability issues become dominant. The same observation is valid for hybrid-electric applications like distributed fans or aft-fans, where the increase of effective BPR results in reducing FPR [8].
The necessity for using fans with low pressure ratio led to novel engine configurations with variable geometry. Sufficient fan surge margin and operability for FPR below 1.4 can be achieved either with Variable Area Nozzle (VAN) or Variable Pitch Fan (VPF), as shown in Error! Reference source not
found.. Although these two variable geometry concepts tackle the same operability issue, they function in
a completely different manner imposing disparate issues in terms of weight, cost and maintenance. With respect to fan performance, VAN increases/decreases the fan nozzle throat area, swallowing more/less airflow, thereby moving the fan operating point to higher/smaller flow capacities and hence fan Surge Margin (SM) increases/decreases. On the other hand, VPF opens/closes the fan blade cascades, which moves the fan map characteristics (and surge line) to higher/smaller mass flow capacities, thereby reducing/increasing fan SM without changing the fan operating point.
Throughout the years, numerous attempts have been recorded for performance modelling of variable geometry concepts. McKay et al. [13] outlined that VAN constitutes an effective solution for BPR between 12 and 15. For BPR beyond 25, VAN becomes ineffective in terms of weight and cost, thereby suggesting the implementation of VPF with the potential benefit of thrust reversing [13]. Krishnan et al. [14] investigated the design space and trade-offs between VAN and VPF for future commercial aeroengines, concluding that VAN becomes prohibitive at very low FPR and high BPR. Haliwell et al. [15] compared the fuel burn benefits of a variable-pitch GTF engine with a baseline turbofan engine, showcasing the fan operability improvement that comes at the expense of 3.8% higher fuel consumption. Alexiou et al. [6] demonstrated the impact of VPF and VAN on UHBR GTF engine performance for take-off operating point, which both increased the fan bypass surge margin.
1.3 Scope of present work
In the light of the anticipated variable geometry modelling trends outlined above, the general scope of this work is to present a modelling approach for low pressure ratio fans, focusing mainly on variable geometry concepts; namely Variable Area Nozzle (VAN) and Variable Pitch Fan (VPF). The proposed approach is
Figure 1 Optimum BPR for a given choice of FPR (adopted from [11])
incorporated into a multi-disciplinary aero engine conceptual design framework with the aid of a streamline curvature algorithm, which both have been validated and extensively used for several research projects. An enhanced modelling approach for fan Outlet Guide Vane (OGV) pressure loss predictions has been developed and incorporated into the engine conceptual design algorithm and computational framework EVA, developed by Kyprianidis [16]. The streamline curvature solver ACDC [17], developed in DLR, has been used to derive the off-design fan map, preventing scaling problems from higher pressure ratio fans. A modelling approach of the variable pitch concept has also been developed, deriving correction deltas for the calculation of the re-shaped fan performance map. The coupling of a 0D engine conceptual design algorithm with a 2D through-flow code can give particular insight on fan stage performance, considering from engine cycle thermodynamics to blade aerodynamic design. The current work will be focused on the performance assessment of the aforementioned variable geometry concepts in terms of surge margin, without considering the implications imposed by added weight and design complexity. It is important, firstly, to quantify the benefits of variable geometry in a standalone manner, and then proceed to trade-off studies with weight and complexity.
Performance assessments will be carried out for an aft-fan design of a hybrid-electric configuration, which has been studied and analysed in-house. The entire aircraft-engine configuration comprises an A320-like, single-aisle aircraft configuration for short range applications and capacity of 150 PAX, with two underwing year 2035 Entry Into Service (EIS) GTF engines and one fuselage mounted BLI electric aft-fan.
2.0 METHODOLOGY
As highlighted above, low pressure ratio fans demonstrate a considerable need for variable geometry due to reduced surge margin. VAN and VPF constitute two promising system technologies with different functionality to overcome such operability issues, that can be implemented to any engine configuration at simulation level. To enable the performance assessment of such technologies at engine and aircraft system level, EVA conceptual engine design framework and the through-flow solver ACDC have been employed. Before proceeding to the developed methodology of VPF concept and fan OGV pressure loss modelling approach, an introduction to the aforementioned tools will be presented.
2.1 Engine Conceptual Design Framework
EVA conceptual design algorithm and computational framework, developed by Kyprianidis [16], has been used as the engine performance prediction tool for this work. The proposed framework features a sophisticated explicit modular design from major engine component design to aircraft system level performance, integrated in an optimiser environment. Engine performance, dimensions, weight and production cost, aircraft aerodynamics, performance, dimensions and weight, emissions and environmental impact, noise as well as economics constitute disciplines incorporated within EVA framework, enabling rapid assessments and optimization of novel engine technologies. A mutli-point synthesis matching scheme was used when needed, where the key idea is to match the cycle not only at the reference (or Design Point) conditions, but at multiple operating points, by varying a number of state variables to satisfy an equal number of specific performance targets and/or constraints at other operating conditions [16, 18, 19].
2.2 Streamline Curvature Algorithm
Advanced Compressor Design Code (ACDC) constitutes a 2D streamline curvature method, developed in DLR, and has been used for the conceptual design of the aft-fan. Such designs emanate from viscous throughflow calculations and blade-to-blade analysis [17], and provide all the necessary data to assess the stage performance in the throughflow plane. It comprises two modes; design mode and off-design assessment. The latter evaluates the resulting -from a large aerofoil database- design at off-design conditions and predicts the overall stage performance over the entire flight envelope. Machine learning techniques are applied to select optimal aerofoil profiles for each layer subject to performance requirements [20, 21]. Blade geometric parameters are directly linked with performance parameters, allowing aerofoil stacking to generate a full 3D blade geometry which can be imported for CFD studies.
2.3 Fan OGV Pressure Loss Modelling
Traditional fan performance prediction methods are accurate enough until design pressure ratios of 1.5-1.6. Below that it can be quite challenging to calculate fan stage performance precisely, especially during mid-altitude descent. In this condition, fan nozzle is typically choked, resulting in a steep working line and operation in the flutter region of the fan, where sharp losses in efficiency occur. It is possible for the fan rotor to have a low but positive PR with the fan OGV losses to be even higher, leading to a negative fan stage PR that traditional modelling approaches would interpret as positive fan work, which is not the case. Within this context, a fan OGV pressure loss modelling approach has been developed and described below for the aft-fan of the aforementioned hybrid-electric configuration.
The purpose of this approach is to derive a map for OGV pressure losses as a function of OGV inlet swirl angle and OGV inlet Mach number. In this way, fan stage PR is decoupled into fan rotor and fan OGV performance maps, leading to an enhanced and generic assessment of fan stage performance. An experimental approach of decoupling fan rotor and fan OGV performance has been carried out by Hughes [22], where he tested the off-design performance of three different OGV blade geometries. For our case, ACDC code was employed for the off-design performance data of the aft-fan, as described in section 2.2, with its design specifications to be outlined in Table 1. A design fan stage PR of 1.2 and work coefficient of 0.4, with work extraction of 1200 kW from the low-speed shaft are indicative for an aft-fan of such hybrid-electric configuration and have been fixed after several in-house sensitivity analyses in terms of power, thrust split and aft-fan momentum inlet deficit due to BLI effect. These performance parameters have been established for the entire modelling approach presented throughout this paper.
Table 1
Aft-fan design specifications
Parameter Value Units
Design Fan Stage Pressure Ratio 1.2 [-]
Work Coefficient 0.4 [-]
Work Extraction 1200 [kW]
It should be mentioned herein that positive sign convention for OGV inlet swirl angles has been considered the direction of rotation of the fan rotor. Moreover, OGV pressure loss equals the difference of absolute total pressures between OGV inlet and OGV exit stations divided by OGV inlet absolute total pressure, as illustrated in Equation 1.
𝑂𝐺𝑉𝑙𝑜𝑠𝑠 = 𝑃(,@AB5>− 𝑃(,@AB(CD
𝑃(,@AB5> ( 1 )
Using ACDC off-design fan performance raw data and Equation 1, OGV pressure losses with respect to OGV inlet swirl angle for different rotor relativized rotational speeds (30% up to 110%) were calculated. OGV inlet swirl angle generally serves as incidence angle for the OGV aerofoils. As expected, there was a range of inlet swirl angles (from 25° to 33°), where pressure losses are minimum, collapsing each curve on top of the other. Interpolating these curves for a range of Mach numbers generates the loss characteristics in Figure 2. They have been smoothed and extended to a swirl angle range of interest for enhanced fan stage performance assessments when integrated into EVA framework.
2.4 VPF modelling approach
Variable pitch fan concept improves fan operability issues by re-locating the map and moving surge line to lower flow capacities. This can be achieved when ‘closing’ the fan blade cascade or using positive values
Figure 2 OGV loss characteristics as a function of OGV inlet swirl and OGV inlet Mach number
of fan pitch angle, whereas ‘opening’ the fan blade cascade with negative fan pitch angles leads to opposite results. Again, this is a sign convention followed throughout this work and should be double-checked when cross-comparing results with other VPF related studies. The target of the modelling approach described below is to develop a methodology of predicting the fan map modification with respect to fan pitch angle settings, or in other words, to derive correlations and correction deltas as a function of fan pitch angle that should be applied to PR, flow capacity and isentropic efficiency in order to modify the fan performance map subject to the user input fan pitch angle.
The idea of the aerothermodynamic analysis of VPF concept has been initially proposed by Converse [23], where he analysed variable geometry for inlet guide vanes and fan rotor blades. It should be noted herein that the entire aerothermodynamic analysis has been based on the major assumption of operating along the backbone curve (maximum efficiency or min-loss line for each fan characteristic), thereby imposing significant uncertainty while diverging from this line. Modelling along the min-loss line implies that incidence and deviation angles are close to their optimum locus which are not far from zero values. The first step of the analysis constitutes the calculation of velocity diagrams for different blade setting angles. The required aerodynamic off-design data has been retrieved by the throughflow code for the described aft-fan configuration. Figure 3 shows the aft-fan performance map, as calculated from ACDC, pinpointing three loci along the backbone line for relativized rotational speed of 60%, 90% and 110%. Velocity diagrams have been, then, calculated for nominal fan pitch angle, as well as for VPF angles of +6° and -6°, as presented in Figure 4. The velocity diagrams analysis has been based on the approach of keeping constant rotational speed while changing the fan blade setting angle, thereby justifying the fixed value of rotational speed for each peak efficiency point. It is reminded that the entire analysis is based on operation along the backbone curve, hence no incidence or deviation angles have been considered on the velocity diagrams calculation. Another point of interest for this analysis constitute the axial velocity ratio 𝐶")QD5( between rotor and OGV inlet stations for different fan pitch angles, which is based on the corresponding density ratio 𝜌)QD5(. For terminology clarification, definitions of axial velocity ratio and density ratio for
different fan pitch angles follow:
𝜌)QD5(= R𝜌𝜌@AB,5> E,5> S>(? R𝜌𝜌@AB,5> E,5> SBFG ( 2 ) 𝐶")QD5(= T𝐶𝐶"@AB,5> "E,5> U>(? T𝐶𝐶"@AB,5> "E,5> UBFG ( 3 )
Figure 3 Aft-fan performance map with peak-efficiency points A, B and C corresponding to 60%, 90% and 110% relativized rotational speed respectively
Figure 4 Velocity diagrams of peak efficiency points A, B and C corresponding to 60%, 90% and 110% relativized rotational speed for nominal (grey), +6° (red) and -6° (blue) fan pitch angles
Where R stands for fan rotor, nom for nominal pitch and VPF for any user input fan variable pitch angle. It is assumed that there are negligible aerodynamic and thermodynamic differences between fan rotor exit and fan OGV inlet. Consequently, it has been calculated that density ratio for different pitch angles is close to unity with small deviation as we diverge from design point. This justifies the fact of keeping axial velocity ratio for variable pitch the same as axial velocity ratio for nominal pitch, as can been observed from Figure 4. It can be verified that ‘closing’ the fan blade cascade or setting a positive (+6°) fan pitch angle, axial velocities and hence flow capacities move to lower values, thereby improving surge margin. On the other hand, ‘opening’ the fan blade cascade or setting a negative (-6°) fan pitch angle, axial velocities and hence flow capacities move to higher values, thereby reducing surge margin. It is interesting the fact that assuming uniform inflow to the fan rotor and analysis of constant rotational speed, yields constant absolute swirl velocity at OGV inlet for variable pitch fan settings, hence constant stage loading. This is also verified with the analysis presented by Converse [23] which is mainly an outcome of operating along the backbone curve for the aforementioned VPF analysis.
Figure 5 Aft-fan performance map for nominal pitch (left) and +8° VPF (right)
The next step is to derive correlations and correction deltas that should be applied to nominal fan map parameters (PR, flow capacity and isentropic efficiency) in order to calculate the re-shaped map due to the VPF concept. The derived deltas are defined in terms of partial derivatives of PR, flow capacity and isentropic efficiency with respect to fan pitch angle and are functions of percentage relativized rotational speed, as presented in Equations 4 and 5.
Where 𝑚̇'()) corresponds to corrected mass flow, 𝜃 to VPF angle, 𝜂56 to fan stage isentropic efficiency,
𝑊)23 to rotor inlet relative velocity and %𝑁 to relativized rotational speed. As outlined above, correction
delta for PR seems to be not applicable since the constant absolute swirl velocity at OGV inlet leads to constant stage loading and work coefficient. This means that the updated fan map characteristics will be modified only in terms of flow capacity and efficiency, as also proposed by Converse [23]. For corrected mass flow delta, a direct estimation of mass flow for different pitch angles was carried out, since axial velocity and mass flow are linked through mass conservation equation. On the other hand, the isentropic efficiency delta required two steps for its estimation; the partial derivative of efficiency with respect to rotor inlet relative velocity times the partial derivative of rotor inlet relative velocity with respect to variable pitch fan angle. The former derivative can be directly calculated from the off-design data, retrieved from ACDC, along the backbone curve for each speed line, whereas the latter is a result of the velocity diagram analysis.
The results demonstrated that a linear correlation between both performance parameters with variable pitch fan angle holds well. This remark agrees with the observation of Kurzke et al [24] that these parameters change linearly when plotted against stator stagger angles. Consequently, a function of these derivatives (or deltas) with respect to relativized rotational speed were calculated and depicted in Table 2. Figure 5 demonstrates the aft-fan map re-location when a VPF of +6° is applied. As expected, aft-fan characteristics move towards lower flow capacities when closing the blade cascade. Efficiency islands have also been affected a lot, especially around the backbone curve, thereby re-locating the peak efficiency points. A similar approach has been carried out by Kurzke in GasTurb [25], which Halliwell et al. [15] employed to investigate the effect of VPF on CMF56 turbofan engine. Plot of the re-shaped fan map with +7.16° VPF led to results that are in close agreement with the one presented within this work.
Table 2
Correction deltas for corrected mass flow and efficiency with respect to % relativized rotational speed
Correction deltas 50% 60% 70% 80% 90% 100% 110% 𝜹𝒎̇𝒄𝒐𝒓𝒓 -2.1494 -2.5886 -2.9961 -3.4364 -4.0356 -4.5516 -5.1002 𝜹𝜼𝒊𝒔 [x10-3] -4.000 -4.777 -5.417 -6.137 -7.321 -8.179 -9.070 𝛿?̇`abb= 𝜕𝑚̇'()) 𝜕𝜃 = 𝑓(%𝑁) ( 4 ) 𝛿efg= 𝜕𝜂56 𝜕𝜃 = 𝜕𝜂56 𝜕𝑊)23 𝜕𝑊)23 𝜕𝜃 = 𝑓(%𝑁) ( 5 )
Figure 6 Comparison of aft-fan off-design simulation using internal (left column) and throughflow (right column) maps for specific flight operating points (top row) and cruise-climb phase (bottom row)
3.0 RESULTS AND DISCUSSIONS
The proposed developed methodology has been integrated into EVA framework, which has been deployed to demonstrate the effect of variable geometry (VAN and VPF) on the aft-fan performance of the hybrid-electric configuration. The results described below can be considered representative for low pressure fans in general. Steady-state working lines, specific flight operating points as well as part of aircraft envelope phases have been simulated through EVA and compared for different design settings. It should be noted herein that the OGV pressure loss approach described in Section 2.3 has been implemented into EVA framework for assessment of variable geometry concepts investigated below.
3.1 Singe steady-state performance map
Low pressure ratio fans impose considerable issues on the map scaling procedure compared to high pressure compressors, as highlighted from Kurzke [26]. Although he developed a new compressor map scaling procedure for conceptual design considering the effects of low PR, his methodology has been investigated down to PR of 1.5, thereby imposing questions for lower values of PR. For this reason, two different ways of generating the off-design performance map of the aft-fan have been compared. The first is a commonly used [available in open literature] fan map with design PR of 2.0 that has been scaled to PR of 1.2 for the aft-fan requirements -named as ‘internal’ for the rest of the paper- and the second is the aft-fan performance map derived directly from the streamline curvature program ACDC with design PR of 1.2, hence no scaling required -named as ‘throughflow’-.
Two different cases have been simulated through EVA framework for the following comparison of the aforementioned off-design performance maps and presented in Figure 6. The first case comprises specific flight operating points; namely Top Of Climb (TOC), cruise, take-off and descent, while cruise-climb phase for five different altitudes constitutes the second case. The first observation to highlight is the large discrepancies in efficiency islands where the simulated points are located. Although the PR-corrected mass flow relation is roughly the same for each simulation, the rotational speed – corrected mass flow relation is considerable different. As can be seen from the top row of Figure 6, take-off and descent points are located
3.2 Performance assessment of variable geometry concepts
Variable geometry technologies like VAN and VPF are mainly important for tackling operability issues of gas turbine components, which manifest themselves during take-off. They can also be effective for preventing over-speeding during cruise or descent, but this case has not been considered within this work. On the following figures, it is the aft-fan operation during take-off that will be investigated in detail. However, not only take-off for the EOR conditions, but also the entire steady-state take-off working line which comprises 6 points with a gradual increase in Mach number and a decrease in the required thrust without changing power extraction. The last point of the line coincides with the EOR take-off point of the first simulated case.
Figure 7 demonstrates results from the simulation of EOR take-off points using several variable geometry concepts. On the top left sub-figure, implementation of VAN with 5% increment has been carried out. The blue take-off point simulates the nominal case where no variable geometry has been applied. There are 4 green take-off points, corresponding to +5%, +10%, +15% and +20% opening of the nozzle area. Opening the fan nozzle throat area permits more mass flow to pass through it, thereby moving the operating point towards higher flow capacities and hence surge margin increases. It can be observed that even though the flow capacity increase in the operating point is small, surge margin improves a lot due to the relatively large gradient of surge line. Switching to the VPF concept, the top left figure illustrates the improved aft-fan operability when closing the fan blade cascade by +2°. Applying the corresponding correction deltas for corrected mass flow and isentropic efficiency as described in Section 2.4, the aft-fan map is re-shaped, and its performance is re-evaluated with the EOR take-off point to be located now to higher efficiency islands. The same but more enhanced phenomenon is observed on the rest two figures (bottom right and bottom left), where a higher VPF angle has been applied. For the case of +8° VPF, aft-fan efficiency during EOR take-off point is approximately 4% less than the peak efficiency value.
There are several ways of calculating surge margin [27], but throughout this work it is defined as the distance between the surge line and the operating point, divided by the distance between the surge line and the minimum available point working on a vertical line for constant corrected mass flow value and can be expressed as a percentage value, as presented in Equation 6.
Where 𝑆𝑀 stands for surge margin, 𝑃𝑅6C)i2 is pressure ratio at surge line, 𝑃𝑅(j is pressure ratio at the
operating point, 𝑃𝑅?5> is the lowest pressure ratio for the constant value of corrected mass flow, 𝐶𝑀𝐹
stands for corrected mass flow.
Figure 8 summarises the effect of VAN and VPF on surge margin for the aft-fan at EOR take-off. Following the definition of surge margin as depicted in Equation 6, there is a surge margin of approximately 23% without using variable geometry. Apart from the already known possible issues causing surge margin decrease (gust, deterioration, high bleed), fan inlet distortion comes on top when dealing with BLI fan designs, rendering variable geometry an essential technology for dealing with the worst-case scenario of happening all the aforementioned issues at the same time. Opening of area nozzle has been varied from 0% to 20% with a step increment of 5%, while for variable fan pitch a range from 0° until +8° with a step increment of 2° has been selected. Under no circumstances should these ranges considered equally comparable, since weight and complexity implications have not been taken into account within this study,
%𝑆𝑀 = 100 × T𝑃𝑅6C)i2− 𝑃𝑅(j
Figure 7 Simulation of EOR take-off operating points using VAN increment of 5% (top left), +2° VPF (top right), +6° VPF (bottom left) and +8° VPF (bottom right)
Figure 8 Aft-fan surge margin (%) for VAN and VPF concepts at EOR take-off
but they represent a significant indication of variable geometry effects on fan operability. Thus for relatively small changes in variable geometry, either with VAN or VPF, surge margin improves with the same rate. As we move towards larger changes in geometry, VPF seems to provide a higher value of surge margin compared to VAN. Specifically, until the first +2° closing of blade cascades it is noted an almost 5% surge margin increase per degree, while for larger than +2° closing, there is a reduction to approximately 4% surge margin increase per degree of VPF closing. On the other hand, for the first 5% nozzle area opening, it is observed a 2% rise in surge margin per 1% opening, whereas for opening the nozzle area more will result in 1% increase in surge margin per 1% opening. Finally, a +8° closing of blade cascades leads to a 33% surge margin improvement (with reference being surge margin without variable geometry) compared to a 25% improvement achieved by +20% opening the nozzle at EOR take-off conditions.
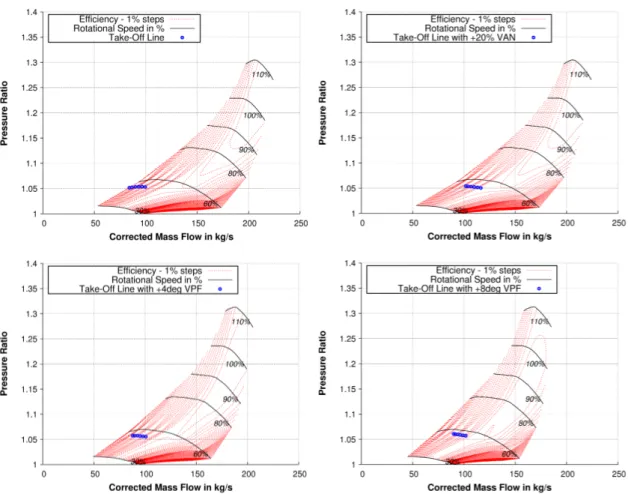
Figure 9 Aft-fan take-off working line without variable geometry (top left), with +20% VAN (top right), with +4° VPF (bottom left) and +8° VPF (bottom right)
Figure 10 Aft-fan surge margin improvement (or relative) for VAN and VPF concepts during take-off working line
Moving to the next simulation case, aft-fan performance with variable geometry has been assessed along the take-off working line; which simulates take-off at different points along the runway. Figure 9 shows simulation results of the take-off working line for the aft-fan with and without variable geometry. Top left sub-figure shows the take-off working line for fixed geometry, showcasing how close is the working line with the surge line and the necessity of applying variable geometry. Only one case of variable area nozzle has been presented here and corresponds to +20% opening of the area (top right). It is clear that the take-off working line has moved to higher flow capacities and higher efficiencies, thereby substantially surge margin. In the bottom row figures, a +4° (left) and +8° (right) VPF has been applied, demonstrating not only the surge margin improvement but also how the maps are re-shaped due to the change in fan pitch settings.
Quantification of surge margin along the take-off working line is illustrated in Figure 10. An almost linear correlation can be observed for all the illustrated variable geometry concepts along the take-off working line with point 1 to present the smallest surge margin and EOR the largest. As expected and outlined from Figure 8, +8° VPF gives the largest surge margin compared to the rest cases but it is reminded herein that the selected range for VPF and VAN cannot be considered equally comparable. It is interesting to note that for almost all the illustrated cases in the figure [apart from the case of +10% VAN], there is a larger surge margin benefit (having as reference the value of no variable geometry) for the first points along the take-off working line, whereas at the end of take-take-off line surge margin still improves but less in relative terms.
4.0 CONCLUSIONS
This paper has presented a modelling approach for low pressure ratio fans, focusing mainly on variable geometry concepts; namely Variable Area Nozzle and Variable Pitch Fan. An enhanced approach for Outlet Guide Vane pressure losses prediction has been developed and incorporated into the multi-disciplinary conceptual design EVA framework. The streamline curvature program ACDC has been used for deriving the off-design fan performance map, alleviating scaling issues from higher pressure ratio fans. A methodology for aerothermodynamic analysis of variable pitch concept has also been developed and integrated into EVA framework in terms of correction deltas that can predict the re-shape off-design fan map. Performance assessment of the aforementioned variable geometry concepts in terms of surge margin for an electrically driven aft-fan of a hybrid electric configuration has been carried out at engine and aircraft level.
The major findings presented in this work can be summarised as follows:
• The effect of variable pitch concept on the aft-fan performance map can be described with the derived correction deltas for corrected mass flow and isentropic efficiency as a function of relativized rotational speed. Correction deltas for pressure ratio are not applicable since the constant absolute swirl velocity at outlet guide vanes inlet yields constant stage loading. A linear correlation between corrected mass flow and efficiency with variable pitch angle has been observed.
• Scaling procedure for low pressure ratio fans can impose several inaccuracy issues, thereby enhancing the importance of off-design performance map derivation with streamline curvature algorithms. In a fair comparison between an internal and a throughflow aft-fan map, efficiency contours have been significantly different leading to almost 10% less efficient aft-fan operation during descent.
• Variable geometry concepts are essential for improving fan operability during several flight conditions, with take-off being the most crucial. At end of runway take-off conditions, until the first +2° closing of blade cascades it is outlined a 5% surge margin increase per degree, while for larger than +2° variable pitch, there is a 4% surge margin increase per degree. On the other hand, until the first 5% nozzle area opening, it is observed a 2% rise in surge margin per 1% opening, whereas for opening the nozzle area more will result in 1% increase in surge margin per 1% opening.
• At end of runway take-off, a +8° variable pitch results in a 33% surge margin improvement (with reference being surge margin without variable geometry) compared to a 25% increase achieved by +20% opening the nozzle area.
• Lastly, there is a larger surge margin benefit (relativized with the value of no variable geometry) of applying variable geometry for the first points of the take-off working line, whereas moving towards the last points of take-off line, surge margin still improves, but less in relative terms.
ACKNOWLEDGMENTS
The authors would like to thank DLR for carrying out the conceptual fan design and providing corresponding performance characteristics using its in-house streamline curvature algorithm.
REFERENCES
[1] ACARE, “Strategic Research & Innovatino Agenda,” Development, vol. 1, no. February, pp. 26– 28, 2017.
[2] EUROPEAN COMMISION, “Flightpath 2050 Europe’s Vision for Aviation - Report of the High Level Groupon Aviation Research,” 2011.
[8] J. WELSTEAD AND J.L.FELDER, “Conceptual Design of a Single-Aisle Turboelectric Commercial Transport with Fuselage Boundary Layer Ingestion,” in 54th AIAA Aerospace Sciences Meeting, AIAA2016-1027, San Diego, California, USA, 2016.
[9] G. BILLONNET,O.ATINAULT, AND R.GRENON, “Assessment of the Fan Simulation for quantifying the Boundary Layer Ingestion benefits on an Experimental Propulsion System,” in Proceedings of the 27th ISABE Conference, ISABE-2017-22536, Manchester, UK, 2017.
[10] A. PLAS et al., “Performance of a Boundary Layer Ingesting Propulsion System,” in 45th AIAA
Aerospace Sciences Meeting and Exhibit, AIAA2007-450, Reno, Nevada, USA, 2007.
[11] R. A. ZIMBRICK AND J.L.COLEHOUR, “Investigation of Very High Bypass Ratio Engines for Subsonic Transports,” J. Propuls. Power, vol. 6, no. 4, pp. 490–496, 1989.
[12] N. J. PEACOCK AND J.H.R.SADLER, “Advanced propulsion systems for large subsonic transports,”
J. Propuls. Power, vol. 8, no. 3, pp. 703–708, 1992.
[13] B. MCKAY AND A.BARLOW, “The UltraFan Engine and Aircraft Based Thrust Reversing,” in
AIAA/SAE/ASME/ASEE 48th Joint Propulsion Conference and Exhibit, AIAA-2012-3919, Atlanta, Georgia, US, 2012.
[14] G. KRISHNAN,C.PERULLO, AND D.N.MAVRIS, “An Assessment of Relative Technology Benefits of a Variable Pitch Fan and Variable Area Nozzle,” in AIAA/SAE/ASME/ASEE 49th Joint Propulsion Conference and Exhibit, AIAA-2013-3604, San Jose, California, US, 2013.
[15] I. HALLIWELL and K. JUSTICE, “Fuel Burn Benefits of a Variable-Pitch Geared Fan Engine,” in
AIAA/SAE/ASME/ASEE 48th Joint Propulsion Conference and Exhibit, AIAA-2012-3912, Atlanta, Georgia, US, 2012.
[16] K. G. KYPRIANIDIS, “An Approach to Multi-Disciplinary Aero Engine Conceptual Design,” in
Proceedings of the 27th ISABE Conference, ISABE-2017-22661, Manchester, UK, 2017.
[17] A. SCHMITZ,M. AULICH, AND E. NICKE, “Optimized Surrogate Models in Two-Dimensional Compressor,” in Proceedings of ASME Turbo Expo 2011, GT2011-45086, Vancouver, Canada, 2011.
[18] K. G. KYPRIANIDIS, “On Gas Turbine Conceptual Design,” PhD Thesis, Cranfield University, 2019. [19] K. G. KYPRIANIDIS, “Multi-disciplinary conceptual design of future jet engine systems,” PhD
Thesis, Cranfield University, 2010.
[20] M.SCHNOES AND E.NICKE, “A Database of Optimal Airfoils for Axial Compressor Throughflow Design,” in Proceedings of the 27th ISABE Conference, ISABE-2017-21493, Manchester, UK, 2017.
[21] M.SCHNOES,C.VOSS, AND E.NICKE, “Design Optimization of a Mutli-stage Axial Compressor using Throughflow and a Database of Optimal Airfoils,” in Global Power and Propulsion Forum, GPPS2018-0009, Montreal, Canada, 2018.
[22] C. E. HUGHES, “Aerodynamic Performance of Scale-Model Turbofan Outlet Guide Vanes Designed for Low Noise,” in 40th AIAA Aerospace Sciences Meeting & Exhibit, AIAA2002-0374,
Reno, Nevada, USA, 2002.
[23] G. L. CONVERSE, “Extended Parametric Representation of Compressor Fans and Turbines; MDOFAN User’s Manual; Volume III,” NASA Technical Report, NASA-CR-174647, 1984. [24] J.KURZKE AND I.HALLIWELL, Propulsion and Power: An exploration of Gas Turbine Performance
Modelling. Springer, ISBN 978-3-319-75979-1, 2018. [25] J. KURZKE, “GasTurb11.” <http://www.gasturb.de>, 2007.
[26] J. KURZKE AND C. RIEGLER, “A new Compressor Map Scaling Procedure for Preliminary Conceptional Design of Gas Turbines,” in Proceedings of ASME Turbo Expo 2000, GT2000-0006, Munich, Germany, 2000.
[27] S.L.DIXON AND C.A.HALL, Fluid Mechanics and Thermodynamics of Turbomachinery, Seventh Ed. Elsevier Inc., 2014.
![Figure 1 Optimum BPR for a given choice of FPR (adopted from [11])](https://thumb-eu.123doks.com/thumbv2/5dokorg/4784811.128046/4.892.223.676.122.367/figure-optimum-bpr-given-choice-fpr-adopted.webp)