Sleep Noise
www.vipsimulation.se
ViP publication 2016-3
Authors
Eva Lahti, VCC
Anders Genell, VTI
Anna Anund, VTI
Carina Fors, VTI
ViP publication 2016-3
SleepNoise
Authors
Eva Lahti, VCC
Anders Genell, VTI
Anna Anund, VTI
Carina Fors, VTI
Cover picture: Thinkstock Reg. No., VTI: 2012/0443-26
ViP publication 2016-3
Preface
The SleepNoise (The effect of noise on driving performance and driver sleepiness) project was initiated by Volvo Car Corporation as a response to anecdotal evidence for increased driver drowsiness related to certain interior sound conditions. The project has been performed as a close collaboration between Volvo Car Corporation (VCC) and the Swedish National Road and Transport Research Institute (VTI) within the competence centre ViP Driving Simulation Centre
(www.vipsimulation.se). The project was financed by the ViP centre, i.e. by ViP partners and the Swedish Governmental Agency for Innovation Systems (VINNOVA).
The work has comprised road surface texture measurements, interior vehicle noise recordings, real-time sound modelling, and an extensive driving simulator experiment.
The results of the driving simulator experiment have been reported separately in the scientific paper The Effect of Low-Frequency Road Noise on Driver Sleepiness and Performance (Anund, Lahti, Fors, & Genell, PLoS ONE 10(4), 2015).
This report presents the work on the technical aspects of the project, resulting in a detailed sound model needed to study sound-related driver sleepiness in a simulator environment.
The sound model developed in this project is available for the ViP partners through the ViPForge1
software repository. While developed to investigate effects on driver sleepiness, the fidelity of the model makes it very suitable for general use where it contributes to increased realism.
Participants from VCC were Eva Lahti (project manager), David Lennström, Erik Joelsson, Richard Karlsson and Fredrik Bartholdsson.
Participants from VTI were Anders Genell, Anna Anund, Carina Fors and Beatrice Söderström. Gothenburg, December 2016
Eva Lahti
Quality review
Peer review was performed on 16 November 2016 by Mikael Ögren, Occupational and Environmental Medicine, University of Gothenburg. Anders Genell and Anna Anund have made alterations to the final manuscript of the report. The ViP Director Lena Nilsson examined and approved the report for publication on 22 December 2016.
ViP publication 2016-3
Table of contents
Executive summary ...9
1. Introduction ...11
1.1. Aim ...11
2. Road noise measurements ...12
2.1. Vehicles ...12
2.2. Equipment ...12
2.3. Recordings ...15
3. Road texture measurement ...17
4. Re-synthesizing the sound ...19
4.1. Modelling the road surface source noise ...20
4.2. Modelling the sound properties of the vehicle cabins ...22
5. Experiment ...27 6. Results ...28 7. Discussion ...29 8. Conclusions ...31 9. Delivery to ViP ...32 References ...33
Abbreviations
AR Autoregressive
dB Decibel
dB(A) A-weighted Decibel GNU/Octave Programming language KSS Karolinska Sleepiness Scale MPD Mean Profile Depth
NVH Noise, Vibrations and Harshness PI Performance Indicators
RST Road Surface Tester
Sim IV VTI Moving Base Driving Simulator IV VCC Volvo Car Corporation
ViP publication 2016-3
List of figures
Figure 1. Microphones at driver’s outer and inner ear, artificial head in front passenger’s seat,
and a four-channel microphone between the front seats’ neck rests (Vehicle 1 only) ... 13
Figure 2. Microphones at rear passengers’ outer ears ... 13
Figure 3. Microphones on the floor at outer foot, all four seating positions. ... 13
Figure 4. Tri-axial accelerometer on top of steering wheel rim ... 14
Figure 5. Tri-axial accelerometer on left front end of driver’s seat rack ... 14
Figure 6. Tri-axial accelerometers in all four wheel hubs ... 14
Figure 7. Recording sections at E6 outside Falkenberg. ... 15
Figure 8. Recordings of both vehicles at 110 km/h on coarse concrete and smooth asphalt. ... 16
Figure 9. The VTI Road Surface Tester, RST ... 17
Figure 10. Example of raw surface texture data, profile depth (mm), from RST measurements on 2 m long coarse (red) and smooth (black) texture road sections. A measurement drop-out can be seen just after the 1 m mark for the coarse texture measurement. ... 18
Figure 11. Road surface texture spectra in 1/3 octave bands for the coarse texture (red) and the smooth texture (black). ... 18
Figure 12. Simplified theoretical model of the road noise generation mechanism. ... 19
Figure 13. "Victor V Phonograph" by Norman Bruderhofer - Collection of John Lampert-Hopkins. Licensed under CC BY-SA 2.5. ... 20
Figure 14. Comparison between measured, coarse (red) and smooth (black) and modelled, coarse (green) and smooth (blue), road surface textures. ... 21
Figure 15. Result of inverse-filtering the measured smooth road surface texture with the corresponding model. ... 22
Figure 16. Impulse responses for the two AR-modelled transfer functions (vehicles studied), mid-sized hatchback (red) and large wagon (black). ... 23
Figure 17. Comparison between measured and modelled sound without the influence of the sound reproduction environment of the simulator. ... 24
Figure 18. Comparison between measured and modelled sound including the influence of the sound reproduction environment of the simulator. ... 25
Figure 19. Sound spectra differences between vehicles in 1/3 octave bands. Measured vehicles in white and modelled vehicles in black. ... 25
Figure 20. Infrasonic spectra of measured vehicles. Large wagon in red and mid-sized hatchback in black. ... 26
List of tables
Table 1. A-weighted and C-weighted sound pressure levels of measured and
ViP publication 2016-3 9
SleepNoise
by Eva Lahti1, Anders Genell2, Anna Anund2 and Carina Fors2
1 Volvo Car Corporation (VCC), 2 Swedish National Road and Transport Research Institute (VTI)
Executive summary
It is well known that sleepiness is an important contributor to crashes. The drivers are influenced by circadian low, hours slept or being awake. There is also reason to believe that variations in interior road noise may be a contributing factor. Up to now the road noise models in simulators are not very mature and not validated.
The aim of the technical part of the SleepNoise project was to develop the road noise model for the ViP simulation infrastructure, including individual vehicle types driving on individual road types. The goal was a sound model, close enough to the original real world setting as to be approved by vehicle noise experts. The resulting modelled interior sound spectrum should not deviate more than a few decibels from the corresponding recorded sound.
The resulting sound model proved to work very well for the intended use, facilitating detailed investigations of the influence of sound on driver behaviour in addition to providing realism and presence in the simulated environment. It allows changing the vehicle cabin sound model
independently of the influence of road texture. Thus, more combinations of vehicle cabins and road textures can easily be investigated if needed. The realism of the road noise model was validated by NVH experts from Volvo Car Corporation well acquainted with the modelled vehicles.
A driving simulator experiment was carried out and found to support the hypothesis that high levels of low-frequency road noise in the car contribute to increased driver sleepiness and impaired
performance during night-time. The unexpected carry-over effect suggests that the onset of conditions such as those found in realistic road noise has a lasting effect, which cannot be neutralized by a short break while still seated in the vehicle. The carry-over effect might have been neutralized by allowing participants to exit the simulator, e.g. to stretch their legs and have a drink of water or so, which might also imply that countermeasures against driver fatigue need to have a proper impact to counter such lasting effects. These issues require further research.
ViP publication 2016-3 11
1.
Introduction
The use cases for a technically complex system such as a driving simulator are typically continuously changing, as the problems they help solve are changing. This calls for systems that allow for
development on an as-needed basis. In the current use case, the initial research question arose from informal self-reported feelings of fatigue and tiredness when driving a car on particularly worn roads and a notion that certain cars make the driver sleepier than others. These effects were attributed to the variations in interior road noise, and investigating if increased levels of road noise would reduce wakefulness in drivers made for a novel simulator use case.
The fact that sleepiness in drivers is a contributing factor in accidents is well known today. However, what role external factors such as type of road, sound/noise, vibrations, etc. have on the ability to stay awake is rather unknown. Previous studies on noise-related driver fatigue have mainly concerned heavy vehicles where infrasound and low-frequency noise have been shown to be related to increased fatigue and also to increased stress and impaired performance in drivers, in real traffic situations (Löfstedt et al., 1988) as well as in simulator settings (Söderberg et al., 1988; Morén et al., 1989) and in laboratories (Landström, 1987). While the sound level and frequency distribution inside a car cabin are different from those inside a lorry cabin, the interior sound is still dominated by its low-frequency content since the efficiency of the various abatement measures employed declines with decreasing frequency. It was thus hypothesised that increased low-frequency road noise in the car cabin would increase drowsiness also in car drivers.
The SleepNoise project could be regarded as divided into two parts. One part concerned the design of the simulator experiment required to investigate the effect of the interior sound environment on driver behaviour, i.e. on external measures such as eye movement and blink duration as well as driving performance related to sleepiness, and particularly on self-reported feeling of sleepiness. The aim of the experimental design was to investigate if the interior sound would influence driver sleepiness and performance. The simulator experiment is discussed thoroughly in the research article “The effect of low-frequency road noise on driver sleepiness and performance” (Anund et al., 2015), which was the main outcome of that part of the SleepNoise project.
This technical report describes the other part of the SleepNoise project concerning the technical requirements that needed to be fulfilled to obtain useful results from the experimental design mentioned above. The simulator development needed to test the hypothesis, that increased low-frequency road noise in a car would increase drowsiness in the driver, was identified as the need for a very realistic road noise model. The model to be developed should allow for variations in frequency content and level due to variations in road conditions as well as due to the sound attenuating properties of different vehicles. These requirements could be summarized in the following aim.
1.1.
Aim
The aim of the technical part of the SleepNoise project was to develop a road noise model for the ViP simulation infrastructure of such a degree that the interior sound environment of individual vehicle types driven on individual road types could be re-created close enough to the original real world setting as to be approved by vehicle noise experts. The resulting modelled interior sound spectrum should not deviate more than a few decibels from the corresponding recorded sound.
2.
Road noise measurements
Many factors are involved in the generation and propagation of road noise. In the SleepNoise project the focus was on two important factors, namely the road texture and the vehicle cabin transfer path. It was decided to perform an experiment in one of VTI’s advanced moving base driving simulators, Sim IV2. In order to do so, realistic road noise needed to be re-created inside the simulator vehicle cabin,
and specifically the difference between different road textures and vehicle cabins needed to be as close to real conditions as possible for the experiment to be valid. To that end, measurements of road surface texture were performed as well as recordings of interior vehicle sound while driving on those same road textures. The measurements were then used as the basis for a road noise model re-creating realistic road noise inside the driving simulator in real-time.
2.1.
Vehicles
The interior road noise was recorded in two different vehicles: a mid-sized premium wagon and a compact premium hatchback. Vehicle 1, the mid-sized premium wagon, was equipped with Pirelli Scorpion Zero 235/50 R18 tyres with a tyre pressure of 2.3 bar. Vehicle 2, the compact premium hatchback, had Pirelli Cinturato P7 225/45 R17 tyres with front tyre pressure of 2.55 bar and rear tyre pressure of 2.7 bar.
2.2.
Equipment
For the sound (noise) recordings, SQ lab III from Head Acoustics GmbH3 was used together with 8
microphones type 41894 from Brüel & Kjær; two at the driver’s inner and outer ear (Figure 1), two at
the rear passengers’ outer ears (Figure 2), and four at the outer foot for all four seats (Figure 3). In the front passenger seat an artificial head, HMS III from Head Acoustics, was placed (Figure 1). In Vehicle 1, the four-channel sound field TetraMic microphone5 from Core Sound was used for
reference (Figure 1).
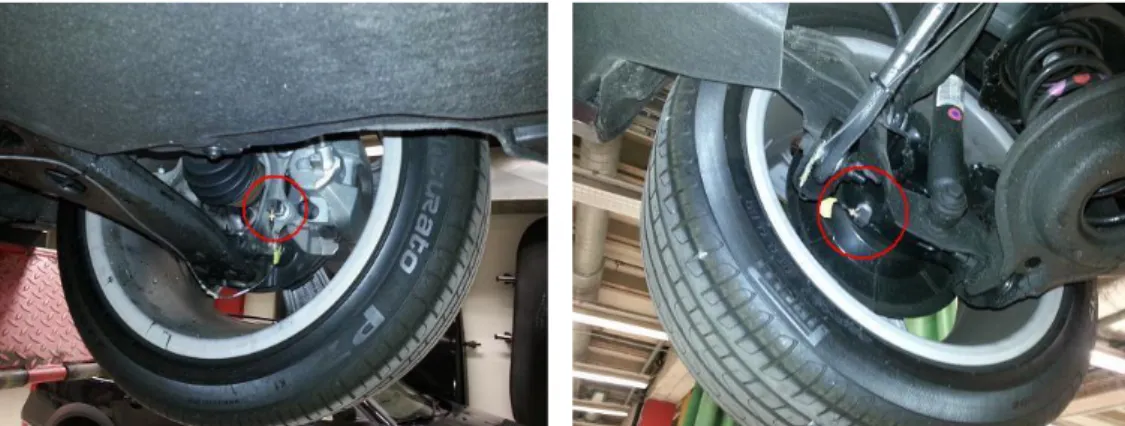
Vibrations were also recorded. On the steering wheel and seat rail, two tri-axial accelerometers type 4524B6 from Brüel & Kjær were used (Figure 4 and Figure 5), and in all four wheel hubs tri-axial
accelerometers type 3093 from Dytran7 were used (Figure 6).
The vehicle speed was registered using VBOX8 (RaceLogic, Buckingham, U.K.).
The GPS coordinates were logged separately using Garmin pulse watch mod Forerunner 305 for Vehicle 1 and Endomondo on iPhone 4S for Vehicle 2.
2 https://www.vti.se/en/research-areas/vtis-driving-simulators/ 3 http://www.head-acoustics.de/ 4 https://www.bksv.com/en/products/transducers/acoustic/microphones/microphone-cartridges/4189 5 http://www.core-sound.com/TetraMic/1.php 6 https://www.bksv.com/en/products/transducers/vibration/Vibration-transducers/accelerometers/4524-B 7 http://www.dytran.com/Accelerometers-C84.aspx?s=OrderBy ASC&c=84&ps=12&p=0 8 https://www.vboxautomotive.co.uk/index.php/en/
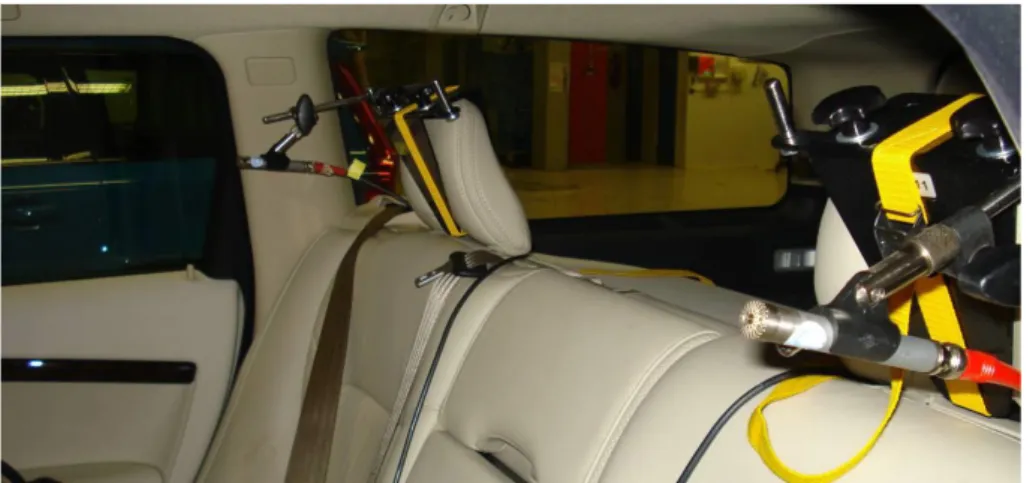
ViP publication 2016-3 13 Figure 1. Microphones at driver’s outer and inner ear, artificial head in front passenger’s seat, and a four-channel microphone between the front seats’ neck rests (Vehicle 1 only) (Photo: David
Lennström).
Figure 2. Microphones at rear passengers’ outer ears (Photo: David Lennström).
Figure 4. Tri-axial accelerometer on top of steering wheel rim (Photo: David Lennström).
Figure 5. Tri-axial accelerometer on left front end of driver’s seat rack (Photo: David Lennström).
ViP publication 2016-3 15
2.3.
Recordings
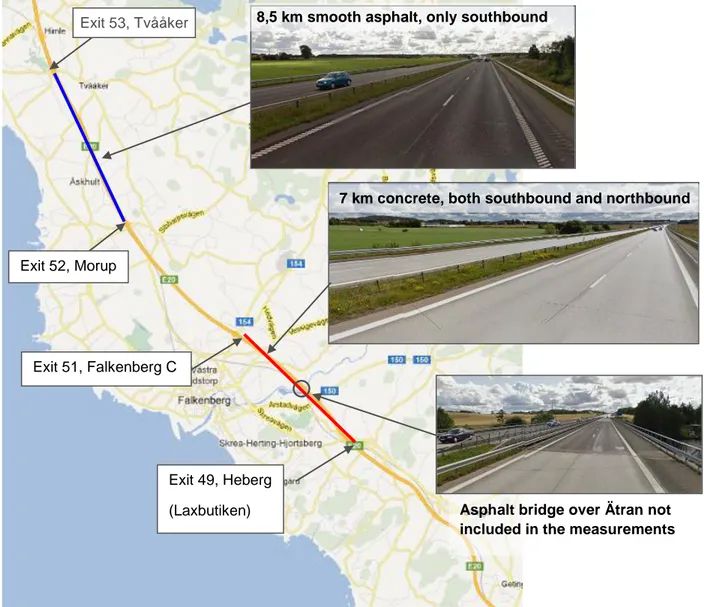
Both vehicles were recorded on very rough (concrete) and smooth (asphalt) road sections of E6 outside Falkenberg (see Figure 7). The recordings were done at constant speed driving at 80, 90, 100, 110 and 120 km/h and at speed sweep between 80 and 120 km/h. The recordings were performed on 23 August, 3 September and 10 September 2012.
Figure 7. Recording sections at E6 outside Falkenberg. Exit 49, Heberg
(Laxbutiken) Exit 52, Morup
Exit 53, Tvååker
Exit 51, Falkenberg C
7 km concrete, both southbound and northbound
Asphalt bridge over Ätran not included in the measurements 8,5 km smooth asphalt, only southbound
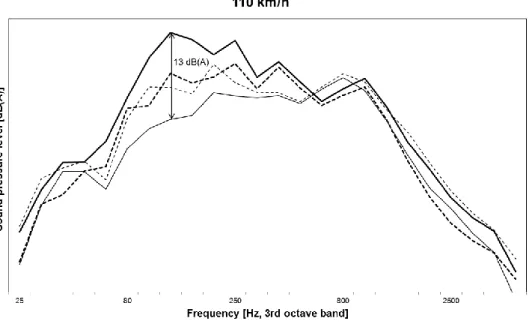
Figure 8 shows an example of the A-weighted third octave spectra from the recordings at 110 km/h. Since the purpose of the simulator experiment was to evaluate the effect of road noise on sleepiness, we wanted to use the road noise levels in a “quiet” and a “loud” vehicle/road combination while still making sure that these noise levels and spectra were realistic. The difference between the
combinations Vehicle 1 on smooth asphalt and Vehicle 2 on coarse concrete is approximately 5 dB overall noise level, with a maximum difference of 13 dB in the third octave band at 125 Hz. These two combinations (sound settings) of vehicle and road were used in the following work to re-synthesize the road noise.
ViP publication 2016-3 17
3.
Road texture measurement
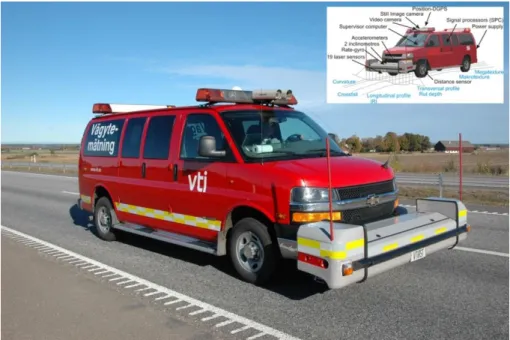
In order to understand the influence of variations in road texture on the interior noise, the road surface texture was measured using the VTI Road Surface Tester9 (RST). The RST (Figure 9) is equipped with
a wheel mounted distance sensor, differential GPS, two inclinometers, a rate gyro and several
accelerometers in addition to the 19 laser sensors measuring the road surface texture. This allows very exact positioning of the measurement data as well as accounting for long range variations in road relief in comparison to long wavelength road texture variations.
Figure 9. The VTI Road Surface Tester, RST (Photo: Leif Sjögren).
Measurements from two different road partitions were used in the current project, one concrete road with a particularly coarse surface and one road with the most common pavement in Sweden (ABS16) which represents a smoother surface texture. The resulting measurement data consists of a surface profile depth value every millimeter along the measured stretch of road. Surface texture data from one 2 m length of each of the two surface types, coarse (red) and smooth (black), is shown in Figure 10. The quality of the data depends among other things on the ability of the surface to reflect the laser beams. When the reflectivity is low drop-outs in the data collection occur, which can be seen as the vertical lines in Figure 10.
As the current project focused on effects from sound, the raw surface texture data was high-pass filtered to remove wavelengths that correspond more to vehicle dynamics than to noise generation. A limit of 2 m was chosen, which corresponds to a fundamental frequency of about 15 Hz when driving at 110 km/h. The difference between the two types of road surface, in a sound generating context, is more clearly shown by presenting average logarithmic energy levels in one-third octave wavelength bands, since the human hearing is logarithmic both regarding level and frequency.
Figure 10. Example of raw surface texture data, profile depth (mm), from RST measurements on 2 m long coarse (red) and smooth (black) texture road sections. A measurement drop-out can be seen just after the 1 m mark for the coarse texture measurement.
In Figure 11 the coarse concrete road surface (red) can be seen to have higher amplitudes for wavelengths between about 1000 mm and 60 mm than the smoother pavement surface (black). This difference would mean increased sound levels for frequencies between about 30 Hz and 500 Hz when driving at 110 km/h, i.e. increased low-frequency noise.
Figure 11. Road surface texture spectra in 1/3 octave bands for the coarse texture (red) and the smooth texture (black).
ViP publication 2016-3 19
4.
Re-synthesizing the sound
To perform studies of effects of noise on driver sleepiness in a safe environment, the decision was made to perform the experiment in the VTI Moving Base Driving Simulator IV (Sim IV). To that end, the sound experienced when driving the two vehicles of interest on the two different types of road had to be re-created as realistically as possible inside the simulator. Sound in Sim IV is generated in real-time, as opposed to using playback of previously recorded sound. The sound recordings obtained within this project were hence not to be used directly, but as a basis for the sound synthesis.
The sound synthesis was divided into two parts, the sound generated through contact between a wheel and the road surface and the transfer function describing sound propagation into the interior of the car cabin. As there were two road surface types and two vehicle types there were in all four conditions to synthesize, although only two of these were used in the final simulator experiment.
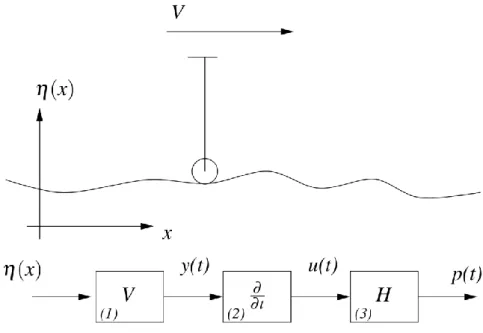
In order to have sound generated in real-time the models involved must not be too complex, or the calculation time will exceed the time allowed before next value must be calculated. A number of simplifications were made to meet this demand. Most notably, that the wheel is always in contact with the road and that the vertical movement of the wheel perfectly mimics the profile of the road texture. Another assumption was that all sound propagation, both air borne and structure borne, from the wheel to the ear of the driver can be described by one static transfer function. Figure 12 shows a simplified theoretical model of the road noise generation from a wheel rolling on an uneven surface. The wheel is rolling at velocity V in positive x direction over a surface with texture height η(x), resulting in a time dependent vertical position y(t) of the wheel. The variations in height as the wheel rolls can through a time derivation be described as a vertical velocity u(t). Through the transfer function H the vertical velocity is converted to sound pressure inside the cabin. The two parts of the sound synthesis are hence represented by the vertical velocity u(t) and the transfer function H.
Figure 12. Simplified theoretical model of the road noise generation mechanism.
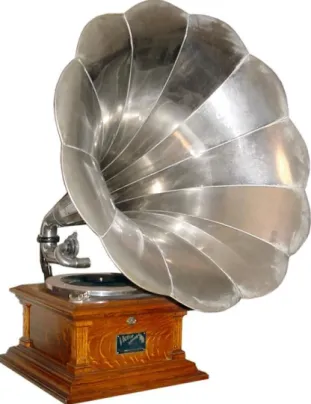
The physical interpretation of this simple model is that all vertical displacement of the road surface texture is directly translated into sound pressure due to vertical motion of the wheel as a result of the vehicle speed. One way to regard this simplified model is as a large-scale phonograph (Figure 13), where the road is represented by the record, the wheel is the pick-up stylus (though the stylus motion as it follows the groove on a phonograph record is side-to-side rather than the up-down motion of the
wheel), and the suspension and cabin correspond to the horn speaker transforming the tiny vibrations of the stylus to audible sound.
Figure 13. "Victor V Phonograph" by Norman Bruderhofer - Collection of John Lampert-Hopkins. Licensed under CC BY-SA 2.510.
4.1.
Modelling the road surface source noise
Using the phonograph analogy, it is as if a model of the phonograph was to be created from a
photograph of the record and recordings of what comes out of the horn at different playing speeds (in the early times the records were designed for speeds anywhere from 60 to 130 revolutions per minute, so the analogy is perhaps not so bad). One part would then be to model the record as a sound source, which would depend on playing speed. The other part would be to model the pick-up and horn. That would affect the sound from the source independently of playing speed, as a record does not make any sound by itself. Not until a stylus follows the groove in a turning record is there sound.
If the record is stopped, the sound stops, even if the stylus is still in contact with the record. If a record is turning too fast, the sound will sound too bright, i.e. the pitch is too high. That is because the groove of the record is passing too fast beneath the stylus, so that the side-to-side motion is too fast, which means a too high pitch. A record would likely contain a complex signal like an orchestrated melody. Every little turn in the groove would need to be modelled, which would be very difficult if not
impossible. The road surface is more stochastic in nature, and could be reasonably well modelled by a simple modification of a completely random signal, e.g. so-called white noise, where the sound character does not vary much over time.
ViP publication 2016-3 21 Analysis of the smooth road texture measurements showed an even distribution of wavelengths from 1 meter down to 14.5 millimeters. Shorter wavelengths were found to be gradually less prominent. Thus, a suitable model of the smooth road surface texture signal would be white noise filtered with a first order low-pass filter representing the diminishing occurrence of wavelengths shorter than the size of the aggregate stones in the top layer. The smooth road surface signal is represented in the spatial (wavenumber) domain. A filter is generally thought of as working in the time domain, but in essence, filtering is simply a solution to a linear equation and can be applied to any dataset.
To get a physical understanding of the conversion between the domains it might be useful to again apply the phonograph analogy, where the wavenumber domain and the time domain are only separated by the speed with which the record is turning. If we measure how the record groove ripples back and forth at every millimeter along the spiral track, it can be converted into the time domain by calculating how many millimeters the pick-up stylus passes every second. That number will then correspond to the audio sampling frequency, and the wavenumber domain cut-off wavelength will accordingly be represented by a time domain cut-off frequency corresponding to how fast the stylus moves back and forth as the record turns. Analogously, for the vehicle at a velocity of 110 km/h, which is 33333 mm/s, the sampling frequency would then be 33333 Hz, and a cut-off wavelength of 14.5 mm, where the amplitude of the wavelengths starts to fall off, would correspond to a cut-off frequency of 33333/14.5 = 2299 Hz. By converting the filter parameter in such a way, the influence of the road texture
spectrum on the recorded sound could then be estimated based on the velocity of the vehicle at the time of the recording.
For the coarse road texture two combined instances of the same model were used, one accounting for the increased amplitudes for wavelengths above 220 mm and the other accounting for the longer cut-off wavelength of 31 mm as compared to the 14.5 mm for the smooth road texture. Figure 14 shows a comparison between the measured road texture and the resulting model, based on white noise and a first-order low-pass filter, for both the smooth and the coarse road surface texture types.
Figure 14. Comparison between measured, coarse (red) and smooth (black) and modelled, coarse (green) and smooth (blue), road surface textures.
4.2.
Modelling the sound properties of the vehicle cabins
The transfer function which constitutes the second part of the sound synthesis is not time dependent, but rather works like a static filter applied to the time varying road texture model. In the phonograph analogy that would correspond to how different tones are amplified or attenuated by the pick-up and the horn loudspeaker. Being independent of time allows for greater detail and complexity as it would only be calculated once for each vehicle to be simulated. Since road noise is stochastic, and since the transfer function is time invariant, an autoregressive (AR) model was deemed well suited for
estimating the transfer function. An AR model basically estimates future values from a linear combination of previous values. In this case an implementation of Burg’s method (Burg, 1968) in GNU/Octave (an open source Matlab equivalent) was used. It estimates weights of the linear combination needed to produce the signal of interest from white noise. For the AR estimation to be accurate, the difference between the road texture signal and a perfectly random white noise signal needed to be handled, so that the AR estimation would handle just the vehicle cabin transfer function and not the road surface texture signal. The recordings of interior cabin sound of course contain both parts, so the influence of the road surface texture had to be removed. Since a model of the road surface texture was just created, the simplest way was to assume that this model was a perfect representation of the road surface texture signal, and subtract that signal from the recorded sound. For a more complex road texture model this would likely be highly unstable and produce useless results. But as the model of the smooth road surface texture signal was intentionally kept simple by choosing a single first-order Butterworth low-pass filter, the stability was not an issue in this case.
The coarse texture model was not used as a basis for the AR estimation as inverse filtering would not have been stable for the two combined low-pass filters. Applying the road surface texture model, first order low-pass filter inversed to the recorded sound resulted in a signal that was deemed suitable as basis for the AR model. Applying that same inversed filter to the measured road surface texture signal gives an indication of how well removing the influence of the road texture spectrum was achieved. The ideal result would be all wavelengths having equal amplitudes. As can be seen in Figure 15 the result is not a perfect straight line, but all amplitudes fall within a range of a few decibels.
Figure 15. Result of inverse-filtering the measured smooth road surface texture with the corresponding model.
ViP publication 2016-3 23 Employing AR estimation is very similar to applying a filter, with the main difference that for filtering all weights of the linear combination that makes up the resulting signal are known, and the resulting signal is simply the result of performing the multiplications and summations involved. For the AR estimation, the weights are what should be determined from input and output signals, which requires a least-squares fit to a given data set. To be able to capture relatively subtle differences between the transfer functions of the two vehicle cabins of interest the number of weights, i.e. the order of the AR model, needs to be sufficiently large. A physical interpretation of this requirement can be that the model needs to have enough time to let even the lowest frequencies complete a number of cycles in order to investigate the amplitude correctly. After some trial and error the AR order was set to 32768. The sound synthesis software used to generate sound in real-time in the VTI simulators is an open source software called Csound11, a sound and music computing system originally developed in 1985 at
MIT Media Lab.
While the AR weights, or coefficients, could be applied in GNU/Octave by simply using them as arguments to a built-in filter function, Csound does the same thing using convolution in real-time. Convolution is basically what the filter function does to a time signal. It applies the AR model
coefficients to one data point of the sound signal at a time and sums the result. For this to function, the coefficients need to be arranged in an impulse response with the same properties as the input sound to the convolved. An impulse response is the result of applying the AR model to an impulse, i.e. a signal whose first data point has the value one and the rest has the value zero. One such impulse response for each of the two vehicles of interest were created using GNU/Octave and imported into Csound (cf. Figure 16).
Figure 16. Impulse responses for the two AR-modelled transfer functions (vehicles studied), mid-sized hatchback (red) and large wagon (black).
In order for the transfer function to be correctly estimated, the speed of the recorded vehicle needs to be sufficiently low to not induce high levels of aerodynamic noise. On the other hand, the speed needs to be sufficiently high to allow for the irregularities of the coarse texture to induce sound in the audible range. Interior sound was recorded at speeds between 80 km/h and 120 km/h and an impulse response
was developed for each recording. Each impulse response was then used to synthesize the interior sound at different virtual vehicle speeds. The impulse response that gave the best fit to the real recordings was the one chosen for the simulator experiment. For the large wagon that meant a “model speed” of 90 km/h and for the mid-sized hatchback it corresponded to a “model speed” of 100 km/h. A comparison between measured sound and the result of the sound generated by Csound can be seen in Figure 17.
When reproducing the sound by using the sound system in Sim IV, there is a slightly larger deviation between measured and modelled sound (see Figure 18). Some reasons for this deviation are that the car cabin in the simulator is half the size of the cars used for measurements and hence differ in properties such as resonance behaviour, that the microphones were not placed at the exact same positions in the cars used for measurements and in the simulator cabin, and that the sound system itself does not have a perfectly flat frequency response.
Figure 17. Comparison between measured and modelled sound without the influence of the sound reproduction environment of the simulator.
ViP publication 2016-3 25 Figure 18. Comparison between measured and modelled sound including the influence of the sound reproduction environment of the simulator.
The difference between the two driving conditions used in the simulator experiment was still very similar to the difference between the corresponding recorded vehicles (Figure 19), and resulting sound inside the simulator cabin was evaluated by a panel of experts from the NVH department of Volvo Car Corporation who agreed upon the validity of the sound.
Figure 19. Sound spectra differences between vehicles in 1/3 octave bands. Measured vehicles in white and modelled vehicles in black.
The absolute levels of the sound were also similar in the simulator cabin and in the corresponding recorded vehicles. While A-weighted sound pressure levels are known to be less suitable for sound
dominated by low frequencies, the difference between C-weighted levels and A-weighted levels are also similar between modelled and measured sound, showing similar low-frequency content emphasis (cf. Table 1).
Table 1. A-weighted and C-weighted sound pressure levels of measured and modelled interior sound.
dB(A) dB(C) Diff A Diff C-A Measured Large wagon 79.9 94.4 4.9 14.5 Mid-sized hatchback 84.8 99.9 15.1 Modelled Large wagon 82.6 97.7 4.1 15.1 Mid-sized hatchback 86.7 102.9 16.2
While the focus in the current project was on low-frequency sound generated by a course road texture, previous studies of noise-induced driver fatigue have often focused on infrasonic frequencies, mainly in heavy vehicles. Regarding the infrasonic content of the interior sound recordings used in the current study, no major differences between the vehicles were found, except for a slight level difference around 8 Hz (cf. Figure 20). This difference was however not accounted for inside the simulator cabin, where all frequencies below 12 Hz have been removed. Hence, all results found in this study adhere to sounds in the audible frequency range.
Figure 20. Infrasonic spectra of measured vehicles. Large wagon in red and mid-sized hatchback in black.
ViP publication 2016-3 27
5.
Experiment
The sleepiness experiment (Anund et al., 2015; Lahti et al., 2014) was performed in the VTI Moving Base Driving Simulator IV12 (Figure 21). The simulator has a Volvo XC60 vehicle cabin with three
LCD displays for side and rear view mirrors mounted on a platform with a visualization system consisting of a curved screen and nine projectors creating a 210 degrees’ forward field of view. The platform is mounted on a motion system permitting significant linear movement along both x and y axes as well as pitch and roll rotations.
Figure 21. VTI Moving Base Driving Simulator IV, Sim IV (Photo: Hejdlösa Bilder).
Two sound settings were studied in the experiment, the “quiet” case (large wagon on relatively smooth asphalt road surface) and the “loud” case (mid-sized hatchback on relatively coarse concrete road surface). The scenario in the experiment was a straight highway with a speed limit of 110 km/h, in daylight conditions with a small amount of fog. There was no traffic in the same lane as the own vehicle, but some oncoming vehicles to make the scenario more realistic.
A random sample of 20 test participants (30–50 years old) were recruited, 10 males and 10 females, with self-reported normal hearing. Before arrival, they were asked to avoid a number of confounding issues such as undue naps and excessive intake of coffee. Each participant drove twice, one session during daytime/evening (alert) and one session during night-time (sleepy). The order of sessions was balanced between participants. Each session consisted of two f 35-minute drives (quiet case and loud case), divided by a short intermission where the participants answered a questionnaire while still seated in the car. The order of drives was balanced between participants, but the same for daytime and night-time conditions.
The simulator data acquisition system was used to sample speed and lateral position as measures of driving performance. Self-reported sleepiness (Karolinska Sleepiness Scale, KSS) and blink duration calculated from EOG signal measured by a Vitaport system were used as sleepiness indicators. In total seven performance indicators (PI) were used for analyse driving performance and sleepiness level: KSS (self-reported verbally every 5 minutes), blink duration (s), fraction of blinks longer than 0.15 s, mean speed (km/h), average and variability of lateral position (m), and average number of line crossings to the left or to the right per km driven. The data was analysed using traditional mixed model ANOVAs.
6.
Results
When analysing the results, no main effect of the different sound settings (test cases) could be found at first. But the time of day (day or night) had an effect on all variables, as expected since drivers are likely to be sleepier during night-time conditions.
Upon further analysis, and considering that a main effect was found when comparing the first and second 35-minute drives across all drive cases, an unexpected carry-over effect was identified. The effect may be interpreted as; if one starts to drive with high levels of low-frequency road noise in the car the influence will be present even if there is a change in low-frequency noise. The effect was present in sleepiness measures such as KSS ratings as well as in performance measures such as mean vehicle speed. For both day and night conditions, the “loud” test case rated higher on the KSS scale than the “quiet” test case when driven in the first part of the driving session, but in the second part the situation was the opposite. Considering that the participants were presented with one test case in the first part and the other test case in the second part, this would mean that participants were responding as if the first case was continued after the short intermission. Those who were first presented with the loud case responded as if the second part was the loud case as well, and vice versa.
Since the results of the full data set showed the presence of a carry-over effect an additional analysis of the influence of low-frequency road noise on sleepiness was done. Only the first 35 minutes driven during both day and night time was taken into account to investigate the difference between the sound settings (quiet and loud) without the influence of a possible carry-over effect. The results of the reduced data set did not show any significant main effects of Sound, neither on the sleepiness
indicators nor on the driving related indicators, except for Speed. The drivers drove faster in the quiet case than in the loud case during daytime (110 km/h in quiet case vs 106 km/h in loud case) as well as during night-time (109 km/h in quiet case vs 106 km/h in loud case).
There were significant interactions between Condition (day/night) and Sound (quiet/loud) for Blink Duration (F = 5.01; p = 0.03) and for Lane Crossings (F = 6.35; p = 0.01) indicating that the effect of sound varies depending on daytime or night-time driving. On average, blink duration during daytime was 0.131 s (sd 0.01) for the loud case compared to 0.125 s (sd 0.01) for the quiet case. During night-time the average blink duration was 0.145 s (sd 0.01) for the quiet case compared to 0.139 s (sd 0.01) for the loud case. However, even if these differences are significant, the absolute differences are small and based on contributions from few people.
On average, the quiet case generated more lane crossings (average per km driven) during daytime driving than the loud case (0.058; sd 0.05 vs. 0.030; sd 0.04). The opposite applied during night-time, with more lane crossings in the loud case (0.165; sd 0.04) than in the quiet case (0.096; 0.04). It should be kept in mind that the number of lane departures remained small.
ViP publication 2016-3 29
7.
Discussion
Sound, hearing and audio can be troublesome to handle, particularly in a complex environment such as a car – real or simulated. In a situation where sound is the critical property under investigation, it is even more troubling as one needs to know what a listener hears, and if that is what is intended to be heard. In this project we aimed for a sound environment that is “good enough”. Such a term might occasionally be used in a derogatory manner, but in the case of such a complex situation as sound in a vehicle simulator, “good enough” for listening-related experiments means that the sound is so well controlled that it is possible to draw statistically significant conclusions from the experiment results. In the SleepNoise experiment the simulated sound environment inside the simulator was significantly improved. Previously the simulator sound was “the sound of a car on a road”, whereas after
implementing the SleepNoise road noise model the sound represents “a particular car on a particular road”. As the model is based on measurements of road surface texture and corresponding interior vehicle sound recording, it allows further vehicle and road models to be added with relative ease. One important simplification of the model, compared to real world conditions, is the omission of a specific tyre model. In the current implementation, the tyre model is included in the time independent vehicle cabin model. There exist a number of detailed mathematical models of car tyres that depend on input parameters such as tyre dimensions, internal air pressure, Young’s modulus etc., but adopting these for use in a driving simulator is very complicated. If a tyre model should be required for future studies, it could instead be developed in a similar manner as the current road noise model. A specific car could be driven across a specific road surface using a variety of different tyres, and the resulting interior sound could be recorded. The differences between sound spectra could then be attributed to tyre size, pressure etc., and a simplified model could be developed.
The driving experiment showed that the difference between the two sound conditions (test cases) influenced the drivers. However, since a full factorial experiment design in a driving simulator study is very time consuming, and takes a lot of effort both from participants and experiment supervisors, there were only two conditions included in the experiment. That means that there was a different
combination of vehicle type and road surface type in each condition, and it is impossible to discern if the vehicle cabin or the road surface was most important for the results. The effect size was not very large, so dividing the test conditions further might result in difficulty to obtain statistically significant results unless using a large population. The experiment was mainly testing driver sleepiness, however, and there might be other effects on driving performance from different characters of noise. The scalability of the VTI simulator infrastructure would allow for implementing a quick succession of iterative experiments in a desktop simulator environment for testing finer degrees of sound variation against different behavioural mechanisms, and then continue with experiments in a full-scale moving base simulator for the most promising combinations. The sound system is also scalable, allowing for very controlled sound through headphones to the surround sound system in the VTI moving base driving simulators.
VTI has a relatively large database of road texture measurements covering many different types of roads in many different conditions. One coincidental finding in the SleepNoise study was that common road texture metrics, used to predict community noise from road traffic, did not strongly correlate to the interior sound in the vehicle. Thus, there might be reasons to investigate
complementary measures that are important for interior sound. With the ability to simulate the resulting interior sound environment it would be possible to develop recommendations for road maintenance based on driver performance related measures.
The sound environment in the VTI simulator does not include a very detailed wind noise model. It is difficult to isolate contributions from wind and road to the interior sound, which means that the simulated road noise to some degree contains wind noise. This also means that when inferring to real world conditions there is some uncertainty about which source is dominating the effects on the driver.
Similarly, there is a lack of a detailed model of road-related vibrations. The motion system can handle the range of motion that concerns the entire vehicle and thus the whole body of the driver. But higher frequency vibrations, often referred to as harshness, are more localized to e.g. floor, seat and/or steering wheel and will affect the driver differently, and will also have an impact on how the driver reacts to the sound environment (see e.g. Genell & Västfjäll, 2007).
ViP publication 2016-3 31
8.
Conclusions
The resulting sound model proved to work very well for the intended use, facilitating detailed investigations of the influence of sound on driver behaviour in addition to providing realism and presence in the simulated environment. It allows for changing vehicle cabin sound model independently of the influence of road texture, so more combinations of vehicle cabins and road textures can easily be investigated if needed.
The realism of the road noise model was validated by NVH experts from Volvo Car Corporation well acquainted with the modelled vehicles.
The simulator experiment was found to support the hypothesis that high levels of low-frequency road noise in the car contribute to increased driver sleepiness and impaired performance during night-time. The unexpected carry-over effect suggests that the onset of sound conditions such as those found in realistic road noise has a lasting effect, which cannot be neutralized by a short break while still seated in the vehicle. The carry-over effect might have been neutralized by allowing participants to exit the simulator, e.g. to stretch their legs and have a drink of water, which might also imply that
countermeasures against driver fatigue need to have a proper impact to counter such lasting effects. These are issues that require further research.
9.
Delivery to ViP
The deliveries to ViP from the SleepNoise project are both methodological and technical.
The methodological part is a demonstration of the feasibility to use the ViP simulation environment for auditory-related experiment designs. Previously the sound environment has mainly focused on increasing experienced realism and immersion, but the results from the SleepNoise experiment show that it is also possible to treat the simulator sound environment as a dependent variable.
The technical part consists of a vastly improved road noise model, where the road surface can be modelled separately from the vehicle cabin model. The delivered road surface model is detailed and deviates very little from real world road surface texture measurements. The delivered vehicle cabin models are also highly detailed due to the high-resolution auto-regressive method used, resulting in two distinctly different passenger vehicle cabins. One of these cabins together with the smooth road surface model is now the default setting in the simulator sound environment, which has increased the overall level of realism for future experiments.
ViP publication 2016-3 33
References
Anund, A., Lahti, E., Fors, C., & Genell, A. (2015). The Effect of Low-Frequency Road Noise on Driver Sleepiness and Performance. PLoS ONE, 10(4): e0123835.
doi:10.1371/journal.pone.0123835.
Burg, J. P. (1968). A new analysis technique for time series data, NATO advanced study. Enschede, the Netherlands: Institute on Signal Processing with Emphasis on Underwater Acoustics, August 12-23, 1968.
Genell, A., & Västfjäll, D. (2007). Vibrations can have both negative and positive effects on the perception of sound. International Journal of Vehicle Noise and Vibration, 3 (2), pp. 172-184. Lahti, E., Anund, A., & Genell, A. (2014). SleepNoise. A simulator based study of the effects of noise
on driver drowsiness. In Proceedings of Driving Simulation Conference (DSC Europe 2014), Paris, France, 4-5 September, 2014, pp. 21.1-21.4.
Landström, U. (1987). Laboratory and field studies on infrasound and its effects on humans. J Low Freq Noise Vib, 6, pp. 29-33.
Löfstedt, P., Lindblom-Häggqvist, S., & Landström, U. (1988). Studier av buller, vakenhet och risker under lastbilskörning. Undersökningsrapport 1988:15. Umeå, Sweden: Arbetsmiljöinstitutet (in Swedish).
Morén, B., Landström, U., Nilsson, L., Sandberg, U., & Törnros, J. (1989). Inverkan av infraljud, buller och värme på prestation och vakenhet under fordonskörning: En simulatorstudie. VTI rapport 340. Linköping, Sweden: Swedish National Road and Transport Research Institute (VTI) (in Swedish)..
Söderberg, L., Byström, M., Landström, U., Lindmark, A., Morén, B., Nilsson, L., Törnros, J., & Åström, A. (1988). Simulatorstudie avseende effekter av buller och temperatur på EEG och puls under fordonskörning. Undersökningsrapport 1988:25. Umeå, Sweden: Arbetsmiljöinstitutet (in Swedish).
ViP
Driving Simulation Centre
ViP is a joint initiative for development and application of driving
simulator methodology with a focus on the interaction between
humans and technology (driver and vehicle and/or traffic
environment). ViP aims at unifying the extended but distributed
Swedish competence in the field of transport related
real-time simulation by building and using a common simulator
platform for extended co-operation, competence development
and knowledge transfer. Thereby strengthen Swedish
competitiveness and support prospective and efficient (costs,
lead times) innovation and product development by enabling to
explore and assess future vehicle and infrastructure solutions
already today.
Centre of Excellence at VTI funded by Vinnova and ViP partners VTI, Scania, Volvo Trucks, Volvo Cars, Swedish Transport Administration,