The role of contractual and non-contractual relations
between transport buyers and providers, in an
environmental context
Anna Mellin – VTIEdith Sorkina – University of Gothenburg CTS Working Paper 2013:5
Abstract
The aim of this paper is to describe the relationship between transport buying companies and carriers, with a focus on the transport contracts in Sweden for land based transports. Based on the aim of this study, the following research questions have been defined: How can contracts be categorized? What is the average duration and flexibility of the transport contracts to external changes? and Which environmental related elements are commonly regulated in the contracts? Based on a literature review and interviews with people on strategic positions in the transport industry, we have conducted a web-survey. In addition to contractual agreements the survey also tried to capture the relation on environmental issues, as well as the experienced logistics performance over time. Results from the survey indicates that the suggested contract categorisation from the literature was not well known by the respondents, the average duration of contracts was 1-2 years and the majority of contracts includes a fuel clause, but not many environmental requirements. Further, the analysis indicates that companies with long term contracts set environmental requirements to a larger extend and that there is a positive significant relation between the companies’ environmental work with in the transport operation and their perception of an improved logistics performance, both in terms of quality and cost.
Keywords: Third party logistics, transport contracts, environment, land based transports, logistics performance.
JEL Codes: R40, R42, R48 These can be found at:
http://www.aeaweb.org/jel/jel_class_system.php#Y
Centre for Transport Studies SE-100 44 Stockholm
Sweden
1 INTRODUCTION
Transport is a major contributor of greenhouse gases (GHG) emissions and within the EU it is the single industry that has failed to carb the emission growth, except as the result of the recent economic recession. Reducing the environmental impact from freight transportation is high on the political agenda both on a national and international level, but also more and more on the company level. There has been a major shift in the focus on environmental issues to the private sector (Dyllick and Hockerts 2002). At the same time for companies, the focus has broadened from internal questions to issues in the supply chain (Carter and Rogers 2008), including transportation. Many major companies choose to work on environmental questions together with their suppliers - as that is how greater effects can be achieved. At the same time looking at studies regarding transport purchasing we can see mixed results regarding the role environmental criteria plays in the transport buying decisions. Price is still seen as the dominant factor in making mode and carrier choice decisions, while other factors are rather set as compulsory criteria that should be met to qualify as a supplier (Floden et al. 2010). Environmental criteria is definitely of rising interest both in understanding transport buyer decision making, but also for the transport buyers in practice.
There are a number of ways for companies to resolve their freight transport needs: they can own and run their own fleet of vehicles, enter into contracts with individual carriers or they may outsource their transports and/or transport planning to a logistic company (e.g. third party logistics company, TPL). The various solutions entail different contractual arrangements and will result in costs (and perhaps particularly unexpected changes in costs) which, to various degrees, are borne by the actors. In particular, different contracts will differ in the incentives they provide and the risk exposure. The aim of this paper is to describe the relationship between transport buying companies and carriers, with a focus on the transport contracts in Sweden for land based transports, i.e. we restrict our attention to road and rail transport. We strive to provide a structured overview of which kind of contracts are used. The focus is on how the contracts are constructed with an emphasis on characteristics that may influence the risk and incentive structures. Key questions concern how flexible the contract is in respect to external changes, e.g., whether cost changes are passed on to shippers, the duration of contracts, the extent to which the contracts regulate environmental issues, e.g., require specific types of vehicles (EURO classes), etc.
Based on the aim of this study, the following research questions have been defined: 1. How can contracts be categorized?
2. What is the average duration and flexibility of the transport contracts to external changes?
3. Which environmental related elements are commonly regulated in the contracts? Apart from the literature, the underlying design of the survey1 has been created on the
basis of a series of interviews with people on strategic positions in the transport
1
The survey was constructed and carried through together with Fredrik Eng Larsson and Ali Pazirandeh at the division of engineering logistics at the Lund University of Technology. The preparation work further included the review of the survey with several experts in statistics, logistics, economics and surveys, i.e. Ph.D. Gunilla Björklund, Professor Sten Wandell, Professor Lars Hultkrantz and Ph. D. Antony Paulraj
industry. In addition, we conducted two pilot studies of the survey before sending out the final version of the web-survey.
The focus in the survey was on the contracts between the transport buyer and the transport supplier. However, we are aware of that some of the parameters that have been applied might be requirements that are not necessarily specified in the transport contract, but rather requirements to qualify as transport supplier for a certain company. Hence in addition to contractual agreements, we have also tried to capture
• The relation between transport buying companies and transport service providers working on environmental issues.
• Whether or not the companies with strong environmental work internally and externally (with transport suppliers) have experienced better performance in regards to logistics over time.
The remaining paper is structured as follows. The next sections introduce some of the main themes of this study and provide a brief overview of the following relevant concepts: TPL; transport and logistics contracts; greening transport and logistics. Methodology of the study is introduced in the survey section, followed by an overview of the basic statistics from the survey, results in respect to the research questions defined earlier and analysis. The paper concludes with a discussion on the results and a summary of the main findings.
2 DEFINITIONS OF THIRD PARTY LOGISTICS
As mentioned, there are several potential ways of solving the logistics and transport needs. It is rather common to outsource this to specialised logistic firms. The reasons are mainly economical: the company may reduce its costs and focus on their core business (Heidbrink, 2005; Lundin and Hedberg, 2010). The majority of the transport buyers who participated in the survey are purchasing their transport from third party logistics companies (TPL): 78.7 % of the respondents had outsourced more than 75% of their transport operations. One definition of TPL is the following:
"The services offered by a middleman in the logistics channel that has specialized in
providing, by contract, for a given time period, all or a considerable number of logistics activities for other firms./…/ TPL consists of a long term relationship between two parties which regard each other as partners. The logistics solution is worked out in co-operation specifically for each shipper. The goal for the relationship should be to develop into strategic alliances with win-win for both parties." Andersson et al. (2003).
This is a rather narrow definition and there are other definitions which are less restrictive, e.g. that TPL involves an external company that assists a firm with logistical services and the relationship between the shipper and the third party is intended to be in place over a longer period. Thus, a TPL-solution entails a more strategic relationship between the parties rather than the shipper just purchasing a service. However, as TPL companies provide a variety of services and the exact product/ service mix provided can differ between different customers, the services included in the contracts can range from simple transport to integrated solutions.
3 TRANSPORT AND LOGISTICS CONTRACTS
In general, the logistic and forwarding firms do not own the means of transport. Typically, the TPL providers are either truck cooperatives, i.e., companies which are owned by the haulers for coordination and contracting, or transport agencies, i.e., large international companies that coordinate and contract haulers, see Lundin and Hedberg (2010). The TPL thus contracts a hauler for the physical transport work.
According to Heidbrink (2005) a logistical agreement is between one agent buying a service from another agent who agrees on either:
1) Contracting a forwarding agent or 2) Gives its own transport promise.
Lundin and Hedberg (2010) schematically describe the relationships and contracts in the Swedish trucking industry as in Figure 1, which illustrates the chain of contracts discussed above.
3.1 Categorisation of contracts
There have been some attempts in the scientific literature to categorize contracts used in the logistics services. However, as stated in Collins (1999), there seems to be a lack of empirical evidence when looking at types of contracts. The contractual aspect has also been highlighted more recently as an area where more research is needed (Olander and Norrman, 2012).
There are different ways of outsourcing logistic services. Fernie (1999) notes that the transport at hand may be dedicated to one shipper or shared between, giving us one dimension to categorize the contracts: (1) Dedicated assets, i.e. a transport that is dedicated to one shipper or (2) Shared assets, i.e. a transport that is shared with other shippers’ goods. Furthermore, Fernie distinguishes between two different ways of pricing: (a) Open book pricing, i.e. the prices for all services are reported individually in the invoice. In the way the shipper can see each cost item and (b) Closed book pricing, i.e. a total fee of all services is charged, and not reported individually. Hubbard (2001) refers to (a) as contract carriage and to (b) as common carriage. According to Kajüter and Kulmala (2005), open-book accounting has been mentioned both as a means of improving the cost efficiency of supply chains and as a tool for building trust into customer–supplier relationships. However, there is little empirical evidence of how to make open-book accounting work and avoid potential pitfalls.
Using these two dimension enables to group different types of contracts into categories. This is done in a case study by Lundin and Hedberg (2010) thus identifying four different contract categories:
1) Dedicated carriage (DC), i.e. dedicated asset with open book pricing. 2) Shared carriage (SC), i.e. shared asset with open book pricing.
3) Truckload carriage (TC), i.e. dedicated asset with closed book pricing.
4) Less-than-truckload carriage (LTL), i.e. shared asset with closed book pricing. An alternative way of categorising the contracts is found in Pruth (2002), who identifies three different types of TPL contracts based on their pricing strategies.
1) Fixed prices: which give the TPL actor a strong incentive to improve their efficiency since the risk rests on the TPL actor.
2) Actual cost and profit marginal using an open book pricing: In this case the price is dependent on the cost of the TPL actor and on tops of that an agreed
percentage. Hence, this generated no incentive for the TPL actor to improve its efficiency since they are guaranteed the agreed profit percentage.
3) Actual cost and management costs: The difference compared to number two, is that the management cost is a fixed fee.
A third way to categorize the contracts is according to contract length. Since the agreements of outsourcing the transport and logistics services depends on a mutual cooperation and a good understanding of each other, the logistical contracts are in general long term agreements (Heidbrink, 2005). In the review by Andersson et al. (2003) contracts in the Nordic countries varies mainly between 2-3 years. Meanwhile in another survey an average length of 1.3 years was found for transport contracts (Lammgård, 2007). The length of the contracts is found relevant to the study as long-term contracts allow building long long-term relationships between transport buying companies and TSP. It is likely that the length of relationships impacts the amount of resources invested in the relationship and the opportunities to work on improvements (including environmental work) on continuous basis.
There is further in Sweden no specific legal regulation for logistic service providers, and hence according to Olander and Norrman (2012) it is common to use a standard-form contract NSAB 2000 (i.e. the general conditions of the Nordic Association of Freight Forwarders).
In our empirical study we have chosen to study the following four categories of contracts:
1) Dedicated to you with open book pricing 2) Dedicated to you with-out open book pricing
3) Shared with other cargo owners with open book pricing
Shared with other cargo owners with-out open book pricingMore text …
4 GREENING LOGISTICS AND TRANSPORT
As mentioned in the introduction, many companies working with environmental questions are turning their attention to logistics and transport operations. Working with these issues can include purely internal activities or extend to working together with
suppliers, as in many cases the physical operations are actually outsourced and is thus not under the direct control of the company. Working with suppliers on environmental questions can be done both through contractual relations or non-contractual relations. The empirical study will investigate both how transport buying companies work with their transport service providers both through contractual and non-contractual relations.
There are varieties of options to reduce the environmental impact of transport and logistics activities. Commonly discussed actions on the company level for making freight transport more sustainable are: technology (vehicles, alternative fuels, ICT); changing logistics structures (Aronsson and Huge Brodin 2006); purchasing (Lammgård 2007; Evangelista et al. 2012 ); training; consolidation of freight (e.g. co-distribution); modal shift (McKinnon 2003; Roso 2011); planning/scheduling of transport operations (utilization, information sharing); implementing Environmental Management Systems; improvements in packaging, etc.
If the company is outsourcing its logistics function or the physical transport work, working with the issues above requires involvement of Transport Service Provider (TSP), for instance TPL, or other supply chain partners. Sourcing company can either set certain prerequisites for TSP to qualify as supplier (mandatory); use environmental criteria in the selection process between different providers or choose to work on a continuous basis together with the TSP to try to reduce environmental impact from the logistics and transport operations.
4.1 The relationship between environmental work and logistics performance
An important and debated question within the corporate sustainability is why the companies should engage in environmental work. A common argument is that improving environmental performance can improve economic performance of the company (Rao & Holt, 2005; Bacallan, 2000; Nishitani et al., 2011; Schaltegger and Synnestvedt, 2002) as companies focus on lean and efficient operations minimizing waste of resources. The same logic applies to logistics and transport: making logistics and transport greener improves the performance of these functions.
Within the logistics and transport research, the relationship between performance and greening measures has been investigated (Ludvigsen, 1999; Evers et al., 1996; Goldsby and Stank 2000; Björklund et al. 2012), but the literature is lacking empirical evidence. To explore the question whether there is a relation between environmental work and logistics performance. Both environmental work and logistics performance had to be defined and operationalized in order to be able to quantify them in the survey. Thus, the elements of these constructs as defined below have been used as the basis for the formulation of survey questions in the empirical study (see the questions in Appendix 1). For further information regarding the background to the constructions and the relevant references see Pazirandeh and Eng Larsson (2011).
As mentioned, company’s environmental profile has been evaluated through combination of 3 areas: general environmental work at the company, environmental work in the transport operations and environmental requirements in transport purchasing.
• an explicit strategy to reduce emissions, • employee training programs,
• life cycle analysis of products,
• evaluate employees on environmental criteria, • internal and external environmental reporting,
• accreditation to an environmental management program (EMS).
Environmental work with the transport operations was measured by how the company
has been
• actively working towards a larger share of rail transport (less environmentally damaging);
• actively working towards a larger share of sea transport (less environmentally damaging);
• increasing vehicle utilization by horizontal collaboration (e.g. co-distribution); • reporting transport emissions to stakeholders (measuring and transparency); • making investments to improve environmental performance of transportation, • actively working to reduce the volume of goods transported (eliminate
unnecessary transports),
• used IT support for the analysis of transport efficiency (measuring and data creates opportunities for improvement);
• reducing the amount of emergency deliveries (emergency deliveries are usually less optimal from resource efficiency perspective and cost point of view).
Greening transport purchasing has been measured through the extent to which the
company
• demanded environmental certification from suppliers, • evaluated providers according to environment criteria,
• used transport procurement e-tools to put environmental pressure on suppliers, • education of ECO-driving for drivers,
• identification of sustainable transportation service providers,
• environmental social cost payments through climate compensations.
Improvement in logistics performance has been measured through a combination of measures regarding efficiency and effectiveness. Respondents were asked to evaluate experienced improvements in logistics efficiency and effectiveness during the last 3 years. This has been chosen to capture the time dimension and to enable each respondent to relate to the logistic development at their work place.
The applied measure for logistics efficiency (costs) has been constructed through the use of following metrics: • transportation costs, • inventory costs, • warehousing costs, • administration costs, • obsolescence costs, • total logistics costs.
The measure of logistics effectiveness (quality) has been through changes in: • order lead time,
• delivery consistency, • backorders2,
• loss and damage, • overall reliability, • customer complaints
• overall customer satisfaction.
Finally, also the relation with the TSP was captured in the following statements on how the company has
• actively worked to increase the share of purchased transports, • actively reduced the number of TSP,
• actively aimed at having more long term contracts (with long term contracts there is more opportunities for continuous improvement),
• actively worked for more flexible contracts,
• signed contracts including additional services to the transports, • signed contracts where the TSP performs more complex assignments, • implemented competence improving measures together with the TSP, • actively increased the exchange of information with the TSP,
• experienced that it has become easier to change TSP.
5 THE SURVEY
The objective of the survey has been to achieve an overall view of the logistics services contracts in Sweden and in particular to add understanding to the environmental performance in transport procurement and the relationship between transport buying companies and transport service providers.
The survey was targeted towards commodity owning companies (i.e. shippers rather than carriers or TPL etc.). We focus on companies with a logistic manager, being an indicator that there is a logistic organisation which coordinates the purchase of transports. As our interest is to explore how transport buying companies work with environmental questions both internally and together with transport providers, presence of a logistics function has been taken as a selection criteria.
Excluding companies without a logistic manager may introduce bias in our sample. However, this approach is adopted in several earlier studies in related areas (e.g. Pålsson and Johansson, 2009; Harper and Evers, 1993; Bardi et al., 1989). We have limited the population to companies with 20 or more employees, thus eliminating those work places which can be assumed to have a modest commodity flows. The choice of 20 employees is based on the previous Swedish national commodity flow survey’s cut-off point. Our sample is a proportional, stratified random sample based on the size of the work place. The respondents are representing our stratified sample rather well, with a slight over representation of work place in the size of 50-199 employees, and a slightly under representation of work places with 20-49 employees. Size has been used as the
2
basis for the stratifying since there are reasons for believing that the contracts look different depending on the size of organisations. Moreover the size affects the bargaining power in the buyer-supplier relation and thus is found relevant. Stratifying also leads to a sample which better reflects the population. The work place size has been used in several previous studies on the similar phenomena (e.g. Lammgård, 2007). The use of work places in this survey is because it is assumed that contracts are available at this level and logistics managers at the respective work places have knowledge regarding the contracts.
The number of work places in Sweden 2011 that fulfil the requirements above amounts to 1043. This is thus the total population out of which 524 addresses were collected using the population data base (PAR). 406 of these were found valid after contacting the companies. Of these, 100 individuals have responded, which generates a response rate of approximately 25 %. However, the responses of 7 individuals have been removed as they only replied to the first basic questions leaving an actual response rate of 23 % (93/100). The respondents have mainly been logistics managers (app. 53 %) or purchasers, logisticians or managers (e.g. of transport, distribution, technical or purchase) at the respective companies in the sample. Due to the rather low response rate no generalization can unfortunately be made out of the survey results. When calling the respondents for their participation the following reasons were stated for not being able to participate: lack of time, new in their work position/having too little knowledge, the procurements are made at an overall level and company policy of not participating in surveys.
A 5-point Likert scale, with end-points “strongly agree” and “strongly disagree” was used to measure the response for some items. The middle point was anchored as “neither agree nor disagree”. In order not to measure just recent activity, the respondents were asked to indicate changes/improvements that had occurred over the last three years. Further, it is important to note that some questions have also been misinterpreted. For the following question: “How many contracts does your work place have of each length?”, several of the respondents seem to have stated their answers in percentage rather than actual number of contracts. This implies that we cannot calculate an average number of contracts based on all responses. Further, there is also several questions (i.e. “Who are performing your outgoing purchased transports?”, “What mode of transport is used for your purchased transports?”, “How are your purchased transports divided among the different transport sellers?” and “How are your purchased transports divided among the following alternatives?”) where the percentage does not sum up to 100 %. In most of these cases it has been feasible to proportionally increase their responses to equal 100 %, in other cases this has not been possible. This implies that the responses to some questions are not taken into account in the analysis. Finally, if a respondent did not answered a question it by default generated 0 as a response, therefore in some questions it is difficult to know whether the response is stated by purpose or just a non-response.
In the analysis of the collected survey data we have merged the different items in each category (described in the section The relationship between environmental work and logistics performance). The statistical method used is the principal component analysis (PCA). This is a technique that limits the number of variables by creating new one based on several linear composites of the original variables. For our hypothes testing, Mann-Whitney U-test has been used to test if there are significant differences between the
different groups. The problem of multiple comparisons has been controlled for by performing the Bonferroni correction method.
6 SURVEY RESULTS
In this section the results from the survey is presented and our hypotheses assessed.
6.1 Background data
The distribution among type of industry and size of the work places are shown in the following tables below.
Table 1 Represented industries
Industry Distribution
Agriculture production 1.1 % (1)
Basic metal industries and manufacture of fabricated products, machinery and equipment
31.2 % (29)
Forestry 3.2 % (3)
Mail order business/Distant shopping 2.2 % (2) Manufacture of chemical products and
manufacture of products in printing and publishing
9.7 % (9) Manufacture of food products and beverages 7.5% (7) Manufacture of wood products, pulp, paper and
paper products
7.5% (7)
Mining 2.2 % (2)
Other 22.6 % (21)
Other wholesale trade 1.1 % (1)
Wholesale of machinery, equipment and supplies 1.1 % (1) Wholesale trade of food products 4.3 % (4) Wholesale trade of intermediate goods 1.1 % (1) Wholesale trade of other consumer goods 5.4 % (5)
The ones who have stated others are; four IT/software industry, two pharmaceutical businesses, two electronic businesses. Further industries represented are: recycling, construction material, retailer for construction industry, metal production, conveyor manufacture, shipbuilding, textile, machine renting, electrical engineering and vehicle production.
The data set we received included information on the work places’ number of employees. In most cases this is consistent with the range the respondents have implied. In the cases it has not been accurate; we have kept the range the respondent has indicated since this is the most updated information. Further, we have also divided the work places into Small, Medium and Large as indicated in Table 3 and 4 below. This has been done to later facilitate the analysis of the effects’ of the size of the company, in line with other studies within this area e.g. Lammgård (2007). Size of the company is important as it is likely to affect the ability to dedicate resources to activities outside the core business and in many cases the larger companies are more exposed to pressure and scrutiny regarding environmental performance. For instance, a survey study among 450 American firms (Murphy et al.1995) revealed that the concern over environmental issues is larger among larger firms.
Table 2 Number of employees at participating companies
Employees Distribution 20-49 (S) 15.1 % (14) 50-199 (M) 49.5 % (46) 200-499 (M) 19.4 % (18) 500-999 (L) 8.6 % (8) 1000- (L) 7.5 % (7)
Table 3 Annual turnover (MSEK) of participating companies
Annual turnover3 Distribution 10-499 (S) 48.4 % (45) 500-999 (M) 16.1 % (15) 1000-4999 (L) 23.7 % (22) 5000 – (L) 6.5 % (6) Unknown 5.4 % (5)
6.2 Results
The research questions presented in the introduction of this paper will be responded to through the analysis of the empirical results from the survey.
Is it possible to divide the contracts in any major, general categories?
In the survey we asked the respondents to state in which of the following categories their contracts belong to. The categorisation is based on the types of contracts identified in the literature review.
3
- Dedicated to you with open book pricing - Dedicated to you with-out open book pricing
- Shared with other cargo owners with open book pricing - Shared with other cargo owners with-out open book pricing
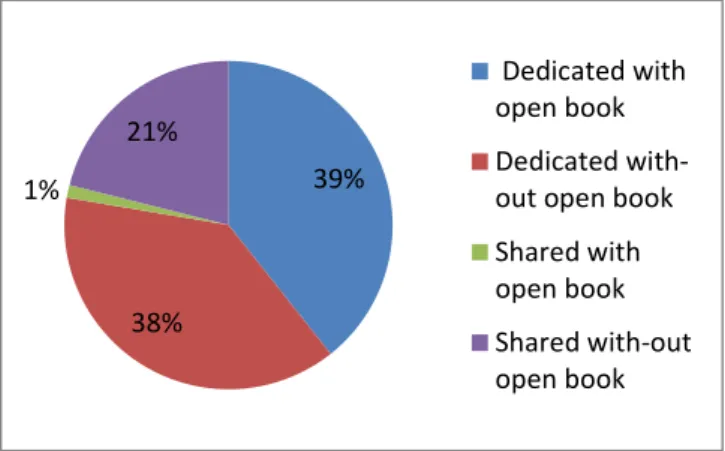
The answers to this question have been reported in percentage and according to the survey result most of the work places have contracts for dedicated transports and priced using the open book pricing method. Some (21 % from the responses received) have their contracts in two of the different categories; however for the respondents indicating “dedicated with open book pricing” this is the main category of contract.
Since the question was asked for percentage share it has also been analysed together with the question on number of contracts per length. This is done to get an idea of the main contract category in terms of actual number of contracts. Figure 2 illustrates the result, showing that in terms of number of contracts dedicated transports both with and without open book pricing are the most common categories.
It is worth noting that many of the respondents did not seem to be familiar with this categorisation or unwilling to reveal this information4, since only 46 of the
respondents did answer this particular question.
Figure 2 Share of contract categories (based on number of contracts)
How long are the average durations of the contracts?
The result from the survey shows a highest frequency of contracts with duration of 1-2 years, approximately 60 % of the ones who responded in number of contracts (i.e. 75 respondent, 18 respondents have most likely answered in percentage instead and thus been excluded from the analysis of this question). The great majority of contracts are above one year, more precisely 80 %.
4
As information regarding the contracts can be sensitive and confidential. 39% 38% 1% 21% Dedicated with open book Dedicated with-out open book Shared with open book Shared with-out open book
Figure 3 Number of contracts divided on the length
The overall average number of contracts per work place in our survey is 6 contracts. The average in each stratum is given in Figure 4 below. This shows that the number of contracts increases with the size of the work place (measured in number of employees). The same pattern is shown when measuring the size in annual turnover.
Figure 4 Number of contracts depending on the size of the work place
The findings in the survey are comparable with the ones of Lammgård (2007). In Lammgård (2007)5 the number of contracts are 3.2 as a stratified average (stratifying based on size), with the biggest diversion for large manufactures with an average of 11 contracts. For medium sized manufactures 5.7, and medium wholesalers 2.6 contracts.
How flexible are the contracts for external changes?
The literature has addressed the use of standard contracts as rather common (Olander and
5
The work places in Lammgård (2007) are divided into three different groups (depending on number of employees), in two levels depending if they are manufacture or wholesale and commission trade. Manufacture: 10-99(S), 100-399 (M), >400 (L); Wholesale: 5-19 (S), 20-99 (M), >100 (L). 0 50 100 150 200 250 300 350
<1y 1<2y 2<3y >3y
2,9 6,3 12,7 0 2 4 6 8 10 12 14 S M L
Norrman 2012), in our survey on average only of 15 % were stated to be standard contract. This low number might be a result of the chosen target group for the survey: the survey was directed towards the cargo owners as opposed to the transport service providers. Whether or not respondents are seeking flexible contracts has been captured in the following statement “Worked actively for more flexibility in new signed contracts“. A large share (46 %) responded strongly agree or agree to this statement, indicating the importance of flexibility. However, other ways of viewing the flexibility in this case is by looking at the elements regulated in the contract.
How are environmental issues dealt with internally and externally in relations with suppliers?
Contracts normally regulate e.g. prices, destinations and risk. One important example of environmental related elements regulated is the fuel clause. From our survey it’s seem that the average percentage of contracts that have a fuel clause is only 63 %. However, this number might be an underestimation since if the respondent has chosen not to respond, this will automatically generate a respond of 0 %. The data shows that 47 % of the respondents have fuel clauses in all their contracts; meanwhile 20 % stated that none of their contracts included a fuel clause.
Demand of EURO class is another element related to the environment (however, not GHG). This has not been stated as a part of the contracts strictly, but approximately 38 % have stated that they have been demanding high EURO classes from their transport providers. The corresponding figure for demanding eco-driving is only approximately 19 %.
Figure 5 below illustrates the answer of transport purchasing companies regarding their internal environmental work. Some of these requirements are regulated in the transport contracts, as mentioned above, while others just used in the purchasing process for evaluation of the different transport providers. Environmental evaluation of employees and LCA of products are most poorly used. At the same time having an overall environmental strategy, doing environmental reporting and educating employees in environmental questions seems to be rather popular- all three parameters were common among half of the respondents.
Figure 5 General environmental work
As can be seen from the Figure 6, environmental requirements in transport purchasing are rather uncommon. Climate compensation and transport purchasing tools are most
0% 20% 40% 60% 80% 100% GHG strategy Env. Education LCA of products Env. Evaluation Env. Report Agree Disagree/Indifferent
poorly used, while environmental evaluation of TSP is most commonly applied measures according to our survey data. Both climate compensation and transport purchasing tools can be seen as costs that transport purchasing companies are unwilling to take. At the same time environmental evaluation of TSP and putting demands regarding environmental certification is common.
Figure 6 Greening transport purchasing
Another question stated to the respondents was regarding the environmental work within the transport operations. In interpreting the results from this question it is important to keep in mind that very few companies in the sample actually had any “own transport” as opposed to purchasing transport from forwarders and other transport service providers: 78,7 % of the respondents had outsourced more than 75% of their transport operations.
Figure 7 Greening transport operations
The graph above illustrates that the use of environmental measures in the transport operations is rather low. The most commonly used measures were reduction of emergency transport and working on reducing the need for transportation. Though these measures have positive impact on the environmental their use is also very rational from the cost cutting perspective: it eliminates unnecessary transport and normally more costly emergency transport.
0% 20% 40% 60% 80% 100%
Demand for environmental certification Environmental evaluation of TSP QIII Eco-driving EURO-class Climate compensation Agree Disagree/indifferent 0% 20% 40% 60% 80% 100% 120% Emission reporting Environmental investments Reduced goods volume Increase share of rail transport Increased share of sea transport IT support Horizontal cooperation Emergency transports
Disagree/ indifferent
Figure 8 Relations with TSP
Figure 8 above illustrates how companies are working with their TSP. The results show that companies are rather interested in having closer and more long-term relations with fewer TSPs, while having high flexibility. From the environmental perspective the interest to build long-term relationships with TSPs is rather positive as it can be difficult to work together with many TSPs at the same time. Moreover, common initiatives in improving environmental performance often are time and resource consuming- thus the opportunities to work on these issues require some stability in the relation and time to actually carry through the improvement work.
6.3 Hypotheses
A PCA has been conducted for each of the variables described earlier in section
The relationship between environmental work and logistics performance. In each
of the analyses the Kaiser-Meyer-Olkin (KMO) measure of sampling adequacy has been calculated, which compares the correlations and the partial correlations between variables. If the partial correlations are low compared to the correlations, then the KMO measure is high and a PCA is appropriate. A KMO value between 0.70 and 0.79 is considered as middling, a value of 0.80 to 0.89 is meritorious, and a value of 0.90 to 1.00 is marvellous. (StataCorp, 2009).
1. Work places with long term contracts (≥2 year) have a more active environmental work in general than work places with a majority of short term contracts (<1 year).
The KMO result for the component Environmental work is 0.77, and hence considered middling for the PCA. The other components’ KMO are shown in Table 4 below.
0% 20% 40% 60% 80% 100%
Increase in purchased transports Reduced number of TSP Increased number of long term contracts Increased flexibility in contracts More services included in contracts More complex services in contracts Measures to increase competence Increase information sharing with TSP Change of TSP
Agree
Table 4 KMO results for the different components
Component KMO
Greening transport purchasing 0.82 Greening transport operation 0.79
Relation with TSP 0.81
Logistic effectiveness 0.92 Logistic efficiency 0.81
In the PCA the criterion of creating one new component has been set. Further, the result of the correlation matrix between the original items and the new variable is stated in the table below. This indicates how much each individual are loading in the new variable, i.e. the higher the loading the more influential the item is in forming the new variable (Sharma, 1996).
Table 5 Correlation matrix for the component Environmental work
Environmental work Environmental report 0.775 Environmental evaluation 0.720 LCA of products 0.784 Environmental education 0.876 GHG strategy 0.810
The Mann-Whitney U test indicates that there is no significant difference between the companies with longer contracts compared to the ones with short contracts when it comes to their internal environmental work. However, other differences have been recognized.
2. Work places with long term contracts are setting higher requirements on their transports compared to the ones with shorter term contracts.
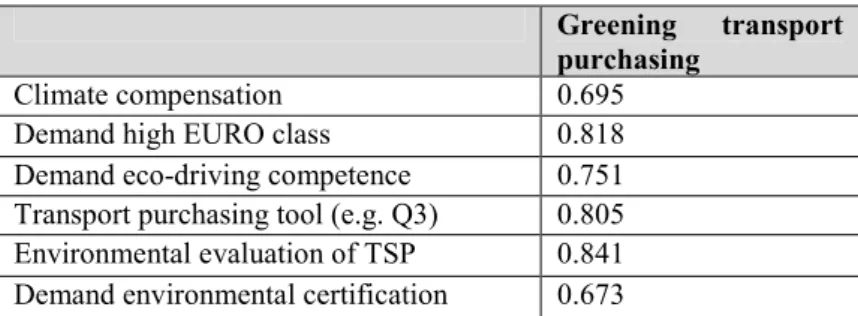
Our analysis indicates that the variables greening transport purchasing and relation with TSP are significant different between firms with long term and short term contracts, i.e. the companies with longer contracts tend to set environmental requirements (i.e. greening transport purchasing) to a further extent to their TSP (U=262.5, z=2.08, p=0.038) and have a stronger relation with their TSP (U=260.5, z= -1.98, p=0.048).
Table 6 Correlation matrix for Greening transport purchase
Greening transport purchasing
Climate compensation 0.695
Demand high EURO class 0.818 Demand eco-driving competence 0.751 Transport purchasing tool (e.g. Q3) 0.805 Environmental evaluation of TSP 0.841 Demand environmental certification 0.673
However, when controlling for multiple comparisons with the strict method of Bonferroni they are no longer significant, which weakens these hypotheses. The correlation matrix for Greening transport purchasing and Relation with TSP are seen in Table 6 and Table 7.
Table 7 Correlation matrix for Relation with TSP
Relation with TSP
Easy to change TSP 0.573
Increase information exchange with TSP 0.866
Increase competence 0.719
Purchase more complex services 0.681 TSP performs more services 0.713
Increased flexibility 0.824
Increase long contracts 0.743
Reduce number of TSP 0.725
Increase purchased transports 0.534
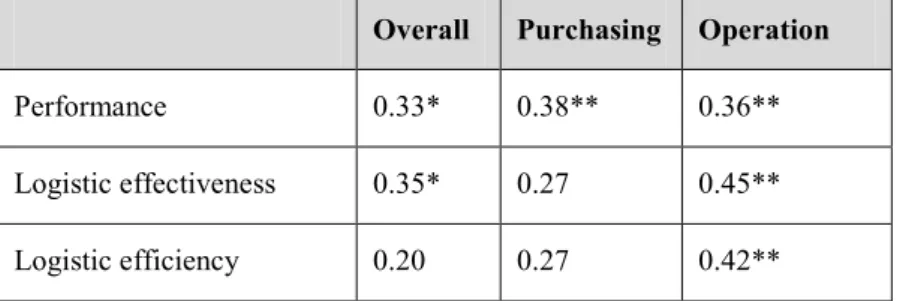
3. Workplaces working with environmental issues have seen an improvement in logistics performance (efficiency and effectiveness) This analysis has also been performed with correction for the several tests made of the data (Bonferroni correction). The results partly support the hypothesis. Table 8 shows the correlation matrix between the new, merged variables and indicates that there is a positive significant correlation between greening the transport operation and the two variables for logistics performance (efficiency, i.e. price and effectiveness, i.e. quality). For the company’s overall environmental (described earlier in Table 5) profile there is only found a significant correlation with the logistic effectiveness, but lower correlation compared to the operation variable. However, for the greening transport purchasing this pattern is not seen and no significant correlation is found. Hence, there is a weak support for this hypothesis only. Results are showing that initiatives directly aimed at greening the transport operations are most effective. Though greening transport purchasing is important, it does not guarantee that the suppliers will actually follow through the environmental work throughout operations. Similarly, company level initiatives and environmental work is important, but if it is not translated into functional levels as well, it does not show an impact.
Table 8 Correlation matrix for environmental work and logistics performance
Overall Purchasing Operation
Performance 0.33* 0.38** 0.36**
Logistic effectiveness 0.35* 0.27 0.45** Logistic efficiency 0.20 0.27 0.42** ** Significant at < 0.01 level. * Significant at < 0.05 level
7 DISCUSSION AND CONCLUSIONS
The aim of this study has been to give a background to the relationship between transport buyers and transport providers, with a focus on the transport and logistics contracts.
In the literature there are not much empirical studies on transport and logistics contracts, especially not in Sweden. The limitations and complexity of industries and contracts complicates the attempt to give a general overview and categorisation, and especially a quantification of contracts. However, some research has been done which we have summarised in our theory chapter. In this part we will combine the findings in the literature with the result from our survey.
Transport Contracts
We started of the find an answer to this question in the literature and found that there are several difficulties in categorising the contracts, e.g. due to the large amount of contracts and the high diversity among them. Further, there were not much literature on this subject and no clear general categories for Sweden could be found. However, we found a few examples of categorisation, stating this was in general done depending on the transport service. Hence, we decided to test some of the categorisation empirically. We selected the following four categories based on the paper by Lundin and Hedberg (2010):
- Dedicated resources and open book pricing. - Dedicated resources and close book pricing. - Shared resource and open book pricing. - Shared resources and closed book pricing.
However, the survey results are indicating that these terms were not very familiar to our respondents, based on the high share of non-responses to this particular question. However, from the responses the dedicated and open book category was the most common (54 %), followed by dedicated and closed book. There is still a problem of generalising all the contracts for land based transports in Sweden in an adequate way. This is one start, but not a complete response.
Another way of categorising the contracts is by their duration. A long contract might indicate that it is more difficult to make major changes, since they already committed to a long term agreement. From the literature survey, as well as from
oral communication with Lundin (2010), the average time frame of logistic contracts (with TPL) is in general set to 3-5 years.
The result from the survey shows another picture, with a highest frequency of contracts with duration of 1-2 years. This is comparable with the results in the large survey conducted in Lammgård (2007) which shows an average length of 1.3 years for contracts. This could be due to that we have tried to capture all contracts, not only the once with forwarders and TPL, which to a further extent seem to have longer contracts than the once using hauliers as transport providers. There are no trend seen between the different categories of contracts and the length of the contracts. However, one trend seen in the survey result is that the larger work places tend to, in average, have a higher amount of contracts. This might be e.g. due to larger amounts of goods being shipped, but also for having a greater flexibility, and this leads us to the third question.
The transport and logistics contracts can be very detailed, but on an aggregated level it is mainly cost per distance and per hour that are regulated (Lundin, 2010). Almost half of the respondents agreed that they are seeking more flexible contracts, so this seems to be an important issue for many of the transport buying companies. From an environmental policy perspective, it is however important with the environmental related elements in the contracts and how the cost/risk is divided between the actors.
Environmental issues and relations with TSPs
As it seems several companies are adding fuel and energy costs in the contracts, as well as other environmental fees. Indicating that these costs are directly transferred to the transport buyer, rather than affecting the transport provider. From our survey approximately 47 % (44/93) stated that 100 % of their contracts have a fuel clause, indicating that the prices changes depending on the market price of fuel (which includes the fuel and energy taxes). Almost 20 % (19/93) did however state that they have no contracts with a fuel clause. Further, 38 % stated that they have requested that high EURO-class vehicles should be used. Finally, we also asked about eco-driving competence. However, only 19 % stated that they had been requiring eco-driving competence among the drivers of their transport provider.
There are as can be seen from this study ways for the transport providers to partly avoid economic policy measures, such as an increased fuel tax. This can be done via a fuel clause, which according to this study is common in transport and logistics contracts. Hence, this policy measure affects rather the transport buyers instead and does not give strong incentive for the transport provider to improve its efficiency. In order to generate incentives for transport providers, other measures need to be considered.
The study also investigated how common it is working on environmental issues both internally and externally with TSP. Results show rather low rate of application of various environmental requirements. Climate compensation and transport purchasing tools are most poorly used of the one stated in the survey, while environmental evaluation of TSP is most commonly applied measures in
transport purchasing. Moreover, the use of environmental measures in the transport operations is also rather low. The most commonly used measures were reduction of emergency transport and working on reducing the need for transportation. Though these measures have positive impact on the environmental their use is also very rational from the cost cutting perspective: it eliminates unnecessary transport and normally more costly emergency transport. The results show that companies are rather interested in having closer and more long-term relations with fewer TSPs, while having high flexibility. From the environmental perspective the interest to build long-term relationships with TSPs is rather positive as it is difficult to work together with many TSPs at the same time. Our survey results supports this by the indications that companies with long term contracts tend to have a stronger relationship with their TSP and also sets environmental requirements to a further extent. Furthermore, common initiatives in improving environmental performance are often time and resource consuming- thus the opportunities to work on these issues require some stability in the relation and time to actually carry through the improvement work.
The hypothesis testing indicates that there is a positive, statistically significant relation between the companies’ external environmental work and improvements of logistics performance, both in terms of effectiveness and cost. Still, in interpreting the results one should be careful as the improvements in efficiency and effectiveness of logistics have been measured through perceived improvement by the respondents over the period of the last 3 years rather than the actual improvements. Results are showing that environmental initiatives directly aimed at the transport operations are most effective - have the strongest relation with improvements in performance.
8 ACKNOWLEDGMENT
We would like to thank associate professor Maria Björklund from Linköping University for reviewing our work and providing suggestions for improvement.
9 REFERENCES
Andersson, D., Dreyer, H., Halldórsson, Á., Jare, M., Ojala, L., Skjott-Larsen, T. and Virum, H. (eds.) (2003) Third Party Logistics – A Nordic research approach. Turku School of Economics and Business Administration.
Aronsson, H. and Huge Brodin, M. (2006) The environmental impact of changing logistics structures. International Journal of Logistics Management, vol. 17, issue 3, p.394 – 415.
Bacallan, J. J. 2000. Greening the Supply Chain. Business and the Environment, 6. 11-12
Bardi, E. J, Bagchi, P.K. and Raghunathan, T. S. (1989), Motor Carrier Selection in a Deregulated Environment. Transportation Journal, 29 (1), 4-11.
Björklund, M. (2005) Purchasing Practices of Environmentally Preferable
Transport Services -Guidance to increased shipper considerations. Diss. Linköping
University.
Björklund, M., Martinsen, U. and Abrahamsson,M., (2012) Performance measurements in the greening of supply chains. Supply Chain Management: An
International Journal, vol. 17, issue 1, pp. 29 - 39
Carter, C. R. and Rogers, D. S. (2008) A framework of sustainable supply chain management: moving toward new theory. International Journal of Physical
Distribution & Logistics Management, vol. 38, no. 5, pp. 360-387.
Collins, H. (1999), Regulating Contracts. Oxford University Press, Oxford
Dyllick, T. and Hockerts, K. (2002) Beyond the business case for corporate sustainability. Business Strategy and the Environment, vol. 11, no. 2, pp.130– 141.
Evangelista, P., Huge-Brodin, M., Isaksson, K. and Sweeney, E. (2012). A case study investigation on purchasing green transport and logistics services. In: Esposito, E., Evangelista, P., Pastore, G., Raffa, M. (Ed.), Purchasing & Supply Management in a Changing World: IPSERA 2012 Conference Proceedings. Napoli, Italia: Edizioni Scientifiche Italiane.
Evers, P. T., Harper, D.V., Needham, P. M. 1996. The determinants of shipper perceptions of modes. Transportation Journal, winter, 13-25
Fernie, J. (1999) Outsourcing distribution in U.K. retailing. Journal of Business
Logistics, vol. 20, 2, 83-95.
Floden, J., Bärthel, F. and Sorkina, E. (2010) Modal choice in Europe – a literature
review from the transport customers’ perspective. Submitted to 12th WCTR
conference, Lisbon.
Florida, R. (1996). Lean and green: the move to environmentally conscious manufacturing. California Management Review, vol. 39, no. 1, pp. 80-105.
Geffen, C. A. and Rothenberg, S. (2000) Suppliers and environmental innovation: the automotive paint process. International Journal of Operations & Production
Management, vol. 20, no. 2, pp. 166-86.
Harper, D. V. and Evers, P. T. (1993) Competitive issues in intermodal railroad– truck service. Transportation Journal, vol. 32 (3), 31–45.
Heidbrink, J. (2005) Logistikavtalet – Allmän kontraktsrätt i transporträttslig
miljö, Diss. Juridiska institutionen, Stockholms Universitet, Uppsala.
Kajüter,P. and Kulmala, H.I. (2005) Open-book accounting in networks: Potential achievements and reasons for failures. Management Accounting
Research, vol. 16, issue 2, June 2005, p. 179-204
Lammgård, C. (2007) “Environmental Perspectives on Marketing of Freight Transports –The Intermodal Road-Rail Case”, Dissertation, School of Business, Economics and Law, Gothenburg.
Ludvigsen, J. (1999). Freight transport supply and demand conditions in the Nordic Countries: recent evidence. Transportation journal, 39, 31-54.
Lundin, J. (2010) Oral communication, 17 August 2010.
Lundin, J. and Hedberg, L. (2010) Choosing appropriate contract type for outsourced trucking operations: model development using action research, Forthcoming publication.
McKinnon, A. 2003. Logistics and the environment.
Murphy, P. R, Poist, R.F. and Braunschweig, C.D. (1995), Role and relevance of logistics to corporate environmentalism. International Journal of Physical
Distribution and Logistics Management, 25 (2), 5-19.
Nishitani, K., Kaneko, S., Fujii, H. och Komatsu, S. (2011) Effects of the reduction of pollution emissions on the economic performance of firms: an empirical analysis focusing on demand and productivity. Journal of Cleaner Production, 19, pp. 1956-1964.
Olander, M. and Norrman, A. (2012) Legal analysis of a contract for advanced logistics services, International Journal of Physical Distribution & Logistical
Management, vol. 42, issue 7, pp. 673-696.
Pålsson, H. and Johansson, O. (2009) Supply chain integration obtained through uniquely labelled goods: A survey of Swedish manufacturing industries.
International Journal of Physical Distribution & Logistics Management, vol. 39,
issue 1, pp.28 -– 46
Pazirandeh, A. and Eng Larsson, F. (2011), Green Logistics – does it make sense? Presented at NOFOMA Conference 2011. Working paper.
Pruth, M. (2002) Kontrakt som styrmedel I TPL-samarbeten – Existerande
funktioner och utveckling av nya principer. Diss. Handelshögskolan vid
Göteborgs Universitet.
Rao, P. and Holt, D. 2005. Do green supply chains lead to competitiveness and economic performance? International Journal of Operations & Production
Management, 25, 898-916.
Roso, V. (2011), LENS II course material, University of Chalmers.
Sharma, S. (1996) Applied multivariate techniques. John Wiley & Sons Inc.
StataCorp. (2009). Stata: Release 11. Statistical Software. College Station, TX: StataCorp LP.
Schaltegger, S, och Synnestvedt, T. (2002) The link between “green” and economic success: environmental management as the crucial trigger between environmental and economic performance. Journal of Environmental
10 APPENDIX 1: SURVEY QUESTIONS
About the work place:
Industry (chose one): • Forestry
• Agriculture
• Manufacture of food products and beverages
• Manufacture of wood products, pulp, paper and paper products
• Manufacture of chemical products and manufacture of products in printing and publishing
• Basic metal industries and manufacture of fabricated products, machinery and equipment
• Mining
• Wholesale trade of food products
• Wholesale trade of other consumer goods
• Mail order business/ Distant shopping
• Wholesale trade of intermediate goods
• Wholesale of machinery, equipment and supplies
• Other wholesale trade
• Other (Please specify):_____________________
Number of employees:
20-49 50-199 200-499 500-999 >1000 Do not know
Annual turnover (MSEK):
<10 10-499 500-999 1000-5000 >5000 Do not know
Title:
Transport purchaser Logistics manager CEO Purchaser
Others: ____
About the work place’s outbound transports:
Please state which unit you will use when responding to the question on your outbound transported goods:
___ tonne ___m3 __Other (Please specify)______
How much does your work place, in average, transport annually (tonne/m3)?
____
Default is the year 2009. If you cannot respond for this year, please state here which year you are responding for:
_____
How much of your outgoing purchased transports (share of tonne/m3) were performed by the following
transport provider:
• Hired forwarder/transporter (%):______________
• Own transports that are both planned and performed in-house (%):______________
• Customer arrange the transport (%:)______________
• Other (Please specify) (%):______________
The following questions address your purchased transports:
What mode of transport is used for your purchased transports (share in tonne or m3)?
• Road (%):______
• Road+Rail (%):______
• Road+Rail+Sea (%):______
• Road+Sea (%):______
• Rail (%):______
• Other (Please specify (%):______
How are your (purchased) transports divided among the different transport providers (share in ton or m3)? • Haulier (%):______ • Haulier cooperative (%):______ • Forwarder/3PL/4PL (%):______ • Train operator (%):______
• Other (Please specify) (%):______
How large share of your (purchased) transports are purchased via long transport contracts (at least 1 year) (%)?
____________ %
How many transport contracts do you have of each length? (In numbers)
• ___ Less than one year
• ___ One year until less than two years
• ___Two years until less than three years
• ___Above three years
How large share of the total number of transport contracts include a fuel clause? (%) _____%
How large share (of the total number of transport contracts are standard contracts? (%) (If 0, please skip the next question)
_____ %
Please specify type of standard contract:
_________________
How large share (measured in number of contracts) of these transports are performed by resources that are:
• Dedicated to you with open book pricing _______ %
• Dedicated to you with-out open book pricing _______ %
• Shared with other cargo owners with open book pricing _______ %
• Shared with other cargo owners with-out open book pricing _______ % What is your work place’s view on the logistics function?
• ____A core competence
• ____A supportive function
• ____Other (Please specify)
The company’s environmental and quality work:
Our company:
Has an environmental management system (e.g. ISO 14001) Yes No
Is certified according to ISO 9000 Yes No
Our company (1=Strongly disagree, 3= Neither agree nor disagree, 5=Strongly agree):
Has an explicit greenhouse gas emissions reduction strategy 1 2 3 4 5
Educates employees on environmental issues 1 2 3 4 5
Performs life cycle assessments of our products 1 2 3 4 5
Includes environmental performance criteria in the evaluation of employees 1 2 3 4 5
Publishes an environmental report 1 2 3 4 5
Environmental requirements in the transport procurement
Over the last three years our transport organization has (1=Strongly disagree, 3= Neither agree nor disagree, 5=Strongly agree):
Put demands on our transport providers to be environmentally certified 1 2 3 4 5 Included environmental criteria in the assessment of transport providers 1 2 3 4 5 Used procurement e-tools to put environmental pressure on TSP (e.g. QIII) providers 1 2 3 4 5
Demanded Eco-driving trained drivers 1 2 3 4 5
Demanded for vehicles with high EURO class 1 2 3 4 5
Paid a climate compensation surcharge for our transports 1 2 3 4 5
Environmental work in the transport function
Over the last three years our transport organisation has (1=Strongly disagree, 3= Neither agree nor disagree, 5=Strongly agree):
Made investments to improve environmental performance of our transports 1 2 3 4 5 Worked active to reduce total freight volumes (incl. packing) 1 2 3 4 5 Worked actively to increase the share of rail transport in our logistics system 1 2 3 4 5 Worked active to increase the share of sea transports in our logistics system 1 2 3 4 5
Used IT support to do analysis of the transport efficiency 1 2 3 4 5
Applied horizontal forms of cooperation with other shippers 1 2 3 4 5 Worked active to reduce the number of emergency shipments
of e.g. spare parts 1 2 3 4 5
Relation to the transport providers
Over the last three years our transport organisation has (1=Strongly disagree, 3= Neither agree nor disagree, 5=Strongly agree):
Worked actively to increase the share of purchased transports 1 2 3 4 5 Worked actively to reduce the number of TSP 1 2 3 4 5
Worked actively to increase the number of long term, contracts (above one year) 1 2 3 4 5 Worked actively to increase flexibility in new signed contracts 1 2 3 4 5 Signed contracts with the TSP including a package of service, beyond transport 1 2 3 4 5 Signed contracts with the TSP
for more complex services 1 2 3 4 5
Introduced measures together with the TSP
to increase the competence level 1 2 3 4 5
Worked actively to increase the information exchange
with the TSP 1 2 3 4 5
Changed frequently transport provider 1 2 3 4 5
Quality of the transports
Over the last three years our transport organisation has noticed the following operational improvements (1=Strongly disagree, 3= Neither agree nor disagree, 5=Strongly agree):
Transport times 1 2 3 4 5
Reliability of transport times 1 2 3 4 5
Flexibility of departure time 1 2 3 4 5
Flexibility of arrival time 1 2 3 4 5
Frequency of transports 1 2 3 4 5
Load factor 1 2 3 4 5
Information exchange 1 2 3 4 5
Handling of damages and losses 1 2 3 4 5
Emissions from the transports 1 2 3 4 5
Logistics performance
Over the last three years our company’s delivery service has improved in the following areas, due to changes in the work of the transport organisation (1=Strongly disagree, 3= Neither agree nor disagree, 5=Strongly agree):
Order lead time 1 2 3 4 5
Consistency in the delivery 1 2 3 4 5
Back orders 1 2 3 4 5
Damages and losses 1 2 3 4 5
Reliability in general 1 2 3 4 5
Customer complains 1 2 3 4 5
Customer satisfaction in general 1 2 3 4 5
Over the last three years the following variables have improved due to changes in the work of the transport organisation (1=Strongly disagree, 3= Neither agree nor disagree, 5=Strongly agree):
Transport costs 1 2 3 4 5
Stock cost/Capital in stock 1 2 3 4 5
Warehousing cost 1 2 3 4 5
Administrative costs 1 2 3 4 5
Obsolescence cost 1 2 3 4 5
Total logistics cost 1 2 3 4 5
Over the last three years our logistic system has undergone the following changes (1=Strongly disagree, 3= Neither agree nor disagree, 5=Strongly agree):
___Centralisation of warehousing
___Reallocation of the production closer to the market ___Implementation of order based storage
___Decentralisation of storage ___Change of providers’ location
Company changes
Over the last three years our company, in general, has seen improvements via (1=Strongly disagree, 3= Neither agree nor disagree, 5=Strongly agree):
Established in new markets 1 2 3 4 5
Increased prices of our products 1 2 3 4 5
Higher profit marginal 1 2 3 4 5
Increased turnover 1 2 3 4 5
Increased market share 1 2 3 4 5
Final questions
Further comments: