ITERATE
IT for Error Remediation And Trapping Emergencies
Description of Unified Model of Driver behaviour (UMD) and definition of key parameters for specific application to different surface transport domains of application
Deliverable No. D1.2
Workpackage No. WP1
Workpackage Title Critical state of the art and unified models of driver behaviour
Editor David Shinar ( shinar@bgu.ac.il)
Authors Ilit Oppenheim, David Shinar (BGU), Simon Enjalbert, Rudy Dahyot, Marianne Pichon, Abel Ouedraogo ( UNIVAL), Margareta Lützhöft (Chalmers), Oliver Carsten (Leeds), Magnus Hjälmdahl (VTI), Carlo Cacciabue (Kite)
Status Final
Reviewed and approved for submission Magnus Hjälmdahl, 2010/02/04
EUROPEAN COMMISSION DG RESEARCH
A FP7 Collaborative Project Work programme: Sustainable Surface Transport SST.2007.4.1.2: Human physical and behavioural components
ii
Document History Table
Version
No. Date Details
V0.1 2010/01/03 First draft for partners' comments
V0.2 2010/01/10 Internal draft including comments' corrections V0.3 2010/01/27 2nd Internal draft including comments' corrections V0.4 2010/02/04 First EC submission
iii
The ITERATE project
This report is produced within the European project ITERATE (IT for Error Remediation And Trapping Emergencies), Grant agreement number 218496. The project started the 1st of January 2009 and will end 31st of December 2011.
The objective of ITERATE is to develop and validate a unified model of driver behaviour (UMD) and driver interaction with innovative technologies in emergency situations. This model will be applicable to and validated for all the surface transport modes. Drivers’ age, gender, education and experience and culture (whether regional or company/organisational) are factors that will be considered together with influences from the environment and the vehicle.
Such a unified model of driver behaviour will be of great use when designing innovative technologies since it will allow for assessment and tuning of the systems in a safe and controllable environment without actually putting them to use in real traffic. At the concept stage, the model could guide designers in identifying potential problem areas whilst at the prototype stage, the model could inform on the scenarios to be used in system evaluation. In this way the systems will be better adapted to the drivers before being available on the market and will provide better support to the driver in emergency situations. Along the same lines, the model could be of use for authorities as a guide in assessing and approving innovative technologies without performing extensive simulator experiments or large scale field trials.
ITERATE is based on the assumption that the underlying factors influencing human behaviour such as age, gender, culture etc. are constant between transport modes. This assumption allows for a unified model of driver behaviour, applicable to all surface transport modes, to be developed. This will be done within ITERATE and the model can be used to improve design and safety assessment of innovative technologies and make it possible to adapt these technologies to the abilities, needs, driving style and capacity of the individual driver. The model will also provide a useful tool for authorities to assess ITS which is missing today.
The project consortium consists of seven partners:
Statens väg och Transportforskningsinstitut (VTI) Sweden; University of Leeds (UNIVLEEDS) UK; University of Valenciennes (UNIVAL) France; Kite Solutions s.n.c.(Kite) Italy; Ben Gurion University (BGU) Israel; Chalmers University (Chalmers) Sweden; MTO Psykologi (MTOP) Sweden
For more information regarding the project please see http://www.iterate-project.eu/
I hope you will enjoy this and all other deliverables produced within the ITERATE project. If you seek more information or have questions don’t hesitate to contact me.
Magnus Hjälmdahl, VTI Project coordinator
e-mail:Magnus.Hjalmdahl@vti.se tel: +46 13 20 40 00
iv
List of abbreviations
ADAS Advanced Driver Assistance Systems AIDE Adaptive Integrated Driver-vehicle InterfacE ATC Automatic Train Control
ATP Automatic Train Protection AWS Automatic Warning System BR Barrier Removal
DMI Driver Machine Interface DVE Driver – Vehicle – Environment
DVED Driver – Vehicle – Environment - Driver assistance system EEG Electro Encephalo Gram
ERSO European Road Safety Observatory
ERTMS European Railways Traffic Management System ETSC European Transport Safety Council
FDW Following Distance Warning FHWA Federal Highway Administration
HASTE Human machine interface And the Safety of Traffic in Europe HUD Head Up Display
ISA Intelligent Speed Adaptation
ITERATE IT for Error Remediation And Trapping Emergencies
ITS Intelligent Transport Systems IVIS In Vehicle Information System
JDVS Joint Driver- Vehicle System KSS Karolinska Sleepiness Scale LOC Locus Of Control
OECD Organization for Economic Cooperation and Development PDT Peripheral Detection Task
RCW Reverse Collision Warning
ROSPA Royal Society for the Prevention of Accidents RT Reaction Time
SA Situation Awareness
SOFI Swedish Occupational Fatigue Inventory SPAD Signals Passed At Danger
SS Sensation Seeking SSS Sensation Seeking Scale
SWAT Subjective Workload Assessment Scale TCI Task Capacity Interface
TLX Task Load Index
v
Table of Contents
1. Introduction ... 8
2. dependent variables ... 14
2.1 Error propensity (slips, lapses, mistakes, violations) ... 14
2.2 Transformations of Reaction time to discrete events ... 15
2.3 Projection of current situation to risky vs. safe situation ... 15
3. Factors influencing driving safety & selected driver variables ... 16
3.1 Attitudes/ personality ... 16
3.1.1 Sensation Seeking ... 16
3.1.2 Effect of sensation seeking on the dependent variables ... 17
3.2 Experience ... 18
3.2.1 Hazard perception skills ... 20
3.2.2 Effect of hazard perception skills on the dependent variables ... 21
3.3 Driver state (impairment level) ... 22
3.3.1 Fatigue ... 23
3.3.2 Effect of fatigue on the dependent variables ... 24
3.4 Task demand (workload) ... 26
3.4.1 Subjective Workload ... 27
3.4.2 Effect of subjective workload on the dependent variables ... 28
3.5 Culture ... 28
3.5.1 Effect of Culture on the dependent variables ... 30
4. task analysis ... 31
4.1 Task analysis of car driving ... 31
4.2 Task analysis of train driving ... 35
5. Environmental Parameters influencing driving safety ... 38
5.1 Road / Track / Fairway ... 38
5.2 Traffic ... 40
5.3 Visibility ... 40
6. interaction between the Environmental parameters and the Driver variables ... 41
6.1 Environmental parameters & Attitudes / Personality (Sensation Seeking) ... 42
6.2 Environmental parameters & Experience (HP skills) ... 42
6.3 Environmental parameters & Driver state (Sleepiness) ... 42
6.4 Environmental parameters & Task Demand (Workload) ... 44
6.5 Environmental parameters & Culture (Country) ... 45
6.6 Summary matrix of interactions ... 46
7. Vehicle model ... 47
7.1 Car model ... 47
7.2 Train model ... 48
8. Conclusions ... 50
vi
List of Figures
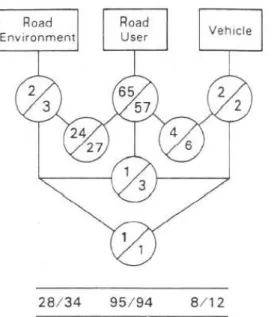
Figure 1 –Road user, Environment & Vehicle contribution to crashes ... 9
Figure 2 – DVE (A) model ... 12
Figure 2a - DVED (from Fletcher et al., 2005)... 12
Figure 2b– Proposal of adaptation of the DVED for train domain ... 13
Figure 3 – classification of unsafe acts (Reason, 1990 in Weller et al., 2006) ... 15
Figure 4 – Model of situation awareness (Endsley, 1995 in Jin, 2008) ... 16
Figure 5 - Qualitative model of BA (Rudin-Brown & Noy, 2002) ... 18
Figure 6- Relationship between stress, strain and performance (Fastenmeier and Gstalter, 2007) .... 27
Figure 7 - Driving task classification and the analysis of requirements (Fastenmeier & Gstalter, 2003) ... 32
Figure 8 - segments of curve driving task (Campbell et al., 2008) ... 32
Figure 8a – task analysis for approach segment ... 33
Figure 8b - task analysis for curve discovery segment ... 33
Figure 8c - task analysis for entry and negotiation segment ... 34
Figure 8d - task analysis for exit segment ... 34
Figure 9a - subtask "Prepare movements""(Vanderhaegen, 1999; Vanderhaegen, 2001) ... 35
Figure 9b Tree of the subtask "Drive" (Vanderhaegen, 1999; Vanderhaegen, 2001) ... 35
Figure 9c - subtask "Stop" (Vanderhaegen, 1999; Vanderhaegen, 2001) ... 36
Figure 9d - subtask "Pilot" (Vanderhaegen, 1999; Vanderhaegen, 2001) ... 37
Figure 10 –clear vs. obstructed sight distance ... 39
Figure 11 - An outline transactional framework for driver stress (Matthews, 2002) ... 41
Figure 12 - The simplest possible representation of a vehicle manoeuvring in the ground plane (from Blundell and Harty, 2004, p. 140) ... 47
Figure 13 – model of fatigue (from May & Baldwin, 2009) ... 52
vii
EXECUTIVE SUMMARY
The first work package (WP1) contains a critical review and synthesis of human behaviour models of drivers of road vehicles, trains and maritime vessels (ships). Based on this review a reference model of Driver–Vehicle–Environment is developed. A variety of approaches to modeling driver behaviour are possible as options. The literature review covers the more widely cited of these. Generally, these might be categorized as either 'Descriptive' models which can only describe the driving task in terms of what the driver has to do or 'Functional' models which are able to explain and predict drivers' performance in demanding situations and drivers' behaviour in typical ones. It seems that the optimal approach might be a hybrid of several types of models. In recent years, a variety of driver support and information management systems have been designed and implemented with the objective of improving safety as well as performance of vehicles. While the crucial issues at a technical level have been mostly solved, their consequences for driver behaviour remain to be fully explained. To reach this goal predictive models of the interaction of the driver with the vehicle and the environment are necessary. The aim of the European Project AIDE was to integrate all in vehicle support and information systems in a harmonized user interface (Saad, 2006). The ITERATE project will take this further by developing it into a unified driver model that is also applicable to other transport domains.
The first deliverable in this work package (D1.1) presented a critical review of Driver-Vehicle-Environment (DVE) models and most relevant drivers' parameters and variables to be implemented in such models, in different surface transport modes and in different safety critical situations. The aim of this deliverable (D1.2), succeeding D1.1 is to describe and detail the Unified Model of Driver behaviour (UMD), define the environmental parameters to be implemented and their relationships with the driver variables. The proposed model will be used to support design and safety assessment of innovative technologies and make it possible to adapt these technologies to the abilities, needs, driving style and capacity of the individual drivers. The model will also present the environmental parameters, different road and traffic scenarios with different weather and visibility conditions to be simulated in the test phases. The scenarios of traffic that are independent of the activities carried out by the vehicle and driver will be simulated. The model is simplified in the sense that traffic conditions (density, complexity) are not sensitive to the 'test' driver and vehicle behaviour, but remain fixed in a given trial. Thus, within the constraints of this pioneering effort, only the behaviour of the test driver is variable, while the environment and vehicle are defined as parameters with fixed values.
The environmental parameters will consider driving behaviour and performance from the point of view of how drivers perceive, attend, etc. environmental situations to make choices and respond to those situations. The aim is to model how these situations are related to errors, reaction time and risk factors. Particular attention will be paid to the identification of the most risky and critical scenarios; Safety-critical situations that may require emergency actions such as: Obstacle avoidance or gap judgment in passing manoeuvres. Therefore, the DVE model should include those parameters from the environment which drivers indicate as the most attention demanding. The environmental parameters will be synthesized into a preliminary joint DVE model.
8
1. INTRODUCTION
Using transportation is an everyday practice, a lived experience characteristic of the modern world, but one that is basically taken for granted. People are using different transportation modes such as cars, buses, trains, ships or aircrafts. Driving is central to the lives and deaths of many (Lee, 2008). Road traffic injuries are consistently one of the top three causes of death for people aged between 5-44 years. More than 1.2 million people die on the world's roads every year, and as many as 50 million others are injured (World health statistics, 2008).
Hundreds of articles on driving and driver behaviours have been published during the past years. Lee (2008), in his "Fifty Years of Driving Safety Research" review, claims that substantial improvements in driving safety were seen within the past 50 years; Whether as a result of improved crash-worthiness and passive safety systems (e.g. airbags) or active safety systems (e.g. collision warnings) which promise substantial safety benefits by enhancing driver performance and behaviour so drivers avoid crashes. However, these benefits will be realized only if drivers rely on these systems appropriately and if these systems help drivers behave more safely. Likewise, responding to persistent safety problems, such as alcohol, fatigue, and the emerging problem of distraction, will require systems that improve driver behaviour. A shift in societal norms with regard to what constitutes acceptable behaviour substantially reduced alcohol-related crashes, and a similar response may be needed to address dangerous driver behaviour associated with fatigue and distraction, as well as to further reduce alcohol-related crashes. Technology, particularly which monitors driver behaviour and shares this information could play an important role in changing norms and the driving culture. To a large extent, current and past research has explored similar themes and concepts. Many articles published in the first 25 years focused on issues such as driver impairment, individual differences, and perceptual limits. Articles published in the past 25 years address similar issues but also point toward vehicle technology that can exacerbate or mitigate the negative effect of these issues (Lee, 2008). Driving a vehicle may be described as a dynamic control task in which the driver has to select relevant information from a vast array of mainly visual inputs to make decisions and execute appropriate control responses. Although there are occasions when the driver has to react to some unexpected event, in general, drivers execute planned actions which are shaped by their expectations of the unfolding road, pedestrian and traffic scenario in front of them and the reality that they actually observe.
In the 1970s, major studies in the United States (Treat et al., 1977) and the United Kingdom (Sabey and Staughton, 1975) identified factors associated with large samples of crashes. The research groups, which were unaware of each other's activities, obtained remarkably similar findings. The US study found the road user to be the sole factor in 57% of crashes, the Environment in 3%, and the vehicle in 2%; the corresponding values from the UK study were 65%, 2%, and 2%, respectively. The road user was identified as a sole or contributing factor in 94% of crashes in the US study and in 95% of crashes in the UK study. The road environment was identified as a causal factor in 31% of crashes in the US study and in 27% of crashes in the UK study. (See figure 1)
9
Figure 1 –Road user, Environment & Vehicle contribution to crashes
Treat et al. (1977) found that among the environmental causal factors, view obstructions are the most frequent. Ranking second was slick roads. (Ranking third among the specific environmental causal factors was the special/transient hazards category. Ranking fourth was design problems. Ranking fifth was control hindrances. Ranking sixth was the inadequate signs and signals category. Avoidance obstructions were the seventh-ranking environmental factor. Ranking eighth was ambient vision limitations, Ranking ninth was maintenance problems and Ranking tenth was camouflage effect). Except for the first two factors all the other eight factors had less than 2%.
Another research investigating a total of 5,471 crashes during the period July 3, 2005, to December 31, 2007, have been used as a sample to obtain national estimates reported in a National Motor Vehicle Crash Causation Survey (NHTSA, 2008). Break down of case vehicles, based on the number of travel lanes and roadway flow show that of the estimated 3,894,983 case vehicles, about 52% were involved in crashes on roadways with three or more lanes, about 46% on roadways with two lanes, and a very small percentage (2.6%) in single-lane crashes. Similarly, about 62% of all case vehicles were on roadways that were not physically divided, 34% were on divided roadways, and a small percentage (4.9%) on one-way roadway.
Atmospheric and natural lighting conditions have been coded for crashes as well. Breakdown of crashes based on atmospheric conditions showed that most (74%) of the crashes occurred in clear weather, about 18% when it was cloudy, and about 9% in rainy conditions. Breakdown of crashes by natural lighting condition showed that a majority (71%) of the crashes occurred in daylight. About 13% of the crashes occurred in dark conditions, and about 10 % occurred when it was dark but lighted. The low percentage of crashes occurring at dawn or dark could be attributed to the fact that the NMVCCS sample only covered crashes occurring between 6 a.m. and midnight.
Among crashes, in which the critical reason was attributed to roadway or atmospheric conditions about 75% were related to roadway conditions, such as slick roads, view obstruction, signs and signals, road design, etc. This consisted of about 50% crashes in which the critical reason was attributed to slick roads in contrast with view obstruction that accounted for only 11.6%, and signs and signals that accounted for 2.7%. In addition, in 8.4% of the environment-related crashes, the critical reason was the weather condition, the most frequent (4.4%) being fog/rain/snow. Glare as a critical reason accounted for about 16% of the environment-related crashes.
10
Any adverse roadway condition is likely to increase the crash risk, while 16.3% of the estimated 3,894,983 case vehicles, had at least one roadway-related factor, whereas in the case of 83.6 % vehicles there was no roadway-related factor. Roadway condition (wet, slick surface, etc.) was the most common (12.2%) condition. Roadway view obstruction due to design, object, or other vehicle was relatively higher (2.1%) than the roadway geometry (1.0%), narrow shoulder or road (0.7%), and traffic sign (0.3%).
Dingus et al. (2006), in the 100 car study had parsed the crashes, near-crashes, and incidents into 18 conflict categories. These conflict categories, e.g. conflict with either a lead, adjacent or following vehicle, Single-vehicle conflict, Conflict with an obstacle in roadway or with other road user, are found in many crash databases and provide a common, consistent method to stratify the data. Within each conflict type there were factors that precipitated the event, contributed to the event, and were associated with the event.
The infrastructure category includes the factors that were fixed and did not change with the Environment: Trafficway flow: one-way traffic and divided roadway, Traffic control device: traffic signal and yield sign, Locality: interstate and residential areas, Roadway alignment or road profile: straight, level, curve, and hillcrest and Relation to junction: intersection and entrance/exit ramp. The Driving environment consists of conditions that change on a daily or hourly basis; Surface condition: wet and snowy, Lighting: streetlamps and daylight, Traffic density: stable flow, restricted speed, and restricted flow and Atmospheric conditions: clear and raining.
Results for the single-vehicle crashes revealed that infrastructure and driving environment were considered to be contributing factors in 29% of the crashes; Weather and visibility was a factor in 8% of the crashes, roadway alignment was a factor in 13% of the crashes, and roadway delineation was a factor in the remaining 8% of the crashes. Glare was considered a contributing factor in two of the crashes (one was due to sunlight and the other was reflected glare). Another crash was due to a visual obstruction. The infrastructure and driving environment were considered to be a contributing factor in 23% of the single vehicle near-crashes. Roadway alignment (14%) was the biggest contributor in this category. Weather and visibility was a factor in 4% of the near-crashes, and road sight distance was a factor in one near-crash. Glare (4%) was considered a contributing factor in two of the crashes. An additional near-crash was due to a visual obstruction. As for the single vehicle incidents the infrastructure and driving environment were considered to be a contributing factor in 10% of the. Roadway delineation (6%) was the biggest contributor in this category. Weather and visibility was a factor in 2% of the incidents. Roadway alignment was a factor in two incidents, and road sight distance was a factor in one incident. Glare (4%) was considered a contributing factor in 7 incidents, with 5 being due to sunlight and two being due to headlamps. An additional incident was due to visual obstruction due to a hill or curve.
In the case of Lead-Vehicle Crashes, when an interaction occurred between the subject vehicle and the vehicle directly in front of it, the Environmental factors were not judged to be a strong contributing factor, with only one crash being due to weather and visibility. This is somewhat surprising when reviewing the associated factors, which indicated that over 40% of the crashes included inclement weather and wet or snowy surface conditions. Not surprisingly, traffic flow was fairly strongly associated with the lead-vehicle crashes, with only 33% being in free flow conditions. The infrastructure associated with the crashes was straight and level in most of the crashes (87%), with one third of the crashes being intersection related. A single crash indicated that reflected glare was a contributing factor. In the case of Lead-Vehicle Near-Crashes, none of the driving environment factors were identified as contributing, and only 1 percent of the infrastructure factors were
11
identified as contributing. Three near-crashes identified road delineation as a contributing factor. Weather was not as strongly associated with the near-crashes as with the crashes, with only 8% of the near-crashes including inclement weather and 12% including wet surface conditions. Only 21 of the near-crashes were identified as free-flow traffic, again showing the prevalence of heavy traffic as an associative factor for lead-vehicle conflicts. As in the crashes, the road was straight and level in most of the lead-vehicle near-crashes (87%). Approximately 22% of the lead-vehicle near-crashes were intersection-related. As for the lead-Vehicle Incidents; none of the driving environment factors were identified as contributing, and only one crash infrastructure factor (i.e., roadway delineation) was identified as contributing. Weather was not a large associated factor, with no inclement weather and only two wet surface associated conditions. Only 4 of the 12 crashes were in free flow conditions. Roadway alignment may have played a role, with 42% of the crashes being on curves. Two-thirds of the crashes were intersection-related.
The road infrastructure conveys a wealth of information that guides drivers’ activity and their interactions with others in situ (explicitly through devices such as road signs and road markings, and implicitly by means of environmental context and road layout, for example). In the broadest sense, the road environment comprises the vehicle, the road infrastructure and other road users. It also includes the rules that govern the use of the road infrastructure and interactions with other road users. For this specific context of DVE modeling, the concept of the environment makes reference to any external conditions and surroundings to the vehicle, that is to say, road, traffic and weather & Visibility conditions. (AIDE D1.1.4)
Inadequate conditions of causal factors such as; confusing layout, misleading signage, poor road surface condition and confusing rules / regulations or environmental conditions e.g. weather and lighting, can potentially impact road user behaviour and performance in a way that can potentially lead to road user errors being made ( Stanton et al., 2009).
The objective of this project is to use research from the different transportation domains and to use the differences and similarities between the domains to develop a unified model for driver performance / behaviour in safety critical situations which could be used across transportation modes. The focus is on creating a structured model that can be used in real time, in particular with an operator assistance system to (1) monitor driver state and performance, (2) predict how momentary risk is changing, (3) anticipate problem situations and (4) in response adjust the behaviour of in-vehicle information systems and driver assistance systems and feedback to the driver. The driver model would therefore be the major component of a larger model supervising the interaction among driver, vehicle and the traffic and road environment.
The first work package of ITERATE (WP1) started with a critical review and synthesis of existing models of human behaviour for drivers of road vehicles, trains and vessels (D1.1). Based on this review a model of Driver-Vehicle-Environment is proposed identifying elements that can be used to predict momentary risk. This document consists of the following sections; Dependent variables - Predictable quantities that represent driver performance measured by errors and reaction time and also driver behaviour measured by comprehension of risky vs. safety situations. Factors influencing driving safety - in our modelling architecture these factors are: Attitude and personality, Experience, Driver sate, Task demand and Culture and The selected driver independent variables are: Sensation seeking, Hazard perception skills, Fatigue, Subjective workload and Country. The first two sections are overlapping D1.1. This document provides also Task Analysis principles to be applied within the scenarios which will be detailed in WP3. Furthermore, Environmental Parameters influencing driving safety (Road / Track / Fairway characteristics and traffic scenarios with different visibility conditions)
12
and their interaction with the selected driver variables, as it will be implemented in the ITERATE simulation tool, are described. As the focus of the model and simulation is mainly on the Diver, this Deliverable contains only short descriptions of the vehicle model.
The model will be built by considering driving behaviour and performance from the point of view of how drivers perceive, attend, etc. environmental situations to make choices and respond to those situations. The aim is to model how these situations are related to errors, reaction time and risk factors. Therefore, the DVE model should include those parameters from the environment which drivers indicate as the most attention demanding. A conceptual model, in its most general version, is presented in Figure 2. According to this model the ADAS can serve both as a sensor of driver, vehicle, and environmental states AND as an activator of interventions that affect the driver, vehicle, and environment. More specific versions are described below for the two vehicle systems that will be evaluated by all partners (cars and trains) and the two technological interventions that have been selected for evaluation in this study (Collision avoidance and Speed management).
Figure 2 – DVE (A) model
Concerning the car framework, we can learn about drivers' behaviour by their actions and observations including the interactions with the environmental parameters, the vehicle model and ADAS. See figure 2 for schematic interactions.
13
The train driver has a smaller degree of freedom during driving. He has no control on the direction of the vehicle; but can act on the velocity of the vehicle. However parameters introduced in the DVED can be used for describing the interactions (see Figure 3).
Figure 2b– Proposal of adaptation of the DVED for train domain
Modifications were introduced in the model proposed by Fletcher (Fletcher et al., 2005):
The "Driver observation monitoring" in the train corresponds to the use of the Driver's Safety Device, which indicates no problem concerning the driver state. The driver is able controlling the train commands yet. For these reason the picture representing the Driver is not the driver himself, but it is the command board on which is the button he pushes to acknowledge his ability in driving. The one-way arrow linking The Driver Assistance System and the Driver was changed by a double arrow. In the train cabin, the Driver Assistance System are in charge of warning the driver about a change of signalling (AWS, …) or about an over-speed of the train (ATP, ..), for example.
Track scene monitoring Vehicle Track Train command systems (pedal, buttons, handle)
14
2.
DEPENDENT VARIABLES
When discussing safe or unsafe driving behaviour the dependent variable most frequently used are accidents. Traffic safety is often equalled to the inverse of accidents. However, traffic safety is more than the mere absence of accidents. Ranney (1994) argued that "we must go beyond accidents if we are to understand driving behaviour". In this project we decided to focus on three dependent variables that represent driver performance measured by errors and reaction time and also driver behaviour measured by comprehension of risky vs. safety situations.
2.1 Error propensity (slips, lapses, mistakes, violations)
Various taxonomies of human error have been proposed. Within the literature on human error, three perspectives currently dominate. These are Norman’s (1981) error categorization, Reason’s (1990) slips, lapses, mistakes and violations classification and Rasmussen’s (1986) skill, rule and knowledge error classification (Stanton, 2009).
Slips and lapses are defined by behaviours related to attentional failures and memory failures which might impact driver safety (Wickens, 2008). Both slips and lapses are examples of where the action was unintended; either inattention (e.g., failing to perform at critical moments, especially when the driver intends to do something unusual – such as deviating from the normal route on the way home from work) or over attention (e.g., performing at the wrong moments). Slips relate more directly to psychomotor components of driving at the operational level of control and refer to events in which the planned action would have achieved the desired goal; the right intention is incorrectly executed, e.g. when a driver who plans to push the brake pedal to slow down inadvertently pushes the accelerator pedal, the intention was correct but the execution was erroneous. While, Lapses represent the failure to carry out any action at all, errors bases on forgetfulness (e.g. a driver forgetting to turn off the lights when departing the car, although fully intended to do so). Lapses are of particular relevance to roadway accidents as they reflect errors in skill based or automatic behaviours (Reason, 1990, Ranney, 1994). On the contrary, mistakes occur when driver intentionally performs an action that is wrong (e.g. when a driver decides to accelerate when the right action would have been to brake or slow down), as a result of limitations in perception, memory and cognition. Mistakes initiate at the planning level, rather than the execution level and are likely to precipitate inappropriate manoeuvring decisions. Although both rule- and knowledge-based mistakes characterize intentions that are not suitable for the situation, there are some differences between the two. Rule-based mistakes tend to be made with confidence (misapplication of a good procedure, e.g. performing a task that has been successful before in a particular context), while knowledge-based mistakes are more likely to appear in a situation in which rules are not applicable and the operator becomes less certain (application of a bad procedure, e.g. performing a task that is ‘‘unsuitable, inelegant or inadvisable” at the most basic level). The knowledge-based mistakes will also involve much more conscious effort, and the chances of making a mistake while functioning at this level are higher than they are at a rule-based level since there are so many more ways in which information acquisition and integration may fail (Reason, 1990, 1997). Reason (1990) defines the term violations as “deliberate deviations from those practices deemed necessary to maintain the safe operation of a potentially hazardous system” (p.195). In the case of driving this would be deliberate deviations from accepted procedures, standards and rules of safe driving (i.e. speeding), and research has shown that these violations are statistically associated with enhanced crash involvement (Lindgren et al., 2007). Comparing violations with errors, Reason (1990) states that errors should be related to the individual cognitive processes while violations concern the social text in which they occur. Errors may therefore be minimized by retraining, memory aids and better human-machine interfaces. Violation, on the other hand, should possibly be dealt with by trying to
15
change users’ attitudes, beliefs and norms, and by improving the overall safety culture (Lindgren et al., 2007). See figure 4 for error classification.
Figure 3 – classification of unsafe acts (Reason, 1990 in Weller et al., 2006) 2.2 Transformations of Reaction time to discrete events
Often, the terms "reaction time" and "response time" are used interchangeably, but reaction time is always a part of the response time. Reaction time is also called perception-reaction time. The total reaction time can be split into three components : (1) mental processing time (the time required for the driver to perceive the sensory input and to decide on a response), (2) movement time (the time used to perform the programmed movement, such as lifting the foot from the accelerator and touching the brake), and (3) device response time (the time the physical device takes to execute its response, such as the time needed to stop the car after brake engagement). Because the mental processing time is an internal quantity that cannot be measured directly and objectively without a physical response, it is usually measured jointly with movement time (Setti et al., 2006)
Brake reaction time (RT) is a parameter of driving behaviour that has not only attracted the interest of researchers but is also of great importance in road design and accident litigation process. Among other things, brake RT is used in assessing stopping sight distance, which determines road design required for a certain design speed. In accident litigation, the legal process often tends to determine whether the participant driver reacted to the impending collision within “acceptable” time, in which acceptability is established from a certain percentile of RT distribution thought to represent the driver population (or relevant fraction of it) in relevant conditions. (Summala, 2000)
2.3 Projection of current situation to risky vs. safe situation
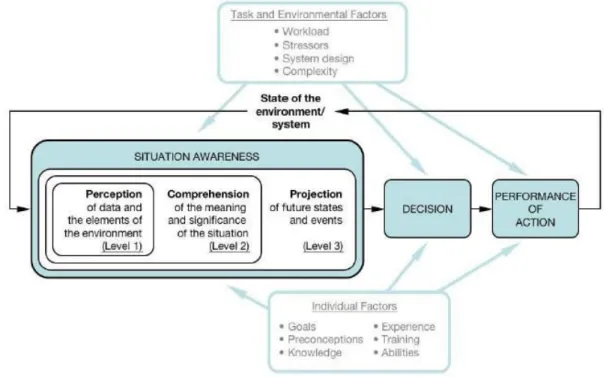
Endsley (1995) defines situation awareness as “the perception of the elements in the environment within a volume of time and space, the comprehension of their meaning, and the projection of their status to the near future” (Endsley, 1995, p. 36 in Shinar, 2007) Loss of situation awareness has been found to be a significant causal factor in accidents and incidents in transportation domains. (Stanton, 2009)
We intend to investigate the effects of the selected independent variables on the 3rd level of SA meaning the projection of current situation to risky vs. safe driving behaviours. See figure 5
16
Figure 4 – Model of situation awareness (Endsley, 1995 in Jin, 2008)
3. FACTORS INFLUENCING DRIVING SAFETY & SELECTED
DRIVER VARIABLES
3.1 Attitudes/ personality
Attitudes / Personality mean a complex mental state involving beliefs, feelings, values and dispositions to act in certain ways. These are static parameters that affect the input data of the driver model (i.e., their values do not change during the dynamic simulation of a case study) associated with each driver (Cacciabue & Carsten, 2009).
Research of road accidents began a hundred years ago, and, as it developed, it clarified the dominant role of human characteristics, whether paying insufficient attention or erring in processing information and in decision-making (see e.g., Shinar, 1978). A large proportion of the studies and theories developed in the past to understand these factors emphasized the relationship between personal characteristics and driver behaviour (Elvik and Vaa, 2004 in Factor et al., 2007). These studies dealt principally with various personality components that lead to accident proneness, risk-taking, and driving over the speed limit. Other studies analyzed attention disorders while driving, the effect of fatigue, aggressive and violent driving, gap acceptance for crossing intersections, and more (Factor et al., 2007).
3.1.1 Sensation Seeking
Several authors (Jonah et al. 2001; Rudin-Brown and Noy 2003; Rudin-Brown and Parker 2004 in Cacciabue & Saad, 2008) have put the emphasis on some general personality traits, such as ‘‘sensation seeking’’ and ‘‘locus of control’’. These personality traits are assumed to influence, more or less directly, the occurrence of behavioural adaptation either through a general tendency for risk compensation (for ‘‘high sensation seekers’’) or a propensity to manifest over-reliance in automation (for ‘‘external LOC’’) (Cacciabue & Saad, 2008).
17
sensation Seeking is defined as "seeking of varied, novel, complex and intense sensations and experiences and the willingness to take physical, social, legal and financial risk for the sake of such experience" (Zuckerman, 1994). Some publications showed physiological correlations with sensation seeking (Jonah, 1997, Zuckerman, 1994) it is operationally defined in terms of scores on questionnaires namely the Sensation Seeking Scale (SSS-V Zuckerman, 1994) or the Arnett Inventory of Sensation Seeking (AISS, Arnett, 1994). Most articles show correlation between Sensation Seeking & some aspects of risky driving. (Weller et al., 2006)
The search concerning sensation seeking identified no scientific articles as regard to train driving. The search revealed that the topic has been identified and discussed in the area of driver selection and recruitment and that train drivers (e.g. RSSB, 2006) should not be sensation-seekers and risk-takers was identified as a selection criteria. The conclusion was to avoid sensation seekers because train drivers must tolerate long periods of low stimulation without seeking thrills or taking risks. This discussion can also be related to the fact that drivers must tolerate monotony and work situations with little stimulation without trying to engage in risk behaviors to increase simulation. Drivers must also be able to cope with highly irregular working hours. These issues were discussed in results from the TRAIN-project (Kecklund et al., 2001). An important issue is however, that the automatic safety systems such as ATC and ERTMS, restricts the drivers actions to a large extent and thus prevents sensation-seeking behavior. Research on driver selection criteria has been identified as an important research topic in the railway domain.
No research has been found in shipping and the maritime domain considering sensation seeking, which is assumed to have a natural explanation. Most studies performed are aimed to penetrate other issues and aspects of commercial professional shipping where sensation seeking is not an issue. However, as high-speed boats, such as rib-boats, water jets etc., are becoming more available for the consumer and adventure/recreation market the assumption is that this will change in the near future, given the existing legislation in Europe. For example, in Sweden have the Swedish Maritime Administration noticed the issue, even though no action have been taken (Dahlman, et al., 2008).
3.1.2 Effect of sensation seeking on the dependent variables
The model of Rudin-Brown and Noy (2002), proposes that behavioural adaptation to new in-vehicle systems will be influenced by personality in the form of locus of control and sensation seeking as well as by trust in the system. (See figure 6) this model offers the prospect of predicting the direction and relative magnitude of adaptation effects. (Carsten, 2009)
18
Figure 5 - Qualitative model of BA (Rudin-Brown & Noy, 2002)
Personality and driving behaviour have strong correlations (Sümer, Lajunen & Ozkan, 2005). Jonah (1997) argued that most studies found significant positive relations between SS and aspects of aggressive and risky driving (e.g. driving while impaired, speeding, following too closely) see for example Dahlen & White, 2006. Sensation-seeking significantly predict violations (Schwebel et al., 2006, 2007, Machin and Sankey, 2006, 2008). Furthermore, high sensation seekers with high level of attention are more likely to have a higher number of traffic violations and errors (Ayvaşık et al., 2007). The sensation seeking variables (thrill & adventure and disinhibition) had significant indirect influence on accidents and offences mediated by the violations and mistakes factors (Rimmo & Aberg, 1999). SS explain the variance of the tendency to take risks occasionally less well than the tendency to take risks frequently (Desrichard & Denari, 2005).
3.2 Experience
Experience is the accumulation of knowledge or skills that result from direct participation in the driving activity; static parameters that affect the input data of the driver model (do not change during the dynamic simulation of a case study) associated with each driver (Cacciabue & Carsten, 2009).
For any given situation, a novice driver must, under the time constraints of driving, be able to quickly select the cues that are indicative of a hazard, integrate them into holistic patterns, comprehend their implications, project how the situation may evolve into a potential accident, and select the necessary action from his or her repertoire of driving behaviours. The more experience a driver has, the greater the repertoire of situations and schemata he or she has in long term memory. Thus, with experience the driver learns to effectively select the cues to attend to, quickly perceive their meanings, and on the basis of these cues quickly identify the situation and project its implications into the immediate future. Using scripts built through past experience this driver then controls the vehicle in a very effective manner. This mode of driving is very effective because behaviours are guided by partial information that has been previously organized into complete situations which in turn are linked to pre-established behaviour sequences. Thus, much of the driving can be automated, and when a totally unexpected hazard (e.g. one never encountered before) is encountered the driver still has spare capacity to deal with it. The novice driver, in contrast, does not
19
have all of these benefits of experience and therefore must attend to more stimuli, which necessitate slower driving in environments that are not as complex in order to build up the necessary skills and repertoire of experiences. As this driver accumulates experience, more and more of the driving scene is recognized through schemata and more and more of the behaviour is automated; allowing the driver to better attend to other driving tasks, or to time-share the driving with non-driving tasks. (Shinar, 2007) Yet, the issue whether driving experience provides better performance when the driver engages in use of in-vehicle systems is debatable. In general, it can be concluded that driver Situation Awareness increases with experience as static knowledge will increase for predicting future driving environment states and deciding on driving actions (Jin, 2008). However, McKenna and Crick (1997) concluded that a secondary auditory-verbal task had a detrimental effect on hazard perception for both novice and experienced drivers. Sagberg and Bjørnskau (2006) conversely found that increased mental load imposed by a mental arithmetic task resulted in impaired hazard perception only for the male novice drivers, and not for drivers in general. The discrepancy may be due to differences in the difficulty of the secondary task. McKenna and Farrand (1999) found that both experienced and inexperienced drivers suffered considerable interference to their hazard perception skills in the presence of a secondary speech task. Interestingly, the more experienced drivers suffered greater interference. Apparently, hazard perception is demanding and when attention is drawn to other tasks, the ability to detect hazards will decrease. The improvement of hazard perception skills may be a result of learning to identify situations in combination with automation of other driving tasks, thus reducing the mental workload and leaving more mental capacity for the hazard detection task. It would appear that the more you have, the more you have to lose. In terms of hazard perception skills the secondary speech task converted the experienced drivers into poor novices (McKenna, 2006). While both experience and age are important, research indicates that experience is clearly more important than age in determining the relative risk levels of young drivers. Risk levels for both young males and females are extremely high immediately following licensing for solo driving, but reduce significantly in the first six to 12 months. Risks then reduce more gradually in line with experience over the remainder of the first two to three years of solo driving. However, it does take that long – i.e. two or three years at least – before risk levels for young drivers approach the levels of older drivers (OECD, 2006). In the train domain, Barrier removal (BR) is a safety-related violation, and it can be analyzed in terms of benefits, costs, and potential deficits. The proposed method can be used, on the one hand, to foresee/predict the possibility level of a new/changed barrier (prospective analysis), and on the other hand, to synthetically regroup/rearrange the BR of a given human–machine system (retrospective analysis) (Zhang et al., 2004). A reinforced iterative formalism to learn from intentional human errors called barrier removal and from uncertainty on human-error parameters has been proposed (Vanderhaegen et al., 2009). The iterative learning formalism is based on human action formalism that interprets the barrier removal in terms of consequences, i.e. benefits, costs and potential dangers or deficits. Two functions are required: the similarity function to search a known case closed to the input case for which the human action has to be predicted and a reinforcement function to reinforce links between similar known cases. This reinforced iterative formalism is applied to a railway simulation from which the prediction of barrier removal is based on subjective data. We applied both these methods to the BR analysis on twenty people who participated in the simulator experiment as ‘traffic controllers’. They came from different countries, had different educational levels and different regional performance characteristics.
20
Another experimental protocol was run on the COR&GEST platform which involves a miniature railway structure on which several trains can move. It integrates both a supervision interfaces to manage remotely signals and devices such as points and a driving interface for each train. Seven inexperienced human operators behaviour were studied during the train driving activities with or without any technical failure occurrence (Vanderhaegen, 2009). The occurrence of barrier removals or of disturbances makes some human operators more aware of the danger or the performance control.
3.2.1 Hazard perception skills
There is an increased interest in driver’s ability to detect hazards during the last decade. Hazard perception (HP) skills include discovering, recognizing and reacting to potentially dangerous situations (OECD, 2006). Hazard perception ability has been found to correlate with crash risk (Smith et al., 2009) and is a critical skill that distinguishes experienced drivers from novice drivers (Horswill and McKenna, 2004). Experience is a key influence on hazard perception, independent of age (Ahopalo, 1987 cited in OECD, 2006).
Although young drivers perform better than older drivers on visual and motor skill tasks, they crash more frequently during the first few years of driving, which may reflect underdeveloped hazard perception skills. The most cited article published in 'Human Factors' concerning driving safety showed that novice drivers scan the road differently than experienced drivers do (Mourant & Rockwell, 1972 in Lee, 2008), indicating that different search strategies are being used by these groups, which influence their steering control. Lee (2008) argue that examination of driver eye movements confirms these findings by showing that the eye movements of inexperienced drivers focus more on guiding lateral control than on hazard detection, leading to diminished hazard awareness that may increase novice drivers’ crash risk (Lee, 2008).
Typically, measuring hazard perception latencies (reaction time) and/or assessments of the degree of perceived hazard associated with various traffic scenes includes either simulated photographs/ pictures or 'animated' hazards in scenario-based video clips/ films, however, seldom with real-life traffic situations (Sagberg & Bjørnskau , 2006, Sümer et al., 2007).
Concerning train driving the concept of hazard perception skills was applied in a quite broad sense, including for example strategies used to manage the allocate attention and to perform the driving task. Drivers' allocation of attention was found to be influenced by the aspect of the approaching signal and the aspect of the signal just passed (e.g. Elliott et. al., 2007, Merat, et. al., 2009). This will influence the driver's ability to detect hazards because the driver can be assumed to be more vigilant if a restrictive signal aspect has been passed.
Route knowledge has been identified as important for the driving task (e.g. Luther, 2007). Some studies showed that a driver machine interface which is not well designed will increase subjective workload and also time to take action (e.g. Gibson et al., 2007, McLeod et al., 2005). These factors are important for the drivers' timely identification and prediction of hazards.
Other studies have shown that high level of automation decrease vigilance (e.g. Spring et al., 2009) and that time at task give vigilance decrements. Decreased vigilance will probably have a negative effect on hazard perception skills.
Drivers' incomplete understanding of the automatic functions due to inadequate DMI design makes it difficult to maintain adequate situation awareness when automation takes over (e.g., Harms, et al., 1996, Olsson, 2001). Skill-based, reactive behavior is then applied in response to warning signals
21
and sounds and sometimes only the warning signal is cancelled without the driver performing the safety braking task (e.g. McLeod et al., 2005). Several studies have shown that driver behavior is adapted to the behavior of the warnings and support systems. For example McLeod et al. (2005) showed that AWS increased the risk of Signals Passed at Danger (SPAD). An ATC system with insufficient DMI promotes a reactive driving style (e.g. Olsson, 2001).
Two different driving styles, reactive and proactive could be identified (Jansson, et al., 2005). The proactive style is characterized by development of situational awareness and route knowledge used to predict situations which can occur further down the line. The reactive style is characterized by awaiting signs and signals, e.g. warning sounds from ATC before acting. Dorrian et al. (2007) has also showed that drivers switched from a proactive to a reactive driving style with increased sleepiness and fatigue and that the braking behavior was less efficient. More research is needed to confirm the findings presented in the studies presented above.
In the maritime domain, few studies have studied hazard perception as a separate concept. Some studies look at closely related concepts, such as a high-speed navigation field study (Dahlman, J., Forsman, F., Sjörs, A., Lützhöft, M., Falkmer, T. 2008) and an interview study with maritime pilots (Darbra, Crawford, Haley, & Morrison, 2007). The high-speed navigation study used two levels of experience (expert and novice) and two runs through the navigated track (at high and lower speed). Measures taken were eye-tracking and observations. The results show that fixation durations became shorter in the high speed condition but there was no significant difference in fixation duration between novice and experienced across both conditions. It was also found that experienced navigators rely more on environmental cues and the paper chart and less on other navigational aids compared to the less experienced.
3.2.2 Effect of hazard perception skills on the dependent variables
Several studies have shown that experienced and expert drivers detect hazards better (e.g. McKenna and Crick, 1991 and 1994 in OECD, 2006) and faster (Sümer, 2007, Klauer et al., 2008, Horswill et al., 2008, Smith et al., 2009) than novice drivers. However, others did not report such differences (e.g., Borowsky et al., 2007; Sagberg & Bjornskau, 2006).
Experienced drivers are better than novice drivers at detecting far hazards (Brown, 1982 in Shinar, 2007, Drummond, 1996 in OECD, 2006). Drummond (2000) found that poor hazard perception was associated with increased risk of fatal or serious crashes but not minor crashes or crashes overall, especially during the first year post-test. Renge (1998 in OECD, 2006) found significant correlations between high hazard perception scores and high risk rating of the situations and between high hazard perception scores and lower speed choice. Grayson (1998, cited in OECD, 2006) found that drivers who were rated by driving examiners “as being attentive, safe, and skilful drivers, and as having good anticipation and good speed setting abilities” on the road tended to have faster response times in a hazard perception test. Watts and Quimby (1979 in OECD, 2006) found a significant correlation between drivers’ reaction time to hazards and their road crash frequency over the previous three years, McKenna and Crick (1991 in OECD, 2006) found that those with a higher number of crashes over the previous two years were worse at the hazard perception test, after taking into consideration the effects of age and mileage. Quimby et al. (1981, 1986) and Maycock et al. (1991) also showed that hazard perception skills relate to potential for crashes, especially for inexperienced drivers. (OECD, 2006)
22
McKenna and Horswill (2006) have shown that appropriate hazard perception training not only improves the time to detect hazards it also results in a reduction in risk taking as indexed by speed choices. Borowsky et al. (2007) argued that experienced drivers learn to avoid hazards to which inexperienced drivers must respond. When the hazard was imminent all drivers responded at the same time.
Results from studies of incident reports related to train driving show that errors at the skill and rule-based level were the most common (e.g. Edkins et. al., 1997). Sustained attentions were the most salient factors contributing to accidents, in particular inattentiveness to railway signals. This can be due to unfavourable work environment and is probably related to the high degree of monotony in the train driver’s work. The latter cause has been identified in other studies (e.g. Kecklund, 2001). A study of SPAD occurrences (van der Flier and Schoonman, 1988) showed that the most frequently mentioned hazard was that the signal was situated behind a bend. Most SPADs took place near stations and most with arriving trains. The direct cause was often that the signal was overlooked. 3.3 Driver state (impairment level)
Driver state is the driver physical and mental ability to drive (fatigue, sleepiness etc.), a set of dynamic parameters representing aspects of the driver relevant for the human-machine interaction (AIDE D1.1.3), and subjective dynamic parameter resulting from DVE interaction (Cacciabue & Carsten, 2009).
Lee (2008) argued that alcohol and fatigue impair performance and undermine driving safety. Although the numbers of crashes and incidents attributed to alcohol and drug use is decreasing, they probably remain a significant causal factor as long as alcohol and drug abuse remain common among the population at large (Ranney et al., 2000). Drugs & Alcohol have a generally deleterious effect on performance; usually it lengthened reaction times and cognitive processing times. Incidence of alcohol involvement in accidents has been researched for many years, and has been found to be substantial. Medical Conditions – people with disabilities who drive represent a small but growing portion of the population as technology advances in the field of adaptive equipment. Studies and data show that such driver's performance is indistinguishable from the general driving population. Although there are doubtless a number of people on the highways with illnesses or conditions for which driving is contraindicated, they are probably not enough of these to account for them in any traffic flow models (Koppa, 2003).
Because the inclusion of an experiment using alcohol/drugs requires a more complex Institutional Review Board process - that varies among countries - we decided not to include this variable in the model validation evaluations.
Fatigue represents a less prominent safety problem that may be underreported because; unlike with alcohol or drugs, no forensic test can measure its presence. Researchers attribute between 2% and 25% of car crashes to fatigue (Lee, 2008). Karrer et al. (2004) argued that scientific definitions of fatigue are still unsatisfactory; it could be due to the ambiguity of the term “fatigue”, used for different phenomena resulting from different factors. The literature offers different terms for fatigue, such as: 'sleepiness', 'drowsiness', 'micro sleeps', 'attention', 'alertness', 'vigilance', 'performance variability', 'error vulnerability' which are used more or less synonymously. Next section will detail the term of 'fatigue' and its synonyms and explain the relevant term in this project. Considerably, the degree to which impairment influences driving performance reflects driver behaviour -drivers choose to compromise their ability to drive safely by driving while impaired. As a
23
consequence, influencing driver response to impairments may require cultural changes regarding norms of acceptable behaviour (Lee, 2008).
Fatigue remains a major factor in all transportation modes. Companies increasingly have fewer employees working longer hours to increase corporate productivity and personal income. The resulting longer work shifts may provide sufficient sleep time; however, rest periods may not promote uninterrupted sleep if they are not synchronized with the employee's circadian rhythm. This is a particular problem for both operating and maintenance staff in maritime, highway, and rail freight transportation, where work scheduling is keyed to customers’ needs, equipment reliability, and weather. Here technology shows great promise. Positive train control may improve schedule regularity. Alertness detection technologies (e.g., PERCLOS, an automated camera-drowsy driver detection device) have the potential to reliably monitor operator alertness. The Global Positioning System provides the potential for enhanced monitoring of adherence to hours of-service rules (Ranney, 2000).
3.3.1 Fatigue
Van den Berg & Landstrom (2006) illuminated a serious problem with respect to sleepiness and traffic. The number of drivers with experiences of sleepiness is high. Their study supports a number of previous studies (ROSPA, 2001). Almost one-third of the drivers occasionally had to fight sleepiness while driving and about 8% of the drivers reported occasional head nodding/drops while driving. This must be considered as a serious traffic problem. The same conclusion could be drawn from the result that more than one-fifth of the drivers occasionally or more often had to stop their driving due to sleepiness.
Fatigue has three dimensions (Shinar, 2007) (1) Bodily changes, such as reductions in physiological potentials and neuron-muscular capabilities, (2) Performance changes, such as output and reaction time and (3) Subjective sensations, such as feelings of tiredness and sleepiness.
While Fatigue has been associated with task performance which can be relieved by changing the task, Sleepiness can be defined as the amount of perceived 'sleep pressure' (Vöhringer-Kuhnt et al., 2005) or the neurobiological need / physiological 'drive' for sleep (European Road Safety Observatory, 2006) typically measured in terms of sleep loss, time awake, etc. Moreover, Drowsiness is defined as a reduction of concentration (Vöhringer-Kuhnt et al., 2005) or as a transitional state from waking to sleeping and its further development can lead to sleepiness and then actual sleep to occur (Campagne et al., 2004) and Tiredness has no consensual definition and could mean lack of energy and initiative, which can be improved by rest, not necessarily by sleep (Mathis & Hess, 2009).
Saxby et al. (2007) support the theory of active and passive fatigue (Desmond and Hancock, 2001). Active fatigue results from the physical demands that are imposed upon drivers such as steering and acceleration changes, whereas passive fatigue results from underload driving tasks and monotony. While active fatigue appears to be characterized by symptoms of distress, passive fatigue appears primarily to elicit task disengagement, mental confusion and distractibility.
Fatigue can be caused by either State induced - sleep deprivation such as: lack of sleep, poor sleep or sleep demands induced by the internal body clock, or Task induced as a result of a monotonous task or 'time-on-task' (European Road Safety Observatory, 2006). To have greater control over the level of fatigue, and to reduce the costs of the experiments, we will only use task induced fatigue in the model validation studies.
24
Three physiological correlates of fatigue have been studied quite extensively: heart rate variability (HRV), blinking behaviour, and electro-encephalogram (EEG) recordings from the skull (Shinar, 2007). One of the most popular subjective measures of perceived fatigue related to the driving task is the Swedish Occupational Fatigue Inventory (SOFI) one more is the Dundee Stress State Questionnaire (DSSQ; Matthews & Desmond, 1998) assess transient states associated with stress, arousal, and fatigue, and reflect the multidimensionality of these states, how changes in task engagement (and presumably boredom) vary with the cognitive demands of the task (Matthews & Desmond, 1998, Saxby, 2007). Furthermore, the Karolinska Sleepiness Scale (KSS) is the only scale for sleepiness that has been validated in the driving context. KSS is a nine-grade scale (1 very alert and 9 very sleepy) that refers to perceived level of sleepiness (Lützhöft et al., 2007)
In the railway domain, studies of train drivers has shown that the highly irregular work hours are associated with very shorter sleep and increased sleepiness. This is due to a high proportion of early morning shifts (starting before 6.00 a.m.) and short breaks between shifts. High prevalence of severe sleepiness during early morning shifts has been reported in several studies (e.g. Härma et al., 2002, Ingre et al., 2008). Sleep quality and quantity was worse when not sleeping at home (Ingre, 2000, Jay et al., 2006, Lamond et al., 2005). Train drivers also report higher level of symptoms of insomnia compared to day-time workers but also to other shift-work groups (e.g. Ingre, et al., 2004, Hack et al., 2006). Sleepiness effects “driving style”, with more reactive “driving style” and “cognitive disengagement” with high level of sleepiness (e.g. Dorrian et. al., 2006). Long drives with no stops, combined with monotonous task increase sleepiness. (Ingre et. al, 2004)
Of the independent variables mentioned here, fatigue is probably the one which has received most attention in the marine domain. In commercial shipping over long distances fatigue is both task induced and state induced. For high speed boats, short haul shipping and leisure boats sleep deprivation may be of higher magnitude than task induced fatigue. The working situation of personnel on commercial ships is often characterized by long shift work periods, which include night-time work. The major national and international organizations concerned with shipping have become aware that fatigue is a critical problem for safe and efficient shipping, and have adopted legislations and resolutions to limit for example working hours of ship personnel (Gander, 2005; IMO, 1993; Smith, et al., 2006) .Lack of sleep is not the only factor responsible for fatigue, improper sleep quality on board is as well of importance. It has to be noted that although fatigue is receiving much attention, the number of recent field studies onboard ships is still very limited. Methods used to measure fatigue include psycho physiological measurements, standardized questionnaires, performance, and sleep logs, etc. Often the shift system (number of hours of work versus number of hour of sleep) is found to be accountable for the severity of fatigue experienced, which is not surprising, as more work and less sleep will cause higher fatigue levels. The effects of circadian rhythm are as well known: personnel working during late night hours often display higher levels of fatigue.
3.3.2 Effect of fatigue on the dependent variables
Studies have shown that lack of sleep, low sleep quality or excessive daytime sleepiness is significant predictors of driver fatigue as well as fatigue-related crashes (Van den Berg & Landstrom, 2006). Driving at times of the day that would normally be spent sleeping, or driving for prolonged periods are also associated with increased crash risk. Other studies have examined personality-related (e.g. sensation seeking and extraversion) showing an association between high levels of these factors and