PEDESTRIAN CROSSING BEHAVIOR AND COMPLIANCE AT
SIGNALIZED INTERSECTIONS
H. Joon Park, Ph.D, AICP[1], Shuzuan Li[2] New York City Department of Transportation 55 Water Street, 6th Floor, New York, NY 10041
Phone: +1-212-839-7757, Email: [1] hpark@dot.nyc.gov, [2] sli@dot.nyc.gov
Weizhe Yu[3],Weili Yang[4],NYU Polytechnic School of Engineering Email: [3] wyu07@students.poly.edu, [4] wyang02@students.poly.edu
Wael Alhajyaseen, Dr. Eng., Assistant Professor, Qatar Road Safety Studies Center / Qatar University Email: wyaseen@qu.edu.qa
Miho Iryo-Asano, Dr. Eng., Associate Professor, University of Tokyo Email: m-iryo@iis.u-tokyo.ac.jp
ABSTRACT
Most pedestrian crashes occur at crosswalks and/or within their vicinity. It may be caused by violations of traffic and pedestrian control regulations or inattention by drivers and pedestrians. There is a lack of pedestrian behavior studies on pedestrian compliances with control devices at signalized intersections in New York City. Many signalized intersections in New York City have significant pedestrian crossing volumes with varying tuning vehicle volumes. According to a behavior preference, pedestrians tend to cross a street using the shortest path in the vicinity of crosswalks at intersections while drivers try to make turns in a limited gap between pedestrians.
This study focuses on pedestrian crossing behavior and compliance to provide an effective traffic and pedestrian control policy at signalized intersections with high pedestrian volumes. Quantitative ranges of pedestrian space are correlated to qualitative descriptions that range from a full ability of pedestrians to move in their desired path to a severely constrained condition. It is understood that density is the primary factor which influences crosswalk operation in terms of the pedestrian crossing speed. However, it is necessary to find other factors which may affect pedestrian operation and safety.
As expected, the study results illustrated higher density at pedestrian facilities caused pedestrian noncompliance rates. The highest pedestrian noncompliance percentages on corner waiting and painted crosswalk marking areas were 22.9 % and 20.3 %, respectively, while the lowest noncompliance rates on crosswalk and corner standing areas were 4.0 % and 5.9 %, respectively. The crosswalk area’s noncompliance was related to trip origin/destination (i.e., bus stop) and vehicles occupying the crosswalk while corner waiting area’s noncompliance was affected by curbside lane operation (i.e., parking lane) and distance between crosswalk and stop bar of approaching traffic. In addition, the highest pedestrian violation percentages during “Flashing and steady Don’t Walk (DW)” times were 31.7 % and 11.6 %, respectively, while the lowest pedestrian violations during those phases were 14.7 % and 0.4 %, respectively. Pedestrians walk faster during Flashing DW time than during Walk time. Therefore, it is recommended that appropriate geometry design/markings and signal timing control policy will improve pedestrian compliance rate and safety of all street users. In addition, enforcement of driver and pedestrian education are also required.
1. INTRODUCTION
The crosswalk is a fundamental pedestrian facility in the urban roadway system which helps pedestrians safely cross streets. Crosswalks in dense urban areas show substantially higher pedestrian activity than in other areas. There are many other factors for pedestrian crashes such as inadequate intersection geometry, congested traffic and queues, noncompliance to traffic regulations, etc. Among them, understanding pedestrian behavior and compliance to traffic regulations are critical for the improvement of pedestrian safety. Additionally, it will also help to improve operation efficiency at signalized intersections and safety for all street users.
In 2014, with the launch of the New York City Department of Transportation’s (NYCDOT) Vision Zero Plan substantial efforts were initiated aimed at improving safety for all street users. NYCDOT conducted approximately 30-120 street improvement projects annually for intersections and corridors with high priority needs and in response to community requests in each borough. Therefore, investigation into interactions between people and pedestrian control devices and facilities, analyses of the pedestrian compliance behaviors at signalized intersections, and development of well-organized safety control policies and education programs for urban signalized intersections is required.
The current version of the HCM2010 uses pedestrian Level of Service (LOS) scores based on traveler perceptions and pedestrian density. The LOS represents service levels at urban street segments and facilities. The LOS score is a new concept for measure of effectiveness (MOE) on the typical pedestrian’s perception of the overall facility travel experience (TRB, 2010). The HCM 2010 also uses available circulation area to evaluate performance measures at crosswalks. Quantitative ranges of pedestrian space are correlated to qualitative descriptions that range from a full ability for pedestrians to move in a desired path to a severely restricted speed. Signalized intersections in New York City experience significant hourly pedestrian and traffic volumes and dynamic interactions occur between pedestrians and turning vehicles. It is expected that the pedestrian flow rate and density is the key factor influencing pedestrian crosswalk operation and compliance rates of pedestrian and traffic control devices. However, there are few behavioral studies on pedestrian compliance with traffic control devices at signalized intersections. Therefore, it is necessary to investigate factors which may affect pedestrian operation and safety. According to behavior preference, pedestrians tend to cross a street on a shortest path in vicinity of crosswalks located at intersections while drivers try to make turns in a limited gap. This paper looks at the effects of pedestrian noncompliance rates at high pedestrian crash locations. This study identifies pedestrian and traffic characteristics such as signal timing, turning vehicle volumes, and pedestrian crossing speeds at study intersections with high pedestrian crashes, comparing pedestrian noncompliance rates, and evaluating potential crash factors at signalized intersections with high pedestrian volumes. This requires a video recording survey tool and detailed analyses in order to obtain a measurable and practical compliance standard that responds to the dynamic changes of pedestrian characteristics. Study crosswalks selected have at least a 50-foot crossing distance. Crosswalk length and pedestrian speed are very important indicators to determine minimum pedestrian crossing timing and conflicting point between turning vehicles and crossing pedestrian.
2. RELATED WORKS
The average pedestrian crossing speeds at intersections with high pedestrian volumes ranged from 2.7 feet/second (ft./sec.) to 4.8 ft./sec. Although volumes of approximately 2,300 pedestrians per hour at one crosswalk may be considered high, the average walking speed was still above 4.0 ft./sec. Average speeds started to drop below 3.0 ft./sec at the pedestrian density of 0.043person/square feet (p/ft2). Substantial numbers of pedestrians who walked in crosswalks during “Flashing and steady Don’t Walk (DW)”
phases were identified in short distance crosswalks and dependent on crosswalk length and density (Park et al, 2015). Data observations for pedestrian reaction times at the 34thStreet and 7th Avenue intersection in New York City showed negative reaction times, indicating that pedestrians entered the crosswalk before the indication of walk (Peters et al, 2015).
Iryo-Asano et al. (2014) and Iryo-Asano and Alhajyaseen (2014) have analyzed pedestrian crossing decision and speed considering the impacts of the crosswalk geometry and signal timing parameters. Pedestrian maneuvers significantly differ depending on many factors, such as the timing of the crossing, signal indication, pedestrian speed, origin and destination, probability of encountering a turning vehicle, crosswalk geometry (length and width), the presence of other pedestrians on the crosswalk, age and cultural background. Such different behaviors make it difficult for drivers to correctly predict pedestrian decisions and behavior, thereby increasing the possibility that the probability of improper maneuvers will put pedestrian safety at risk. Similar results were concluded by Koh et al. (2014) and Schmitz (2011). They confirmed that the type of pedestrian signal significantly affects pedestrian behavior and crossing speed. Guo et al. (2012) modeled pedestrians’ stop-go decision at crosswalks and identified their decision as a function of their waiting time at the curb when pedestrians choose to cross although the signal indication is red (illegal crossing).
Several studies have analyzed factors that influence pedestrian illegal crossing. Wang et al. (2010) analyzed violations of pedestrian crossing behavior by focusing on crossing outside crosswalk limits. They identified several influencing factors such as existence of pedestrian attraction sites, the presence of other pedestrians, and so on. Other works such as Supernak et al. (2013), Yang and Sun (2013) and Xu et al. (2013) have proved that aspects of the crosswalk layout, such as the length, width, and presence of refuge islands, significantly affects pedestrian compliance to signals. Wang et al. (2011) studied the pedestrian compliance to signals and found that the probability of pedestrians violating a signal is influenced by the waiting time or delay, personal characteristics (e.g., age and gender), trip purpose, and traffic conditions (e.g., pedestrian flow rate and vehicular traffic volume). In a recent study, Iryo-Asano et al. (2014) have analyzed sudden changes in pedestrian’s behavior while crossing. They have confirmed that pedestrians might unexpectedly change their crossing speed (accelerating or decelerating) and maneuver near conflict areas with turning traffic. It makes drivers with no time to adjust their maneuvers to avoid severe conflicts. They concluded that the occurrence of these sudden speed changes is significantly affected by signal indication and timing as well as crosswalk length.
3. DATA COLLECTION AND ANALYSIS
3.1. Data Collection
The video data collections were conducted from 7 AM to 7 PM on October 1, 2013 and May 14, 2014 using video cameras operated by the Traffic Management Center of NYCDOT. The video data were collected in order to understand pedestrian compliance on crosswalks at the five crosswalk locations listed below:
3rd Avenue and 34th Street in Manhattan;
Madison Avenue and 42nd Street in Manhattan;
5th Avenue and 42nd Street in Manhattan;
6th Avenue and 42nd Street in Manhattan; and
The study intersections are located in various places with extremely high pedestrian activity such as Grand Central Terminal, New York Public Library, Bryant Park, a major subway station, and a community college. They are located in office and commercial areas in Midtown Manhattan, except the intersection of Queens Boulevard and Van Dam Street, which is characterized by academic/ institution land uses. The later intersection is located at the northeast corner of LaGuardia Community College in Queens. All study locations have close access to public transit including subway stations within three blocks. In fact, the 42nd Street intersections are located one block from subway stations and Grand Central Terminal within a quarter mile radius.
Analysis periods were then selected; weekday PM peak hour (5-6 PM) based on video data observations for pedestrian volumes. To explore influences of crossing distance on pedestrian compliance, all these crosswalks have countdown signals, and high pedestrian volumes.
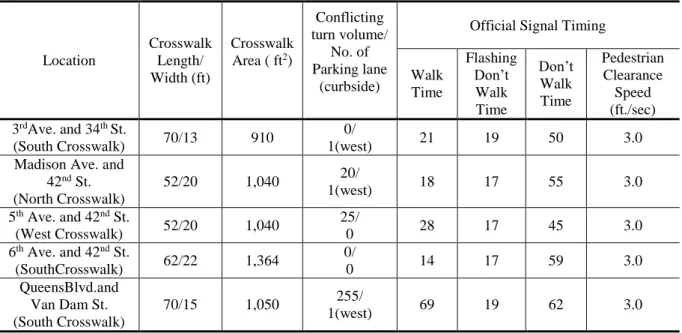
42nd Street intersections have full eastbound and westbound turn prohibitions between 7 AM and 7 PM except buses at Madison and 5th Avenues as well as eastbound turn prohibition between 7 AM and 7 PM except buses and westbound truck right-turns at 6th Avenue. There were twice as many illegal turning vehicles as turning bus volumes at Madison Avenue and 42nd Street. The crosswalks at Madison/5th Avenues, and 6th Avenue at 42nd Street are 52- and- 62 feet long, respectively. Although two other study locations with approximately 70-foot crosswalk length allow vehicle turning movements, the south crosswalk at the intersection of 3rd Avenue and 34th St has no conflicting turning movements with crossing pedestrians because 3rd Avenue is a northbound one-way street. Third, Madison and 6th Avenues are northbound one-way streets while 5th Avenue is a southbound one-way corridor. Tables 1 and 2 provide study location characteristics and illustrate crossing and corner areas.
TABLE 1: Study Location Characteristics.
Location Crosswalk Length/ Width (ft) Crosswalk Area ( ft2) Conflicting turn volume/ No. of Parking lane (curbside)
Official Signal Timing
Walk Time Flashing Don’t Walk Time Don’t Walk Time Pedestrian Clearance Speed (ft./sec) 3rdAve. and 34th St. (South Crosswalk) 70/13 910 0/ 1(west) 21 19 50 3.0
Madison Ave. and 42nd St. (North Crosswalk) 52/20 1,040 20/ 1(west) 18 17 55 3.0 5th Ave. and 42nd St. (West Crosswalk) 52/20 1,040 25/ 0 28 17 45 3.0 6th Ave. and 42nd St. (SouthCrosswalk) 62/22 1,364 0/ 0 14 17 59 3.0 QueensBlvd.and Van Dam St. (South Crosswalk) 70/15 1,050 255/ 1(west) 69 19 62 3.0
Table 2: Study locations - crossing and corner areas.
Corner Waiting Area Crosswalk Area
3rd Ave. and 34th St. (South Crosswalk)
Madison Ave. and 42nd St. (North Crosswalk) 5th Ave. and 42nd St. (West Crosswalk) 6th Ave. and 42nd St. (South Crosswalk)
Queens Blvd. and Van Dam St. (South Crosswalk)
3.2. Pedestrian Crash
New York City has approximately 12,430 signalized intersections according to September 2015 statistics. Study intersections had different pedestrian crash patterns as shown in Table 3. The intersection of Third Avenue and 34th Street experienced 24 pedestrian injuries from 2009 to 2013 which was identified as the highest pedestrian injury location among the study locations and 50th highest pedestrian injury location among all signalized intersections in New York City. Although study intersections are in the top 15th percentile for high crash locations, 6th Avenue and 42nd Street, and Queens Boulevard and Van Dam Street showed relatively lower injuries, a total of seven. Only pedestrian crashes involving bus or truck were identified at Queens Boulevard and Van Dam Street. The proportion of crash injuries with turning vehicles were approximately 11-14% at intersections with turn prohibitions while they were approximately 67%-72 % at intersections without turn prohibitions. Therefore, turn prohibitions help to reduce pedestrian crash injuries at intersections.
Table 3: Pedestrian crash injuries (2009-2013)at study intersections.
Location Crash Injury Rank Crash Injury With Left Turn Vehicles With Right Turn Vehicles
Other Cases Total Crashes 3rd Ave. and 34th St. 50 th 8 (33%) 8 (33%) 8 (33%) 24 (100%) Madison Ave. and 42nd St. 79 th 1 (5%) 2 (9%) 19 (86%) 22 (100%) 5th Ave. and 42nd St. 153 rd 2 (11%) 0 (0%) 16 (89%) 18 (100%) 6th Ave. and 42ndSt. 1,629th 2 (29%) 1 (14%) 4 (57%) 7 (100%) Queens Blvd and
Van Dam Street 1,422
nd 2 (29%) 3 (43%) 2 (29%) 7 (100%)
3.3. Data Reduction and Analysis
To investigate pedestrian characteristics, major and minor movement crossing speeds including speeds in ”Walk” interval and Flashing ”Don’t Walk (FDW)” interval, and density through video snapshots were collected at three targeted crosswalks of 52, 62, and 70 feet long, respectively. Pedestrian speed and compliance analyses, speed-density relation were introduced to model approximately 190 combined cycle observations on pedestrian crossings at study intersections in New York City.
The pedestrian density were varied over time. Usually, the maximum density of each cycle was observed during the Walk interval. The snapshot of maximum density of each cycle was taken to calculate the pedestrian platoon density at that time. At crosswalks, pedestrian crossing times were measured by the duration from the instant they stepped onto the crosswalk to when they left the crosswalk (i.e., from curb to curb). Two pedestrians in the middle of the platoon were selected during the Walk interval and applicable FDW interval to estimate the average walking speed for these two intervals, which was used as the average speed of the selected platoon. Figure 1 shows the speed during Walk interval and density relationships at study locations. Speed-density relation illustrates a stochastic distribution rather than a
linear relation. The maximum density observed at study crosswalks were approximately 0.09 p/ft2. As density increases, speed is decreased from free flow speed of approximately 5.5 ft/sec to the approximately 2.0 ft/sec. The intersections of Madison Avenue and 42nd Street and Queens Blvd and Van Dam Street draws commuters and students every day due to adjacent Grand Central Terminal and LaGuardia Community College. The intersections of 5th and 6th Avenues at 42nd Street includes substantial numbers of shoppers and tourists because of adjacent land use characteristics such as Bryant Park, Time Square, and commercial areas which attract large numbers of visitors daily. It is interesting that in the same density level, the pedestrian speeds at communters and students oriented locations are higher than thoses at mixed-use locations including tourists and shoppers.
Figure 1: Speed-density Relationship.
Figure 2 shows clear cumulative distribution of pedestrian crossing speed in both Walk interval and FDW interval at study locations. Based on the comparison of pedestrian walking speeds during Walk and FDW intervals, pedestrian walking speeds during the FDW interval are higher than during the Walk interval. When the signal changes to FDW, pedestrians rush into the crosswalk at higher speeds. This is in accordance with the observations reported by Iryo-Asano et al. (2015), that pedestrians may unexpectedly change their speed due to several reasons such as the change to FDW interval which might lead to severe conflicts with turning traffic. Furthermore as Zhang (2013) indicated, pedestrian’s inattention to conflicting turning vehicles may contribute to crashes at crosswalks.
Most distinctive speed increase between Walk and FDW intervals was identified at the intersection of 5th Avenue and 42nd Street which has a higher density crosswalk with a shorter distance of approximately 52 feet. Besides high density, this location indicated that the turning buses and pedestrians including substantial travelers and shoppers induced lower crossing speeds during the Walk time. A lower density crosswalk with a longer crossing distance of 70 feet also showed significant crossing speed increases during the Walk interval to FDW interval. However, 6th Avenue and 42nd Street presented very similar speeds between Walk and FDW intervals. Those who entered the crosswalk during Walk
time encountered FDW time in the middle of the intersection due to a very short Walk time of 14 seconds. They did not increase their crossing speed because their crossing completion during the FDW interval was assured.
The average 15th percentile pedestrian speed is used for designing clearance interval at signalized intersections. The 2009 MUTCD generally recommends using a walking speed of 3.5 feet per second (ft/sec) for calculating pedestrian clearance interval. The NYCDOT employs strict criteria for pedestrian interval. A speed of 3.5 ft./sec represents standard guideline for calculating pedestrian crossing time at signalized intersections in New York City while senior areas or school zones use a pedestrian crossing speed of 3.0 ft./sec. All study inetsections have a crossing speed standard of 3.0 ft./sec but pedestrians walked with much faster speed beyond standard design speed range.
Figure 2: Cumulative Distribution of Crossing speed in W Interval and FDW Interval.
Design speed range for pedestrian interval
Design speed range for pedestrian interval
4. PEDESTRIAN COMPLIANCE AT STUDY CROSSWALKS
A pedestrian facility is designed with human beings body depth and shoulder breadth for minimum space standards. HCM 2010 defines body ellipse of 2 feet by 1.5 feet. It will need a buffer area of an extra 2 inch body depth. Stride movement is an important factor which influences pedestrian behavior. An approach to model human movements on stride length and its correct adaptation has been introduced in the pedestrian dyanmics field (Sivers and Köster, 2015). When the movements of a stride are distrupted and stopped, pedestrians transition from walking behavior to a standing condition. However, crosswalks are designed to move pedestrians from one end to another end through signal timing allocation for pedestrian and vehicular traffic. During walking behavior, pedestrians maintain minimum personal space to avoid collisions with other pedestrians. They tend to adjust their speeds by changing stride lengths in different density levels and at bottlenecks. As density increases, pedestrian speed decreases. Smaller strides in dense situations causes speed reduction (Seyfried et al, 2010). Therefore, it is expected that in dense crosswalks, pedestrians attempt to walk beyond crosswalk boundaries or to utilize illegal crossing phases such as Flashing and steady DW intervals.
Table 4 explains pedestrian compliance rates on control measurements at study crosswalks in New York City. Pedestrian volumes ranged from hourly 868 pedestrians to 4,270 pedestrians. The highest pedestrian noncompliance rate at the crosswalk area was approximately 20.3 % at 5th Avenue and 42nd Street while the noncompliance at corner standing area was approximately 22.9 % at Madison Avenue and 42nd Street. These crosswalks have the shortest length at approaximately 52 feet with high hourly pedestrian volumes of 4,270 and 3,924, respectively, during the weekday PM peak hour. Crosswalk marking noncomplaince rates were increased when vehicles remain on crosswalks because of congestion or signal timing changes or when pedestrians directly moved toward their destination, such as a nearby bus stop. In addition, there was construction near the northwest corner of Madison Avenue and 42nd Street, as shown in Table 2. It caused extremely high pedestrians’ noncompliance rate of approximately 46 percent on the corner space at the northwest corner at the intersection. Pedestrians tended to use the curbside parking lane as a corner reservior area. In addition, pedestrian noncomplaince rates at corner waiting areas were increased when located as a far-side crosswalk in a one-way street approach, when the distance between crosswalk and stop bar for crossing traffic is longer.
The lowest pedestrian noncompliance percentages at crosswalk and corner waiting areas are 4.0 % at Queens Boulevard and Van Dam Street and 5.9 % at 6th Avenue and 42nd Street, respectively. Both curbsides of the south crosswalk at 6th Avenue and 42nd Street were occupied by northbound left- and right-turning vehicles. It resulted in a very high compliance rate for the corner standing area. However, the highest pedestrian violation on Flashing and steady DW intervals occurred at 6th Avenue and 42nd Streeet with 31.7 %, and at 3rd Avenue and 34th Street followed with 31.2 %. At these locations, it was occasionally observed that pedestrians walked out from a corner before Walk time started and continued to cross during clearance and all red times. They have longer crossing distance and shorter Walk time. Queens Boulevard and Van Dam Street showed the lowest pedestrian violations on Flashing and steady DW intervals, and steady DW interval at 14.7 % and 0.4 %, respectively. Sixth Avenue and 42nd Street had the shortest Walk time of 14 seconds for pedestrians which induced significant violations on Flashing and steady DW intervals while Queens Boulevard and Van Dam Street with the longest Walk time of 69 seconds, showed the lowest noncompliance rates. Therefore, based on emprical data related to this study, higher pedestrian noncompliance with control devices such as crosswalk markings and corner areas, and Flashing and steady DW intervals may exist at not only high density crosswalks ranging from 0.05-0.09 p/ ft2 but also low density crosswalks with a longer crosswalk length over 70 feet and lesser pedestrian Walk time.
Table 4: Pedestrian compliance rates during the weekday PM peak hour (5-6 pm).
Location Pedestrian Compliance Type EB / NB WB / SB Total
3rd Ave. and 34th St.
(South Crosswalk)
Total Pedestrian and
Percentage 467 100.0% 401 100.0% 868 100.0%
Corner Waiting Area
Violation 69 14.8% 53 13.2% 122 14.1%
Crosswalk Area Violation 95 20.3% 38 9.5% 133 15.3%
Flashing and steady
Don't Walk Time Crossing 150 32.1% 121 30.2% 271 31.2%
Steady Don't Walk (Red) Time
Crossing 65 13.9% 36 9.0% 101 11.6% Madison Ave. and 42nd St. (North Crosswalk)
Total Pedestrian and
Percentage 2,260 100.0% 1,664 100.0% 3,924 100.0%
Corner Waiting Area
Violation 1,037 46.0% 276 16.6% 900 22.9%
Crosswalk Area Violation 204 9.0% 224 13.5% 428 10.9%
Flashing and steady
Don't Walk Time Crossing 349 15.6% 431 25.9% 780 19.9%
Steady Don't Walk (Red) Time
Crossing 102 4.5% 111 6.7% 213 5.4%
5th Ave. and 42nd St.
(West Crosswalk)
Total Pedestrian and
Percentage 1,613 100% 2,657 100.0% 4,270 100.0%
Corner Waiting Area
Violation 105 6.5% 372 14.0% 477 11.2%
Crosswalk Area Violation 285 17.7% 583 21.9% 868 20.3%
Flashing and steady
Don't Walk Time Crossing 367 22.8% 563 21.2% 930 21.8%
Steady Don't Walk (Red) Time
Crossing 12 0.7% 33 1.2% 45 1.1%
6th Ave. and 42nd St.
(South Crosswalk)
Total Pedestrian and
Percentage 1,337 100% 2,463 100.0% 3,800 100.0%
Corner Waiting Area
Violation 101 7.6% 124 5.0% 225 5.9%
Crosswalk Area Violation 220 16.5% 474 19.2% 694 18.3%
Flashing and steady
Don't Walk Time Crossing 335 25.1% 870 35.3% 1,205 31.7%
Steady Don't Walk (Red) Time
Crossing 33 2.5% 150 6.1% 183 4.8% Queens Blvd. and Van Dam St. (South Crosswalk)
Total Pedestrian and
Percentage 920 100% 966 100% 1,886 100.0%
Corner Waiting Area
Violation 151 16.4% 119 12.3% 270 14.3%
Crosswalk Area Violation 45 4.9% 31 3.2% 76 4.0%
Flashing and steady
Don't Walk Time Crossing 160 17.4% 117 12.1% 277 14.7%
Steady Don't Walk (Red) Time
5. CONCLUSIONS AND RECOMMENDATIONS
Pedestrian density at crosswalks affect not only pedestrian crossing speeds but also pedestrian compliance to control device at signlaized intersection. This study illustrates that pedestrian compliance rates vary depending on other factors, such as curbside lane type, distance between crosswalk and stop bar from approaching traffic, crosswalk length, vehicles occupying the crosswalk, duration of pedestrian walk time, and trip purpose and destination. Empirical study using video data identified the following observations regarding pedestrian compliance with control devices at signalized intersections:
First, pedestrian noncompliance within crosswalk areas was highest, approximately 20.3 %, at the west crosswalk of 5th Avenue and 42nd Street. As density on corner reservoirs increased beyond acceptable pedestrian levels, approximately 46.0 % stood in the parking lane at Madison Avenue and 42nd Street. Both locations with heavy pedestrian volumes had the shortest length of approaximately 52-foot among the studied crosswalks. Secondly, a near-side crosswalk from approaching traffic without a parking lane caused pedestrians to remain in the corner waiting area but induced higher noncompliance on pedestrian Walk time when pedestrians peceived that Walk time is not enough, as obseved at 6th Avenue and 42nd Street. Thirdly, the lowest pedestrian noncompliance percentages on crosswalk area, FDW and steady DW intervals, and steady DW interval occurred in the longer crosswalk of approximately 70-foot located at Queens Boulevard and Van Dam Street which had a very long Walk time of 69 seconds. However, at 3rd Avenue and 34th Street with same crosswalk length was identified with high noncompliance rates in those categories of 15.3%, 31.2 % and 11.6 %, respectively, because there were vehicles occupying the crosswalk and shorter Walk time. Lastly, pedestrians walk faster during flashing DW time than during Walk time. Pedestrians often understood FDW time as an extension of pedestrian Walk time and noncompliance rates on FDW ranged from 14.3% to 26.9 %. Therefore, it is recommended to consider pedestrian and traffic control policy such as appropriate crosswalk areas and bus stop locations, curb extensions at parking lanes, as well as appropriate Walk and FDW time control policies which can be based on crosswalk density thereby possibly improving pedestrian compliance rates and safety. In addition, enforcement and education of drivers and pedestrians may improve all users’ safety at intersections.
These findings were based on a limited data set without considering effects of drivers’ noncompliance on control devices. Further analysis would be necessary to develop more generalized quantitative models considering a more varied geometry, effective pedestrian Walk time and vehicle violation factors on control devices are required. It will help to further explain pedestrian behaviors and compliance. This paper also identifies further data reduction possibilities for nation-wide crosswalk locations with an extensive data set.
REFERENCES
Guo, H., Wang, W., Guo, W., Jiang, X. and Bubb, H. (2012).Reliability analysis of pedestrian safety crossing in urban traffic environment, Safety Science, 50(4), pp.968-973.
Iryo-Asano, M., Alhajyaseen, W., Zhang, X. and Nakamura, H. (2015). Analysis of Pedestrian Speed Change Behavior at Signalized Crosswalks. Proceedings of the Road Safety & Simulation International Conference, Orlando Florida, pp. 1606-1618.
Iryo-Asano, M., Alhajyaseen, W., and Nakamura, H. (2014).Analysis and Modeling of Pedestrian Crossing Behavior during the Pedestrian Flashing Green Interval. IEEE Transactions on Intelligent Transportation Systems, Vol. 99, pp. 1-12.
Iryo-Asano, M., and Alhajyaseen, W. (2014).Analysis of Pedestrian Clearance Time at Signalized Crosswalks in Japan”, Procedia Computer Science, Elsevier, Vol. 32, pp. 301-308.
Koh, P.P., and Wong, Y.D. (2014).Gap Acceptance of Violators at Signalized Pedestrian Crossings. Accident Analysis and Prevention, Elsevier, Vol. 62, pp. 178–185.
Manual on Uniform Traffic Control Devices (MUTCD) (2009). Federal Highway
Administration, Washington, D.C.
Park, H.J., Yang, W., Yu, W., Wagner, I. and Ahmed, S. (2014) An Investigation of Pedestrian Crossing Speeds at Signalized Intersections with Heavy Pedestrian Volumes. Transportation Research Record, Volume 2463.
Peters, D., Kim, L., Zaman, R., Haas, G., Cheng, J., & Ahmed, S. (2015). Pedestrian Crossing Behavior at Signalized Intersections in New York City. In Transportation Research Board 94th Annual Meeting (No. 15-5975).
Schmitz, J.N. (2011). The Effects
of Pedestrian Countdown Timers on Safety and Efficiency of
Operations at Signalized Intersections. In: University of Nebraska – Lincoln, Civil
Engineering Thesis, Dissertations, and Student Research, Paper 28.Seyfried, A., Boltes, M., Kähler, J., Klingsch, W., Portz, A., Rupprecht, T., Schadschneider, A., Steffen, B., and Winkens, A. (2010). Enhanced empirical data for the fundamental diagram and the flow through bottlenecks, W.W.F. Klingsch, C. Rogsch, A. Schadschneider, M. Schreckenberg (Eds.), Pedestrian and Evacuation Dynamics 2008, Springer, Berlin Heidelberg, pp. 145–156.
Sivers, I. von and Köster, G. (2015).Dynamic stride length adaptation according to utility and personal space, Transportation Research Part B 74 pp 104–117.
Supernak, J., Verma, V., and Supernak, I. (2013). Pedestrian Countdown Signals: What Impact on Safe Crossing?. Open Journal of Civil Engineering, Vol. 3, pp. 39–45.
The City of New York (2014).Vision Zero Action Plan, http://www.nyc.gov/html/visionzero/pdf/nyc-vision-zero-action-plan.pdf, Accessed March 31, 2015.
Transportation Research Board (TRB) (2010). Highway Capacity Manual 2010.TRB.
Wang, Y., Zhu S., Wang, H., Liu, B. and Li, M. (2010).Characteristic Analysis of Pedestrian Violation Crossing Behavior Based on Logistics Model.International Conference on Intelligent Computation Technology and Automation, IEEE, Changsha, China, 2010, pp.926-928.
Xu, Y., Li, Y., and Zhang, F. (2013). Pedestrians’ Intention to Jaywalk: Automatic or Planned? A Study Based on a Dual-process Model in China. Accident Analysis and Prevention, Elsevier, Vol. 50, pp. 811-819.
Yang, Y., and Sun, J. (2013). Study on Pedestrian Red-time Crossing Behaviors: Integrated Field Observation and Questionnaire Data. Transportation Research Board (TRB) 92nd Annual Meeting, Washington DC, USA.
Zhang.X, (2013). Modeling Pedestrian Walking Speed at Signalized Crosswalks Considering Crosswalk Length and Signal Timing.Proceedings of the Eastern Asia Society for Transportation Studies, Vol.9.