Micro Drivers behind
the Changes of CET1
Capital Ratio
An empirical analysis based on the results of EU-wide
stress test
MASTER DEGREE PROJECT THESIS WITHIN: Business Administration NUMBER OF CREDITS: 15 ECTS
PROGRAMME OF STUDY: International Financial Analysis AUTHOR: Dan Luo & Yajing Ran
i
Abstract
Title: Micro Drivers behind the Changes of CET1 Capital Ratio: An empirical analysis based
on the results of EU-wide stress test
Authors: Dan Luo and Yajing Ran Advisor: Haoyong Zhou
University: Jönköping International Business School, Jönköping University, Sweden Subject: International Financial Analysis, Business Administration
Background: Stress tests have been increasingly used as a part of the supervisory tool by
national regulators after the financial crisis, which can also be used to conduct authorities’ supervisory for determining bank capital levels, assessing the health of a bank.
Purpose: The main purpose of this study is to assess whether some micro factors play
important roles on the changes of Common Equity Tier One Capital Ratio (between the bank accounting value and the stress testing results under the adverse scenarios). Our secondary purpose is to investigate if our empirical results will help to provide some theoretical suggestions to regulators when they exercise stress tests.
Method: An empirical analysis by using Panel Data, introducing GARCH model to measure
volatility.
Empirical foundation: The results of EU-wide stress tests and bank financial statements Conclusion: The coefficient associated with non-performing loans to total loans is positively
significant and the coefficient associated with bank size is negatively significant. In addition, the financial system of strong banks is better to absorb financial shocks. These findings are useful, as banks is a reflection of the financial stability of an economic entity, we can use these findings as another reason to pay attention to the process of the stress testing rather just stress testing results.
Key words: EU-wide Stress Testing, Bank Capital Structure, EU Banks, Determinants, Panel Data Analysis, GARCH Model.
i
Acknowledgements
We would like to take this opportunity to express our gratitude to everyone supporting us and involved in the writing of this Master Thesis. We would especially like to thank our supervisor Haoyong Zhou, who guided us through the whole process and helped us to challenge ourselves. We would also express our special appreciation towards our thesis seminar group, for supporting us throughout the whole process and helping us by asking challenging questions to make us approach the research from different sides.
Lastly, we would like to show our gratitude to our friends and family members, who have given us useful insights and feedback on our topic, during and especially at the end of our research.
___ ___ ___ ___ Dan Luo Yajing Ran
ii
Table of Contents
1
Introduction ... 1
1.1 Background ... 1
1.1.1 Overview of EBA Stress Test ... 1
1.1.2 Bank capital structure ... 3
1.2 Problem discussion... 5
1.3 Purpose ... 7
1.4 Limitations ... 7
1.5 Outline ... 8
2
Theoretical framework ... 8
2.1 Previous research about Bank capital ... 8
2.1.1 Bank Capital ... 8
2.1.2 Role of bank capital ... 10
2.1.3 Capital requirements ... 11
2.2 The common methodology of EU-wide stress test ... 13
2.2.1 Overarching Framework for Stress Testing ... 13
2.2.2 Methodology by risk calibration ... 16
2.2.3 Transparency ... 16
2.3 Microeconomic factors affecting bank performance. ... 17
2.3.1 Previous research on both internal and external determinants ... 17
2.3.2 Basel III and Micro drivers ... 18
3
Methodology and data ... 21
3.1 Sample construction and empirical approach ... 21
3.1.1 Pooled regression model ... 24
3.1.2 Random Effects Model... 24
3.1.3 Fixed Effects Model ... 25
3.2 Research model ... 26
3.3 Description of Control variables ... 27
3.3.1 Bank-level control variables... 27
3.3.2 Country-level control variables ... 29
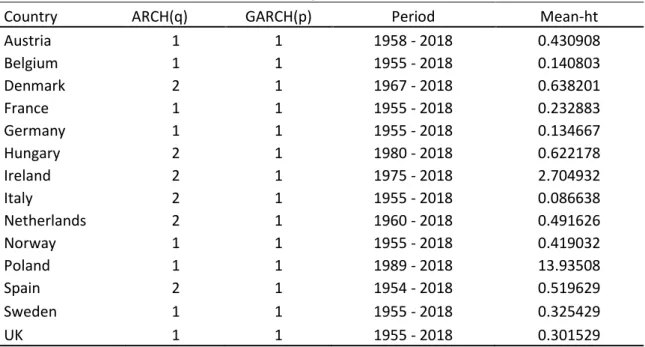
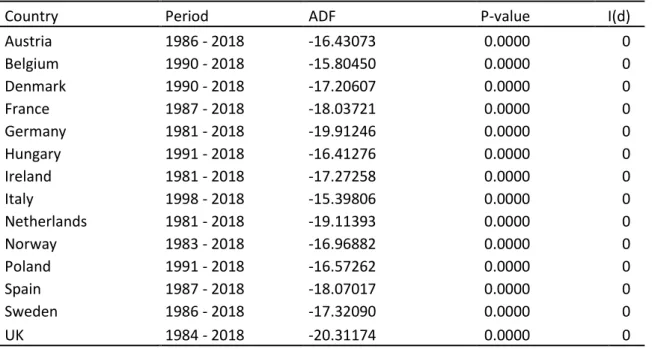
3.3.3 ARMA-GARCH forecast model for inflation volatility ... 31
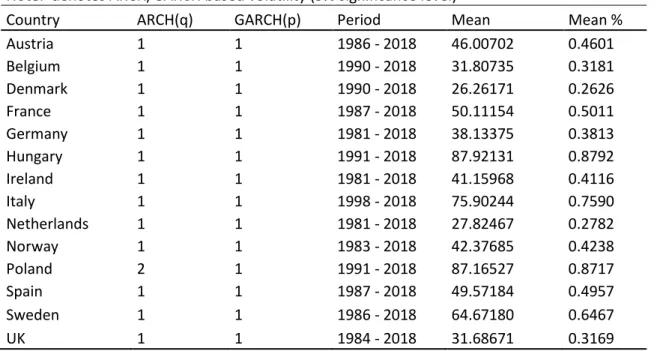
3.3.4 ARMA-GARCH forecast model for stock market volatility ... 33
3.4 Descriptions of independent variables and research hypothesis ... 34
3.4.1 NPL Ratio and CET1 capital ratio ... 34
3.4.2 Loan-to-deposit ratio and CET1 capital ratio ... 35
iii
3.4.4 Efficiency ratio and CET1 capital ratio. ... 36
3.5 Data collection ... 37
3.5.1 Stress Test Data ... 37
3.5.2 Bank Level Data ... 38
3.5.3 Process of data ... 38
4
Empirical results and Analysis ... 40
4.1 Results of the model diagnostic process ... 40
4.1.1 Pooled & REM regression... 40
4.1.2 Fixed effects models ... 42
4.2 The final empirical results ... 45
5
Discussion ... 49
5.1 Methodology concerns ... 49
5.2 Transparency concerns ... 52
5.3 The CET1 capital ratio ... 52
6
Conclusion ... 53
6.1 Suggestions for further research ... 54
iv
Figures
Figure 2.1 Banks’ Capital Structure (Assets side) ... 9
Figure 2.2 Banks’ Capital Structure (Liabilities & Net worth side) ... 9
Figure 2.3 How capital requirements effect on bank capital structure ... 12
Figure 2.4 General framework for stress testing methodology ... 13
Figure 2.5 General framework for stress testing methodology ... 17
Figure 5.1 The inflation volatility of five countries from 1989 to 2018 ... 50
Figure 5.2 The stock market volatility of six countries from 1989 to 2018 ... 51
Tables
Table 2.1 The roles of the institutions and national supervisors ... 14Table 2.2 Calibration of capital requirements and buffers ... 18
Table 2.3 Overview of the main literature on bank capital and determinants ... 20
Table 3.1 Correlation matrix... 23
Table 3.2 Unit root test for the inflation (dlog(CPI)*100),5%... 32
Table 3.3 Descriptive statistics in inflation volatility ... 32
Table 3.4 Unit root test for the stock market volatility ... 33
Table 3.5 Descriptive statistics in stock market volatility% ... 34
Table 3.6 Description of dependent variable... 37
Table 3.7 Descriptive Statistics ... 39
Table 4.1 Pooled & REM regression ... 41
Table 4.2 Residual Diagnostics (Histogram-Normality Test)... 41
Table 4.3 Correlated Random Effects - Hausman Test (REM) ... 42
Table 4.4 Effects of Micro factors on ∆CET1 Capital ratio (FEM) ... 44
Table 4.5 Residual Diagnostics (Histogram-Normality Test)... 45
Table 4.6 Redundant Fixed Effects Tests (Likelihood Ratio)... 45
1
1
Introduction
________________________________________________________________________ _ __ _
The introduction chapter will present the topic of the study, discuss the problem of the topic which will culminate into a specific research question and the purpose of the study.
_______________________________________________________________________ _ ___
1.1
Background1.1.1 Overview of EBA Stress Test
Stress tests have been increasingly used as a part of the supervisory tool by national regulators after the financial crisis, which can also be used to conduct authorities’ supervisory for determining bank capital levels, assessing the health of a bank. In addition, stress test does play a crucial role in managing risk with an effective way on the one hand and help bankers and investors get to know the likely losses that stress testing banks may suffer under diverse scenarios on the other hand. The European authorities regard the stress testing supervisory benchmarks, especially the Common Equity Tier One Capital Ratio, as a common foundation to assess the resilience of the European financial sectors (banks) to relevant shocks (Oana-Maria et al., 2017). In America, the outcomes of the Federal Reserve’s bank stress tests have become more predictable and the stress test process matures and becomes more reliable, as many consulting firms and software vendors have been involved to standardize and simplify the process of stress testing for individual banks (Glasserman, P. et al., 2015). Regulators not only take responsibility for requiring banks to construct models under exceptional, but plausible scenarios, but also supervise the final results provided by individual banks (i.e. the implication of CET1 Capital Ratio, the leverage ratio and the loss rate on bank’ credit exposure). As for the bank side, bankers need to allocate large human and financial resources to comply with the guidelines issued by regulators and to adjust their capital structure at a fairly granular level.
Authorities aim to construct a comprehensive risk management framework for banking sectors away from the emergence of future incidents, especially some unexpected ‘incidents’. Stress testing technique is a significant component of such a framework. The EU-wide stress test is coordinated by the EBA through a Bottom-up approach, where the common stress scenarios (presented in terms of deviation of macroeconomic variables), methodology and various supervisory benchmarks are provided by supervisor, and individual banks compute stress test results using their own internal models, following
2
EBA methodological requirements. According to the EBA, the Bottom-up approach can most effectively leverage on banks’ models that are tailor-made to their specific risks and combine the advantages of the Bottom-up approach with those of Top-down.
The macro-economic (baseline & adverse) scenarios of the 2011 EU-wide stress test cover the horizon 2011-2012, while the scenarios of the 2014,2016 and 2018 EU-wide stress tests were applied over 3 projection years. The baseline scenario is mainly based on the GDP changes, for example, the baseline scenario of 2011 stress test is projected to grow by about 1.7% in 2011 and by about 2% in 2012. The adverse scenario developed by authorities is composed of a set of shocks based upon the some assumed relatively worse macro-economic environment. The EU-wide stress test is conducted on a bank‐by‐bank basis, all banks apply the common methodology developed by the EBA, which means all banks must translate the macro-economic scenarios provided into a set of banking internal parameters (e.g. income, expenses and loan losses…) to construct their own models. The stress test of 2011 was conducted by the EBA and covered 90 banks accounting for 65% of the whole EU banking sectors. Significant information about sovereign exposures was provided by the tests. The Euro-wide stress test in 2014 across the sample of 123 European banks covering almost 22 trillion banking assets in total to the exercise, which approximately accounted for 80% of EU banks’ total assets. In 2016 and 2018, the Euro-wide stress test was carried out on a sample of 51 and 48 banks respectively, both of which accounting about 70% of the total assets of all EU-banks.
It is noticeable that the disclosure level of the bank examination process is different within diverse economies. In Europe, the EBA take responsibility for analysing the EU-wide stress test results and discloses the examination results tested by requiring EU banking sectors, while the situation is complicated in America, where the debate of whether bank-specific stress test results should be disclosed or not has been a recurrent subject. Berlin, M. (2015) suggests that if the regulatory model is relatively inaccurate, then making the result public tend to be more optimal. However, the disclosure of the stress testing result does help the ongoing supervisory efforts to construct a stable foundation for negotiation between the prudent financial institutions and the banking sectors. Under the regulation of Basel III International, the CET 1 capital ratio is one of the most important implications of a bank’s financial health and capital adequacy. Basel III illustrates that all banks must have at least a level of 4.50% (CET 1 capital to risk-weighted assets (RWA) ratio) since 2015 (4.0% in 2014), a minimum Tier 1 capital ratio of 6% since 2015 (5.5% in 2014) of risk-weighted assets, and a minimum total capital ratio of 8% of RWA by 2019 (note that
3
there are slightly different standards required by the committee over different years). The EBA uses a combination requirement of the capital and liquidity stipulated by the Basel III and give some new supervisory benchmark intervals to banking sectors, which help ensure that individual banks can manage to meet the higher capital adequacy. The common equity tier 1 capital ratio is taken as an important indicator to assess that if a bank’s capital reserve is sufficient or not under different scenarios. According to the 2011 tests, 20 out of 90 banks showed a relatively low Core Tier 1 Ratio with no more than 5% from 2011 to 2012. The shortfall, on the other hand, amounted to 26.8 billion Euro. In 2014, as against 5% CT1 ratio in 2011, the hurdle rate was raised to 5.5% in the adverse scenario, and 24 banks failed the test, the shortfall amounted to 24.2 billion Euro under the adverse scenario. As we can see from the 2016 and 2018 EU-wide stress test, they do not introduce threshold to define pass or fail, instead the results of the tests will support Competent Authorities to maintain the process of repair of the European banking sector.
1.1.2 Bank capital structure
The Basel Capital Accord requires financial institutions to carry out stress tests to govern the ability of dealing with market risk. The stress test is conducted by the European Banking Authority (EBA) and accounts over 70% of the national banking-industry assets in the euro area and Norway. As we can see from the final report published by EBA, several ratios are used to evaluate and assess banks’ tolerance level for risks and their adaptability to some emergency financial events. Among all the ratios, CET1 capital ratio is the crucial one which all the regulatory authorities will pay close attention to. As can be seen from the above descriptions, Tier 1 capital is a perfect reflection of the quality of a bank’s capital - the money that a bank reserves to carry on organized operation in order perform all risky transactions. Kane, M (2009) conducts some regression based on the previous financial crisis and illustrates that capital structures with high level of leverage are a major cause of risk for financial institutions and society as a whole, the empirical results of Caprio and Harding (2009) can also support this opinion. Marcus Goldman, a famous German investment banker, used Merton’s model to examine an optimal bank capital structure and insisted an opinion that “for the banks that can pay their liabilities, raising the amount of capital is a way to increase wealth; however, for the banks that face with bankruptcy, owner’s wealth could improve after withdrawing capital.” According to this situation, Basel III defines the definition of Tier 1 capital more rigorously which means it should be
4
at least 50% of the bank’s total capital. It is obvious that a reasonable capital composition is a strong evidence of well-performed capital structure.
Does bank capital structure matter, and if so, how should it be set? As we can see from previous research (see Gorton and Pennacchi (1990)), a well-organied bank’s capital structure not only has an impact on its stability but also the creation of liquidity and credit. To some extent, bank’s capital structure also determines the source of clientele as customers show different preference for liquidity and credit. As previous analysis, through professional economic forecast and then changing several macroeconomic factors, EBA tests all the participants’ abilities of risk resistance based on different scenarios.
In our paper, we will focus on some factors of the bank itself, microeconomic factors, try to find their connection with the CET1 ratio and how these factors affect the changing behind the banking operation. In the literature, several studies tried to find the inter connection between them. Marcus (1983) hold an opinion that the capital adequacy ratio experienced a decreasing trend. By doing some empirical analysis, he held an opinion that capital adequacy ratio negatively associated with nominal interest rate and a significant positive correlation with capital structure. Meanwhile, Flannery and Rangan (1983) have shown that size of asset has a positive correlation with capital adequacy ratio. After the financial crisis broke out, many serious problems started to appear. Banking authorities began to concern about downsides of Non-Performing Loans (NPL). They used NPL ratio to evaluate proportion of Non-Performing Loans, which can describe the risk exposures. If a bank holds a large proportion of Non-Performing Loans, that is to say, the capital adequacy ratio of this bank will decline in a long run. On the other side, from the aspect of asset’s quality, a higher risk weight of non-performing loans will lead to a larger amount of risky assets. It is obvious that the capital adequacy ratio will experience a decreasing trend in the coming period. Meanwhile, if a bank owns a huge burden of non-performing assets, it will bring much negative effects on net profit and hinder the development speed and scale of the bank itself. According to Basel III treaties, from the aspects of risk management organization system, non-performing assets and internal risk rating, banking authorities should take the responsibilities of regulating the risk management behaviour of commercial banks and encouraging commercial banks to change to modern risk management mechanisms. Hancock and wilcox (2008) hold an opinion that the capital and CET1 capital ratio should have the same growth trend. The greater risk a bank faced, the larger amount of capital it should save. Thus, by controlling the amount of bank’s capital, the CET1 capital ratio can be achieved to meet safety standards, and then the credit risk
5
can be effectively controlled within a reasonable range. When it comes to the ability of profitability, we assume that it has a negative correlation with the CET1 capital ratio. We choose ROE as a standard to measure a bank’s ability to earning money. Eyssell and Arshadi (1990) conducted a research about the correlation between 27 American large banks’ stock price and their capital requirement. They tried to explore banks’ reaction to the higher requirement of capital in order that they had more chance to dig up some evidence in support of the negative correlation. To some extent, we cannot directly get the conclusion that the CET1 capital ratio has a negative correlation with stock price or ROE as it may depend on the asset size of the bank.
1.2
Problem discussionAnalyzing stress test results from the viewpoint of some important hypothesis, adds some new insights to the existing literature.
Do stress tests matter? Oana-Maria Georgescu et al. (2017) has assessed whether the 2014 and 2016 EU-wide stress tests achieved to provide new information to the market via detailed disclosures of bank balance sheet characteristics. Their paper shows that the publication of the stress tests results provided value added with respect to enhancing market efficiency.
Regulators pointed out the CET1 Capital Ratio is a fundamental standard to evaluate the resilience of the European banking sector to relevant shocks. Thomas Philippon et al. (2017), who used the CET1 capital ratio released during the stress tests to estimate banks’ predicted losses to macroeconomic shocks, provides the first evaluation of the accuracy of the EU-wide stress tests. They found out that a relatively simple statistical framework could provide an accurate description of stress test data. In addition, their paper shows that the EU-wide stress tests are informative, and the stress tests scenarios are not biased to some EU countries with ex-ante fragile banking systems.
On the one hand, the EU‐wide stress tests primarily focus on assessing the impact of macro risk parameters, so as to construct the baseline scenario and the adverse scenario for banks to apply as a common methodology and conduct stress testing. Nicolas Gambetta et al. (2017) demonstrated there was a notable negative correlation between the risk profile of the banking sectors and the EU-wide stress tests (2011, 2014, 2016) disclosed by EBA when the banking sectors’ current CET1 ratio was stressed, that is to say, stressed in the adverse scenario. Our question arises, is that meaningful for authorities consider micro parameters when they compute the common methodology of the stress test? On the other
6
hand, according to the new global regulatory standards issued by the Basel Committee, so-called Basel III agreement, that the most important ratio- the Common Equity Tire One Ratio- can somehow reflect capital adequacy ratio. Moreover, for regulatory authorities, it is crucial that they should define their toolkit for supervising the financial health of banking sectors; this led to generating the standard of “capital adequacy” in the mid-70s. Indeed, there are a lot of scholars focusing on the drivers of the bank capital adequacy ratio. Our investigation of this problem shows that discussions are divided into two distinct methodological paths.
When it comes to the focuses on finding the relationship between financial variables and banks’ capital adequacy ratio, Demsetz and Strahan (1997) conclude that banks own large size of assets are able to run with low level of capital, which means that these banks hold different various kinds of assets that could make an effort to handling the lower capital ratios, Ayuso et al.(2004) also hold the same opinion with them. Another opinion is that banks with relatively higher regulatory capital are more likely to run well (Kleff and Weber, 2008; Gropp and Heider, 2009). Furthermore, Yu (2000) demonstrated that the liquidity has a positive correlation with the capital adequacy ratio, in other words, banks did not take liquidity as a substitution of capital. Thus, it is not a good choice to use liquidity to cover risk for the entire portfolio.
While, the second common path of some researchers has attempted to consider some macro-economic variables which has the same effect as Stress Test. These studies have shown that the economic environment for each country lays on the impact of the bank-level solvency. Thus, it should be considered as a basic determinant of the capital adequacy ratio. Williams (1998) conducted a research about the impact of macroeconomic drivers on the capital adequacy ratio such as national inflation, real exchange rate, the policy of money supply, GDP, political instability, and then found out that these macroeconomic variables are significant factors of regulatory capital.
One thing should be noted that, there are still some discussions about does the static balance sheet assumption fit better than dynamic balance sheet assumption. Based on Bank of England's annual stress test, it allows banks to take the changes into consideration as the different composition and size of their balance sheets. In their common methodology, it should be clearly clarified that the changes of bank’s plan of costs and business when they calculated their reporting factors. Under this requirement, some restrictions are used as to make sure the comparability of adjustments. Such as, setting a maximum level of lending which is the current market share (see Bank of England (2016)). According to the US
7
Federal stress test, it is based on a dynamic balance sheet approach and applied top-down and bottom-up as a comprehensive testing form. The US Comprehensive Capital Analysis and review (CCAR) approves this method and uses it as a tool for regulating financial institutions. Bank’s forecast horizon could be in the light of itself corporate plans in order to reflect the expected balance sheet development. The Bundesbank (German central bank) conducted stress testing under two different assumptions, the static and dynamic balance sheet respectively. Even though, the Bundesbank stress testing applies two assumptions, the former result is taken as a measurement of ensuring comparability of result and an illustration of the counterfactual outcome without active management actions (Ramona et al., 2017). The later one is meant to explain the reasons about changes according to the exogenously and endogenously dynamical results in different composition and size of the balance sheet. The EU-wide banking stress test is run under the static balance sheet assumption in terms that assets and liabilities with the maturity of the stress testing time horizon are allowed to be replaced with better financial tools, such as currency, original maturity and credit quality. These adjustments are also consistent with IFRS1 9 stages. The adjustments in the composition and size of the balance sheet as mentioned before are not allowed in this methodology. While, the consequence of this assumption is applied in the evaluation and implementation of the banking stress test results and it will lower the reliance of results. In a nutshell, will the results be consistent under different assumptions are included in this discussion as well.
1.3
PurposeThe main purpose of this study is to assess whether some micro factors play important roles on the changes of Common Equity Tier One Capital Ratio (between the bank accounting value and the stress testing results under the adverse scenarios). Our secondary purpose is to investigate if our empirical results will help to provide some theoretical suggestions to regulators when they exercise stress tests. The study will also contribute to provide some information to policy makers, bankers and investors.
1.4
LimitationsIt is notable that the European stress test only started from the year of 2009 and have been held six times during the past ten years. Besides, countries and banks which participated
8
in the test were different each year, some countries which experienced severe financial crisis even gave up taking part in test. Although we will try to collect as much test data as possible during the process of researching, we cannot deny that there is still a defect with small sample size. Meanwhile, the process for exercising the stress test within EU involves close cooperation between authorities (the EBA, the ECB, the national competent authorities, as well as the ESRB). That is to say, some data come from the banks own financial statements which are based on various accounting standards. There is still a little chance that some banks may manipulate their financial statements in order to pass the test. Given that our adverse scenario is based on forecasting by authorities, those results cannot be approved by a real crisis.
1.5
OutlineThis paper is structured as follows. In section 2 we demonstrate the theoretical framework, which is used to analyse some micro parameters on the stressed CET1 ratio. Section 3 presents the methodology and give some description of the data we use. Section 4 outlines the empirical results and analysis of our regression outputs. Section 5 demonstrates the problem discussion and some suggestions about the EU-wide stress testing. Section 6 concludes and makes suggestions for further research.
2
Theoretical framework
________________________________________________________________________ ___ _
The theoretical framework will present the most important theories and previous academic work regarding the bank capital, EU-wide stress test and micro divers of capital ratios.
________________________________________________________________________ ___ _
2.1
Previous research about Bank capital2.1.1 Bank Capital
Bank capital has three different levels of definition. First of all, capital is an accounting residual could be calculated as using a bank’s assets minus its fixed liabilities. Second, from the side of bank owners, it is what is belong to them - the bank’s shareholders. This value could be calculated after making all the assets liquidated depends on the accounting value of themselves. In addition, for bank itself, it is always considered as a buffer that
9
helps bank to get rid of bankruptcy, at least it is able to lower the loss of bankruptcy- the point at which its liabilities are larger than the value of assets.
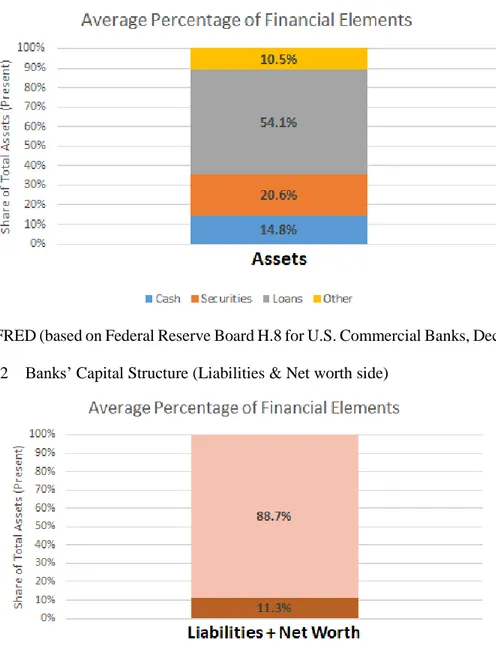
A ground-breaking paper by Modigliani and Miller (1958) demonstrated that, under the assumption of efficient market: if individual firm does not pay taxes, spend no costs on bankruptcy or agency, and without asymmetric information, financing does not matter. Because the value of the individual firm is unrelated with the framework of equity and debt. In order to show it more vividly, we use the following figure to show the balance sheet of a simple bank which funds its assets (be made up of cash, loans, securities and other instruments) with deposits and other debts, among other things which conclude the
Figure 2.1 Banks’ Capital Structure (Assets side)
Source: FRED (based on Federal Reserve Board H.8 for U.S. Commercial Banks, December 2017). Figure 2.2 Banks’ Capital Structure (Liabilities & Net worth side)
10
equity and retained earnings that assemble its net worth. The number of proportions described the average percentage of these financial elements in American commercial banking system at the end of 2017.
As we can see from Figure 2.1 and Figure 2.2, the bank’s capital accounts for 11.3% of
assets, which means the gap between total assets (100%) in Figure 2.1 and the group of deposits and other fixed liabilities (88.7%) in Figure 2.2. It has another definition as well which is as known as the bank’s leverage ratio that is the ratio of capital to assets.
It should be noted that capital could be a resource of financing that the bank can fully utilize to gain assets. Therefore, if a bank was willing to issue an extra dollar worth of equity or keep hold of an additional dollar of earnings, it can take this method to enlarge the amount of cash, securities, loans, or any other asset. When the bank raises more proportion of assets with capital, it is worth to mention that the leverage ratio will rise as well.
2.1.2 Role of bank capital
Bank capital take a role of self-insurance, providing a buffer against bankruptcy and giving bank management a motivation to control and manage risk very comprehensively and detailed (Koehn and Anthony, 1980).
When capital is too low according to assets, to some extent, bank managers are willing to take more risks. The reasons behind this are obvious, shareholders undertake limited risk based on their different amount of initial investment, on the contrary, their upside opportunity is limitless. Under this circumstance, when capital becomes progressively worse with the effect that losses shrinking but potential gains may not. This problem will gradually disappear during the process of improving the level of capital. That is to say, when shareholders have more bargaining chip in the game, they will push the bank managers to invest more carefully as they undergo higher risk and greater losses.
From a previous perspective, the rescue of a systemically important bank can be optimal if it ensures that overall financial stability by relaxing banks’ balance sheet constraints and, by diminishing contagion, restricts downside spillovers from the financial sector to output and employment (Bianchi, 2016). Which is well-known as -- “too big to fail” (TBTF), as for them, the role of self-insurance is far more important. In the European banks sector, the governments have taken many solutions to bail out their banks. But in a long run, if the cost of saving them is economic disaster in the future, governments cannot credibly promise to rescue them. In conclusion, making banks to have more buffer which means
11
that increasing the level of capital can ensure themselves internalizing the buffer over that otherwise would occur.
To sum up, an individual bank which is lack of capital would harm to the macro economy in three aspects. First, it is difficult for a bank with tight capital has sufficient ability to provide credit to healthy borrowers. Second, in order to avoid taking losses, week banks may take a risk to evergreen loans to zombie firms, as it will add unpaid interest to a loan’s principal. Moreover, the consequence of this is further undermining their already fragile capital structure. Finally, yet importantly, with the fact of widespread capital shortfall, the system as a whole is more vulnerable to contagion and panic.
2.1.3 Capital requirements
Bank’s CET1 capital ratio is one crucial regulatory standard for ensuring its credibility in some extend. As we mentioned before, regulators conduct stress tests under different risk assumptions to test banks’ capital adequacy under different scenarios. The combination of higher capital requirements and strict stress tests have contributed to a sharp increase in banking capital recentally.
Comparisison with the classical theory proposes by "Modigliani-Miller" (MM hereafter), Admati, DeMarzo, Hellwig and Pfleiderer (2010) hold that the impact on banks’ activities such as lending cannot fully blame on capital requirements. However, the rule of capital requirement plays an important role for bank supervisors if they want banks’ equity involve a given share of their assets. Banks with more equity should be a must-taken solution, if they are willing to maintain lending activities with the increasing requirements. The MM view argues that, when it comes to the equity issuance costs, there are limitations. Hence, Kashyap and Stein, 2009 hold that the change of capital requirements would lead to a marginal effect on banks (e.g. the cost of funding). The theory behind this consequence is banks with relatively higher capitalization are less likely to exposure to a high risky circumstance and are expected to issue cheaper and less risky equity. Meanwhile, the alternative non-MM view stands for an fairly long conventional basis in corporate finance, that is to say, because of the asymmetric information on stock market (which is so called frictions), as well as agency costs of bank management (Diamond and Rajan, 2000), it is a costly action to obtain equity (Myers and Majluf, 1984). Banks with maximizing NPV are required to stop some NPV projects when facing the shortage of equity, since these projects will lead to reduction of regulatory capital.
12
Financial crisis has bought to put forward the discussion of the optimal capital requirements for banks, should the ratios which are required by regulatory increase? (Admati et al, 2010). On the one hand, Hellmann et al. (2000) hold an opinion that over strict capital regulation can lead to bank’s over prudent behavior, more supportive information can be seen in the research of Repullo (2004) as well as the research of Morrison and White (2005). On the other hand, the reduction of capital requirments at some point may lead to distortion of a bank's provision liquidity (Diamond and Rajan, 2000; DeAngelo and Stulz, 2013; Diamond and Rajan, 2001). Dewatripont and Tirole (2012) have provided more supportive evidence for the opinion that the stricter the capital requirement is the more chance of inducing governance problems. In a similar vein, if an individual bank augments its capital requirements, it will bring about a reduction in bank lending (Kashyap and Stein, 2004) and its investment.
If a bank with relatively high capital requirements, can this make an impact on bank lending and cost of capital? There are few empirical papers studying on this. When it comes to researches conducted by large financial institutions, Kashyap (2010) conclude that even under the assumption of that the minimum requirement of bank capital ratio goes up to 10%, the long-run steady-state impact on loan rates will probably maintain a relatively stable level, given a respective range between 25 and 45 bps. Moreover, Baker and Wurgler (2013) argue that a slightly adjustment even it is only a 10%-point augment in the requirements of bank capital, it will bring about an 60-90 bps per year increase of the WACC (weighted average cost of capital). Kisin and Manela (2013) note that a 10%-point augment in the ratio of Tier 1 capital to risk-weighted assets will impact on banks’ cost of capital, that is to say, brings about an increase by about 3 bps at most. It should be noted that these researchers have fully taken into account about the hidden effect on the economy which is led by the capital supervisions for the banking system, which is still a problem for evaluating the comprehensive implications of welfare under different capital requirement during different period in their setting.
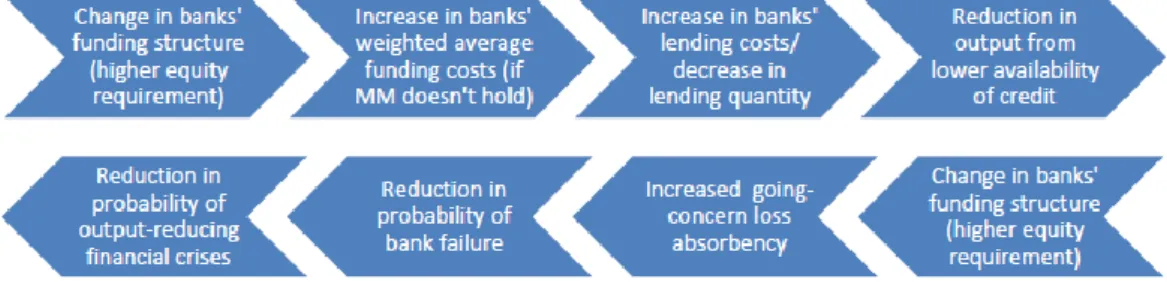
13
If it is widely believed that adjustments in bank’s funding strategy will draw in the effects of changing the lending costs or the amount of lending, it follows that capital requirements may lay an impact on broader economic activity. Therefore, determining the adequacy capital ratio is a way of quantifying the downside effects of growth in raising equity through scaling down economic activities against the benefit, lowering the probability of financial crises and output losses. In order to illustrate it more clearly, the mechanisms are shown in Figure 2.3.
2.2
The common methodology of EU-wide stress testThe International Monetary Fund (IMF) started implementing stress test as a key part of the Financial Sector Assessment Program (FSAP) in 1999, which does show the importance of stress testing. The Methodological Note of the EU-wide stress testing (2011, 2014, 2016, 2018) pressed by the EBA implies that the EU-wide stress test is based on a bottom-up method with relevant scenarios and one common methodology, as well as a set of templates for capturing stress test results. Which allows a rigorous assessment of the banks in the sample.
2.2.1 Overarching Framework for Stress Testing
In 2001, the International Monetary Fund (IMF) introduced a basic macro stress-testing technique and presented a fundamental framework and toolkit for conducting stress tests (IMF, 2001). Michael Boss and Gerald Krenn (2006) constructed a Systemic Risk Monitor model to perform regular stress testing exercises for banking systems, so as to analyze the risk of the entire banking system rather than just individual financial institution. One year later, Michael Boss and his colleagues (2007) conducted stress tests for the update of FSAP in Austria, which lied in particular on two macroeconomic stress scenarios, and the results show that the Austrian banking system exhibits significant resilience against shocks. In 2009, the supervisory authorities in the EU area initiated and coordinated the first European Union-wide stress tests to assess if an individual bank can manage to resilient to shocks or not. The Committee of European Banking Supervisors (2009) disclosed the information on stress testing exercise with commonly agreed scenarios and guidelines and released the results of the stress testing exercise.
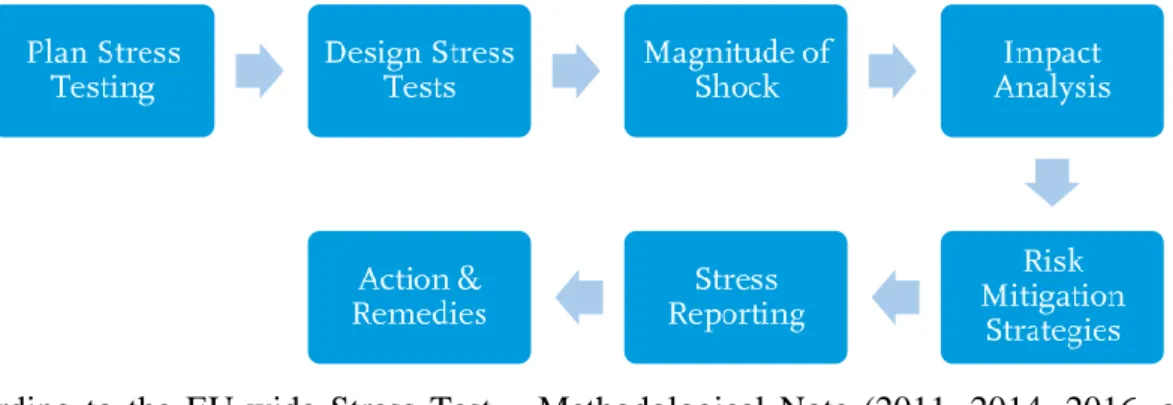
14
According to the EU-wide Stress Test – Methodological Note (2011, 2014, 2016, and 2018), the general framework for stress testing methodology combines seven steps (which is presented in Figure 2.4.
Authorities are responsible for EU-banking supervision and play key roles in planning stress testing exercise, and the testing is exercised on a bank-by-bank basis. For the second step, supervisory authorities take responsibility of designing exceptional but plausible scenarios and common methodology by assuming aggravation of a set of macro-economic shocks (assuming the deteriorate of some macro risk factors) which is relevant to the third step. One thing should be pointed out that in order to make sure the stress test could be carried out in a matching way by all participating banks, that is, the performance of bank stress testing is expected to adopt the static balance sheet assumption. Under this assumption, some changes are not allowed to take into consideration such as changes in the assets and liabilities which are derived from the actions of management, increases existing lending or some other traits of liabilities or assets. The fourth step aims to analyze if banks’ internal model can achieve an effective assessment under the stressed scenarios and check banks’ preliminary results. Based on the outputs from the impact analysis, supervision authorities and individual banks are expected to come up with appropriate financial strategies to empower banks to mitigate risks and improve their resilience to relevant macroeconomic shocks. For the sixth step, the role of the EBA are more likely to be a data hub for the final propagation of the common stress testing exercise, so as to ensure transparent and comparable publication of the results submitted by banks. For the last step, banks that failed to reach the supervisory requirements are required to take specific remedial measures to strengthen their capital position.
15
Responsibility 2011 2014 2016 2018
Individual banks
Run stress testing by using their own model
√ √ √ √
CAs2 Complete the exercise to banks and receive information directly from banks.
√ √ √ √
EBA3 Develop the common methodology; A data hub; Provides CAs with EU descriptive statistics on risk parameters for the purposes of consistency checks.
√ √ √ √
EC4 Developing baseline macro-economic scenario
√ √ √ ─
ESRB5&ECB6 Develop adverse macro-economic scenario
√ ─ ─ √
ECB Provide the baseline scenario ─ ─ ─ √
ESRB Provide adverse scenario on which the stress test can be run
─ √ √ ─
ESFS7 Build the framework for the assessment of the resilience of the financial sector
√ ─ ─ ─
CAs & ECB The quality assurance process; Assess the reliability and robustness of banks’ assumptions.
√ √ √ √
The exercise which was conducted on a bank-by-bank level focus on a micro-prudential projective, the main purpose is to assess the resilience of the European-Union banking system in a bottom-up approach (the EU-wide Stress Test – Methodological Note (2011, 2014, 2016, 2018)). The roles of the institutions and national supervisors shows in Table
2.1.
2 Competent Authorities 3 European Banking Authority 4 European Commission 5 European Systemic Risk Board 6 European Central Bank
16
2.2.2 Methodology by risk calibration
There are many risk types involved in the design of any stress-testing scenarios to analyze (market risk, credit risk, exchange rate, liquidity, etc.). Wilson (1997) and Boss (2002) employed a framework of stress test that exercise default risk in line with the development of macro-economic situations. Marco Sorge (2004) researched two most commonly adopted macro stress-testing methodologies. Their survey identified three remarkable areas (Non-additivity of risk as well as that of risk measures, Time horizon, and Feedback effects and endogenous parameter instability) that would deserve further attention. Ka Kalirai and Scheicher (2002) implied time series data into their regression model with an extensive set of variables on a macro-economic level (which mainly focused on aggregate loan loss provisions) to analyze the banking system in Austria. Hoggarth and Zicchino (2004) focus on the correlation between the disaggregated and aggregate loan write-offs and the inflation of estate price, exchange rate etc., and a vector autoregressive (VAR) measurement was used in their case. From the perspective of risk types, the stress testing methodology constructed by the EBA (2011 Methodology Note) mainly focused on market risk, credit risk, sovereign risk, operation risk, Liquidity risk and the evolution of the cost of funding. The EBA (2014 Methodology Note) added one risk type, that is, the Securitization risk in the 2014 methodology; In 2016 and 2018, the situation was a little bit different, EBA not only focused on credit risk, market risk, operational risk, but also stressed conduct risk, while the sovereign risk was excluded for the common methodology (2016 & 2018 Methodology Note). It is also notable that the EBA stress test the methodology for banks to use is retrievable and published on the EBA official website. This publication is limiting how banks can do their own bottom-up modelling, as individual bank does not publish additional guidance and the banks’ modelling methodology is confidential.
2.2.3 Transparency
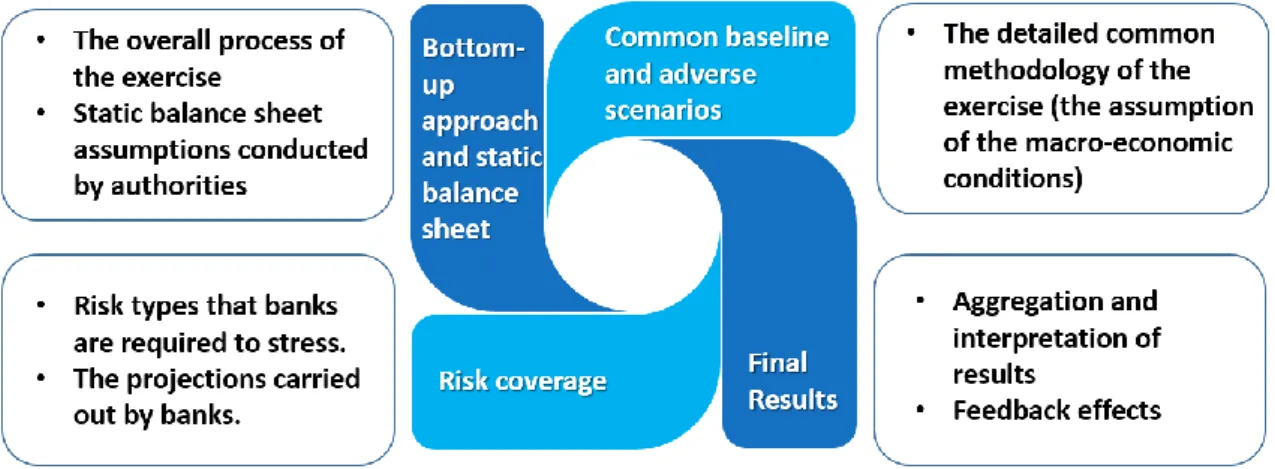
Is there an optimal disclosure policy of EBA that has information about banks? Hirshleifer (1971) gives us a fundamental concern about disclosure, known as Hirshleifer effect. Itay and Yaron (2013) find that no disclosure if optimal during normal periods, while some disclosure is necessary during bad periods. Mitchell (2015) provide the different opinions of the debate on disclosure. They hold that make the stress testing results public is more likely to be optimal when the regulatory model is relatively inaccurate. However, the
EU-17
wide stress tests have high transparency, since everyone can find information about the common methodology and detailed results (bank-by-bank level and aggregate analysis) of the test form publications released by the European Banking Authority. In formation of all the four key aspects of the EU-wide stress testing are accessible gathered, as shown in
Figure 2.5.
With such a high transparency, Oana and Maria (2017) provide insights into the effects and functions of the disclosure of stress-testing results, and find that related disclosure of the stress test sent some useful messages to the market and provided ground use of the micro- prudential and macro-prudential analysis for safe guarding financial stability purpose.
Figure 2.5 General framework for stress testing methodology
2.3
Microeconomic factors affecting bank performance.2.3.1 Previous research on both internal and external determinants
A large set of empirical studies covering of the association between internal & external economic factors and bank performance have been conducted. Sehrish Gul et al. (2011) test the association between some factors (both micro-economic and macro-economic) and banking probability in Pakistan. They use a model which consider the ROA, net interest margin, return on capital as dependent variables, and consider some microeconomic parameters as independent variable, such as bank size, total capital, loans etc., while the macroeconomic explanatory variables stand for stock market capitalization, GDP, inflation rate. They find out that both microeconomic and macroeconomic determinants have significant influence on bank profitability. Acaravci and Calim (2013) examine the profitability divers (base both on the bank-specific level and macroeconomic level) of the
18
commercial banks in the case of the Turkish banking system. The estimation results show that comparing with microeconomic factors; macroeconomic factors have less impact on the profitability of a bank. Athanasoglou et al. (2006) use panel dataset to analyze the effect of a set of factors (bank-specific, industrial and macro-economic) on bank profitability in the SEE region. Their results indicate that all the bank-specific parameters are significance determinants of bank profitability, and the changes in industry-related and macroeconomic environment directly affect the aggregate industrial performance.
2.3.2 Basel III and Micro drivers
The Basel Committee on Banking Supervision (BCBS) disclosed new regulations aiming to strengthen bank soundness after the financial crisis happened in 2008, known as Basel III (BCBS 2010; BCBS 2013; BCBS 2014). The changes of main capital requirements during different time horizon are as follows:
Table 2.2 Calibration of capital requirements and buffers
2013 2014 2015 2016 2017 2018 2019 Minimum Common Equity Capital Ratio 3.5% 4.0% 4.5% 4.5% 4.5% 4.5% 4.5% Minimum Tier 1 Capital 4.5% 5.5% 6.0% 6.0% 6.0% 6.0% 6.0% Minimum Total Capital 8.0% 8.0% 8.0% 8.0% 8.0% 8.0% 8.0% Minimum Total Capital plus conservation buffer 8.0% 8.0% 8.0% 8.625% 9.25% 9.875% 10.05% Source: BCBS, https://www.bis.org/bcbs/publ/d424.htm
According to Basel Committee, the Basel III regulations are expected to improve banks’ resilience when a sudden shock occurs. This theory is supported by Giordana et al., (2017). They have analyzed whether Basel III regulations maters, under the basis of the investigation of banks’ default risk, that is, how capital to assets ratio, liquidity coverage ratio and net funding ratio, are likely to affect the profitability of a bank. Their empirical results provide evidence of the opinion that Basel III regulations would lead to a decrease of a bank’s default risk. Accordingly, the BCBS conducts many large-scale and reliable studies based upon the function and impact of Basel III requirements (BCBS (2010)). Moreover, Cournède and Slovik (2011) and Schumacher and Giordana (2013) analyze the impact of Basel III regulations on a micro and macroeconomic basis.
19
What if we only take internal factors into consideration? As the Basel III Accord shows that capital ratio can somehow drives the bank performance. Accordingly, there are three guidelines of capital requirements for banks: first, the capital adequacy ratio should no less than 8%; second, the Tier 1 ratio should no less than 6% (Tier 1 capital to risk-weighted assets); third, the Tier 1 common equity ratio (common equity to risk-weighted assets), which calls for a minimum requirement of 4.5%. Along the time, there are a lot of papers studying the effect of capital ratio of a bank on some typical micro parameters and aiming to address the issue of risk-based capital arrangement. Keeton (1989) discusses how a bank’s risk-based capital requirement is determined and starts from three key elements: the eligible capital, an advantage requirement (issued by the Federal Reserve), a risk-based capital requirement. Moreover, he also evaluates the likely effectiveness of capital in controlling bank’s risk. Keeton (1989) compute risk-based capital requirement are expected to improve the regulation of risk-taking of the banking sector. Moreover, Jacques and Nigro (1997) indicate that the risk faced by bank may be descended by higher risk-based capital measures.
Bitar et al., (2015) extract several definitions of capital and try to find out the association between capital ratios, risk, efficiency as well as profitability by using an OLS regression model. Considering risk (loan loss reserves to total assets, non-performing revenue, loan loss reserves etc.), efficiency (cost to income ratio, non-interest expenses to gross revenue ratio, non-operating items and taxes to average assets)), and profitability (interest income-to- interest expenses divided by total earning assets) as dependent variables, use several capital ratios (under the guidance of Basel III: Tier 1 divided by risk-weighted assets (RWA), Total capital to risk weighted assets, Common equity/RWA and Other capital/RWA), and several bank-level control variables (Net loans/total assets, gross rate of total assets etc.). Their empirical result shows that non-risk-based capital ratios find to be positively associated with bank reserves. However, risk-based capital ratios are found to be insignificantly to effect bank risk. In addition, they have shown that bank efficiency and profitability are improved by higher capital ratios.
20
Table 2.3 Overview of the main literature on bank capital and determinants
Similarly, Almazari (2014) investigates the micro determinants that driving profitability of banks in Saudi Arabia and Jodanian. He considers return on assets ratio as a dependent variable and considers some independent variables such as Liquidity risk, net credit facilities to total assets ratio (NCA), total equity to assets ratio (TEA), cost income ratio
21
(CIR) and bank size (natural logarithm of total assets) etc. Almazari (2014) researches the banks in Saudi Arabia and finds out that the liquidity risk shows a positive influence on bank profitability (demonstrated as return on assets), and the same relationships are found between total equity to total assets ratio and bank profitability, as well as the relationship between the investment to asset ratio and bank profitability. Besides, his result also shows that there is a negative and significant correlation between bank profitability and bank size, net credit facilities, cost to income ratio. Meanwhile, the profitability of Jordanian banks is positively influenced by net credit facilities, liquidity risk, and total equity. Moreover, they also find the profitability of Jordanian banks is negatively influenced by bank size, total investment and cost-to-income ratio. Another explanatory offered by Osborne et al., (2016) is that the Tier 1 capital ratio positively effects the lending rates during good time and negatively effects the secured household lending rates during bad time. Haldane (2012) and Demirgüç-Kunt et al., (2013) also find out that the higher common equity ratio and Tier 1 capital ratio, the more effective for banks absorb losses. Furthermore, Table 2.3 illustrates a summary of some empirical researches that study the relationships between bank capital, the risk of bank, efficiency, and bank profitability.
3
Methodology and data
________________________________________________________________________ ___ _
This chapter presents a description of how the study is conducted, the data is collected and ends in a critical evaluation of both methodology and data.
________________________________________________________________________ ___ _
3.1
Sample construction and empirical approachAs said before, the objective of this paper is to find out whether there is any association between some bank-specific micro parameters and the CET1 capital ratios from the stress-testing results (adverse scenarios). A bank has not involved in all the stress tests in year 2011, 2014, 2016, 2018 and is thus not included in our framework. We use DataStream as a main source to obtain bank-specific data for this research. Moreover, some specific data are obtained from the annual reports of bank. It is also notable that the CET1 ratios are derived from the publication of EU-wide stress testing results disclosed by EBA.
In our analysis, we use economic data with both time series and cross-sectional variation. Under the basis of previous study, we choose to use panel data as our regression model.
22
Hence, this paper will use panel data regressions (Sufian (2010); Berger and Bouwman (2012); Staub et al. (2010)) since our observations are about both the cross-sectional countries and over several periods (2010, 2013, 2015, 2018). The strategy of this paper objective is defined by three classical models and in line with the Hausman Test.
For the first important step, multicollinearity problem should be checked to make sure that explanatory variables are not highly correlated with each other. Through this procedure, we can find if there is near multicollinearity among all the variables (i.e. correlation which is higher than 0.8). There are some reasons for this procedure. Firstly, if variables are highly correlated, it will lead to more difficulties to detect individual contributions of each to the overall. Consequently, even though regression results may tell a “good story” with high R2, the individual variables are not significant. Secondly, highly correlation could make the regression model more sensitive to every small change, i.e. adding or removing a factor would bring about large change in the value of coefficient or significances of other variables. Last but not least, existence of near multicollinearity has a chance to get an inappropriate conclusion for the test, lower the accuracy of the following inference. As can be seen from the Table 3.1, there is no evidence showing that multicollinearity problem exists amongst variables (bank level determinants and control variables).
After checking the justifiability of variables, the regression could be conducted on dependent variables. For panel data, the simplest method to conduct is pooled regression on all data together.
23
Table 3.1 Correlation matrix
Correlation NPL LTD SIZE Efficiency NLTA
Diversifi-cation
Retail
Funding ROA GDP Volinflation Volstock
NPL 1.00000 LTD -0.23010 1.00000 SIZE -0.24360 -0.17630 1.00000 Efficiency 0.36390 -0.00204 0.11230 1.00000 NLTA 0.13035 0.14443 -0.47298 -0.05168 1.00000 Diversifi-cation 0.13038 -0.00081 0.27077 0.52998 -0.21002 1.00000 Retail Funding 0.07183 -0.54580 -0.19738 -0.21954 0.24628 -0.12562 1.00000 ROA -0.12329 -0.07590 -0.12422 -0.74295 -0.04039 -0.39030 0.33125 1.00000 GDP 0.04508 0.02293 -0.18773 -0.27134 0.11169 -0.13671 0.08700 0.15672 1.00000 Volinflation -0.05009 -0.19171 -0.10717 -0.04332 0.05962 -0.32185 0.11870 0.03836 0.03749 1.00000 Volstock 0.05566 0.10430 -0.53576 -0.09465 0.24244 -0.12439 0.12961 0.23322 0.16817 0.29382 1.00000
24
3.1.1 Pooled regression model The general model is
𝑌𝑖𝑡 = 𝛽𝑦𝑠𝑡𝑥𝑖𝑡+ 𝛽𝑦𝑧𝑡𝑧𝑖+ 𝛾𝑖+ 𝑢𝑖𝑡
If we put all the data into a pool, we obtain a bank panel. Not surprisingly, some of the econometric issues arising in this context have close relation with time series econometrics. In combined panels, the cross-sectional and time series dimensions are often of a same size. There is a central modelling issue that how to accommodate heterogeneity across different variables. It cannot be denied that the problem of cross-sectional variation impacts the choice and sampling properties of estimators.
3.1.2 Random Effects Model The random effects model is
𝑌𝑖𝑡 = 𝛽1𝑖+ 𝛽2𝑋𝑖𝑡+ 𝑢𝑖𝑡+ 𝛾𝑖
The use of adjusted procedure presupposes that the hypothesis of the random effects model has, to be more specific, the latent time-invariant variables have no relationship with all observed covariates. To some extent, this assumption is too perfect and too difficult to achieve. The fixed effects model removes this restriction.
In order to distinguish if the random effect model is suitable or not, one need to conduct a Hausman Test. Based on the research of Greene (1997), we use the Hausman Test to diagnose the most appropriate model between the FEM (fixed effects model) and REM (random effects model). The null hypothesis of the test is that: the random effects model is suitable for the regression. The alternative hypothesis is that the fixed effects model is more reasonable for the regression.
Here are the hypotheses:
𝐻0: 𝐴 𝑅𝐸𝑀 𝑖𝑠 𝑠𝑢𝑖𝑡𝑎𝑏𝑙𝑒
𝐻1: 𝐴 𝑅𝐸𝑀 𝑖𝑠 𝑛𝑜𝑡 𝑠𝑢𝑖𝑡𝑎𝑏𝑙𝑒
del Correct hypothesis
Random effects model used
Fixed effects model used 𝐻0: 𝐶𝑜𝑣(𝛼𝑖, 𝑥𝑖𝑡) = 0 Exogeneity Consistent Efficient Consistent Inefficient
25
𝐻1: 𝐶𝑜𝑣(𝛼𝑖, 𝑥𝑖𝑡) ≠ 0 Endogeneity
Inconsistent Consistent Possibly Efficient
3.1.3 Fixed Effects Model
Fixed effects models reflect within effects variation in a time-series domain (with N observations and time periods equals to T), which is suitable for the individual-level intercept, which is correlated with at least one explanatory variables. In addition, the fixed effect model can be used to control for time-invariant variables when the estimation model contains relatively small size of observations and relatively large size of T (time periods). Not only is the R2 an important statistic to estimate the goodness of fit, but also the F-test results will reflect the significance of the fixed effects models and to detect if adding the fixed effects added explanatory power to the model.
Consider the linear unobserved effects model:
I. 𝑌𝑖𝑡 = 𝛽1𝑖+ 𝛽2𝑋𝑖𝑡+ 𝑢𝑖𝑡 (different intercepts 𝛽1𝑖, but same slope 𝛽2 for i)
II. 𝑌𝑖𝑡 = 𝛽1+ 𝛽2𝑖𝑋𝑖𝑡+ 𝑢𝑖𝑡 (same intercept 𝛽1, but different slopes 𝛽2𝑖 for i) For t=1,…,T and i=1,…,N
For equation I, the regression model is estimated with a cross-section fixed effects, which means all the coefficients in the regression model are the same, and different intercepts for different individuals, but the intercept at the individual-specific level does not change over time. This estimation will use the demeaned data to perform the specified regression, because it can remove cross-section specific means from the dependent variable and exogenous regressors(Baltagi, 2005). When something within the individual may affect or bias the determinants or independent variables, it is feasible to use fixed effect mode to control for the problems of bias and misspecification.
For equation II, the regression model is estimated with time-fixed effects, in this case, the constant on independent variables are the same from one individual (e.g. country, firms) to the next, but with different slope coefficient. The time effects should be controlled to avoid the existence of unexpected variation or special events, which may affect the outcome variable. 1 http://d December 2007 ss.princeton.edu/training/
26
As can be seen, fixed effect model eliminates the special effects of time-invariant factors to detect net effect of the explanatory variables. Meanwhile, this model includes the uniqueness of these factors by not correlating them with other individual attributes. Above all, the vital assumption of FEM is the strong presence of correlation between error term and variables.
One thing should be noted that when fixed effects dummies are significant in both dimensions and in each separately, it is mandatory to use both dimensions in regression. According to Chris Brooks (2008), FEM is more appropriate than REM as the variables in the data sample successfully create the whole volume. For the same reason, period fixed effect and cross-sectional fixed effect model will tolerate the potential problem of firm specific and time specific heterogeneity.
3.2
Research model_____________________________________________________________________ __ _
The purpose of the paper is to find which micro drivers are statistically significant in having a strong effect on CET1. There are eleven determinants to be applied in regression, including four bank level determinants (size (SIZE), non-performing loans (NPL), loan to deposit (LTD) and efficiency ratio (Efficiency)) and seven control variables (bank-level: net loans to total assets (NLTA), diversification (Diversification), retail funding (Retail Funding) and return on assets (ROA). country-level: The growth rate of GDP (GDP), Inflation volatility, Stock market volatility).
_____________________________________________________________________ __ _
The methodology of this paper follows the panel data regressions measurement of Sufian (2010); Berger and Bouwman (2012); Staub et al. (2010). We use the regression model below to examine the association between the common equity tier one capital ratio, bank size, liquidity, and efficiency. Besides, in order to avoid misspecification error, in order to take differences in the characteristics of banks into consideration, it is necessary to include control variables into the model. Hence, we follow the literature and estimate a more appropriate model of stress testing bank and time-varying CET1 capital ratio (see e.g. Berger et al., (2008); Öztekin and Flannery (2012), Memmel and Raupach (2010); Lepetit et al. (2015); De Jonghe and Öztekin (2015)). Except the benchmark variable estimations, our model contains several bank level control variables including ROA (return on assets), Retailed Funding, Diversification (income diversity), as well as Net-loans-to-total-assets
27
ratio. Except the benchmark variable estimations, our model contains bank-level and country-level control variables.
∆CET1
𝑖𝑇=
𝐶
+𝛼𝑆𝑖𝑧𝑒
it+ βLTD
it+ƛNPL
it+ǪER
it+ԑControl
it+µ
iWhere ∆CET1iT stands for the difference of bank accounting CET1 capital ratio of bank i at year t= {2010, 2013, 2015, 2017} and stress testing common Equity Tier One Capital Ratio of individual bank i at projection year T = {2012, 2016, 2018, 2020}. Sizeit is the natural logarithm of the total assets of the bank i at year t= {2010, 2013, 2015,2017}, LTDit reflects the liquidity risk of bank i at year t, NPLit represents the non-performing loans to total loans of bank i at year t, and ERit stands for efficiency ratio. Controlit denotes two set of control variables containing the bank-level with ROA (return on assets), Retailed Funding, Diversification (income diversity), as well as Net-loans-to-total-assets ratio; and country-level with the growth rate of GDP, Inflation volatility, and Stock market volatility.
3.3
Description of Control variables3.3.1 Bank-level control variables 3.3.1.1 Net loans to total assets
Followed the research of Mohammad Bitar et al. (2018), we introduce Net loans/TA ratio as one control variable. The net loans to total assets ratio is a useful tool to measure the level of liquidity, as it illustrates that on what extend of the total assets are associated with loans. The higher of this ratio means the bank is liquid. Other literatures also show that banks which intend to invest in different types of securities or derivatives are more likely to expose to risk than banks that process an effective loan portfolio. Some researchers find that liquidity (net loans to total assets) and profitability negatively correlate with each other. Molyneux and Thorton (1992) find a weak opposite relationship between bank profitability and liquidity holdings. As these previous researches indicate, exclusion of this variable may bias the results. Hence, we add this ratio as one control variable.
3.3.1.2 Diversification (income diversification)
According to Mohammad Bitar et al. (2018), to estimate the micro determinants of banks, it is also necessary to control for diversification in the empirical model. Mohammad Bitar et al. (2018) introduce a tool of measuring income diversity, which is a ratio for capturing that to what extent of a bank can make a diversification of lending and non-lending
28
activities. Many researchers have illustrated different views about how diversification in income affect risk and performance. Abedifar et al. (2013) hold that through diversifying activities, banks will manage to receive different businesses information of their clients, and the gathering information can help bankers to make better lending decisions. Stiroh (2004, 2006) finds that bank returns will not increase if only based upon a reliance on non-interest income. Some other researchers demonstrate similar findings. Demirgüç-Kunt and Huizinga (2010) argue that non-interest income can somehow reflect volatile returns. Furthermore, from the empirical research of Abedifar et al. (2013), they find that non-interest income and bank non-interest margins negatively correlated. Yassine Bakkar et al. (2017) introduce the diversification as non-interest income to total income and find a negative relationship between Leverage, CET1 capital ratio and Total capital. In this paper, Mohammad Bitar et al. (2018) and Laeven and Levine (2007) are taken as a reference for choosing variable. Hence, the income diversification is one of control variables, which denotes by 1 – [(Net interest income – other operating income)/ (operating income)]. It indicates that the higher the value, the more diverse of a bank’s financing activities are. 3.3.1.3 Retail funding
In corporate finance how financial agencies finance themselves forms a unique area as these corporations have the same core part of dynamics competitors to nonfinancial businesses. Under this circumstance, how banks fund themselves becomes a worthy study subject because banks have to deal with both open market capital requirements and regulatory standards imposed by regulators and governments. Consequently, a funding perspective mostly pay attention to the right side of the bank’s balance sheet, including both its liability structure and its equity capital. From Dafna Avraham, Patricia Selvaggi & James Vickery (2012), they point out that the structural of bank holding has an impact on the capital adequacy. At the same time, we have a glance at United States, the federal regulation imposes comprehensive requirements on the structure of a bank’s equity capital especially focus on the quality of its funding structure and it’s over leverage. Commonly speaking, banks usually use customers’ deposits and short-term borrowed money from interbank lending or central bank to finance mortgages and other long-term investments. From the development history of European banks, with the implementation of European Deposit Insurance Scheme (1988), the funding structure of European banks become more and more important. The funding structure of a bank tells us the story about this bank’s financing choice such as retail funding, asking help from the central bank or capital