Youth unemployment and inactivity
A comparison of school-to-work transitions and labour market outcomes
in four Nordic countries
Ved Stranden 18 DK-1061 Copenhagen K www.norden.org
Young people follow highly different trajectories from age 16 up to age 20, a time period which is often argued to be the most critical in terms of their future labour market outcomes. The focus of this report is on investigating the look of these early pathways, as well as on exploring their link to labour market outcomes in adulthood. Results are reported and compared for four Nordic countries: Denmark, Finland, Norway and Sweden.
Youth unemployment and inactivity
Tem aNor d 2015:548 TemaNord 2015:548 ISBN 978-92-893-4229-2 (PRINT) ISBN 978-92-893-4230-8 (PDF) ISBN 978-92-893-4231-5 (EPUB) ISSN 0908-6692 Tem aNor d 2015:548
Youth unemployment
and inactivity
A comparison of school‐to‐work transitions and
labour market outcomes in four Nordic countries
Karsten Albæk, Rita Asplund, Erling Barth, Lena Lindahl,
Kristine von Simson and Pekka Vanhala
Youth unemployment and inactivity A comparison of school‐to‐work transitions and labour market outcomes in four Nordic countries Karsten Albæk, Rita Asplund, Erling Barth, Lena Lindahl, Kristine von Simson and Pekka Vanhala ISBN 978‐92‐893‐4229‐2 (PRINT) ISBN 978‐92‐893‐4230‐8 (PDF) ISBN 978‐92‐893‐4231‐5 (EPUB) http://dx.doi.org/10.6027/TN2015‐548 TemaNord 2015:548 ISSN 0908‐6692 © Nordic Council of Ministers 2015 Layout: Hanne Lebech Cover photo: ImageSelect Print: Rosendahls‐Schultz Grafisk Printed in Denmark This publication has been published with financial support by the Nordic Council of Ministers. However, the contents of this publication do not necessarily reflect the views, policies or recom‐ mendations of the Nordic Council of Ministers. www.norden.org/nordpub Nordic co‐operation Nordic co‐operation is one of the world’s most extensive forms of regional collaboration, involv‐ ing Denmark, Finland, Iceland, Norway, Sweden, and the Faroe Islands, Greenland, and Åland. Nordic co‐operation has firm traditions in politics, the economy, and culture. It plays an im‐ portant role in European and international collaboration, and aims at creating a strong Nordic community in a strong Europe. Nordic co‐operation seeks to safeguard Nordic and regional interests and principles in the global community. Common Nordic values help the region solidify its position as one of the world’s most innovative and competitive. Nordic Council of Ministers Ved Stranden 18 DK‐1061 Copenhagen K Phone (+45) 3396 0200
Contents
Introduction ... 7 Increasing focus on school‐to‐work transitions ... 7 Key features of the study... 10 Structure and content of the present report ... 12 1. Performance of young people – an international perspective ... 17 1.1 Setting the stage ... 17 1.2 Snapshot of recent Nordic comparative studies ... 20 1.3 The Nordic story told by international comparative indicators ... 21 2. General description of post‐compulsory‐school activities ... 37 2.1 The national datasets used ... 37 2.2 Main activities of young people – the overall pattern ... 41 2.3 Non‐completers – an introductory view ... 65 2.4 Individual school‐to‐work profiles – a general picture ... 76 3. School‐to‐work trajectories: country‐specific cluster results ... 89 3.1 The cluster analysis method – a brief outline ... 89 3.2 Country‐specific cluster results: all young people ... 98 3.3 Country‐specific cluster results: non‐completers ... 113 4. School‐to‐work trajectories: common Nordic cluster results ... 129 4.1 Common Nordic trajectories and clusters: all young people ... 130 4.2 Common Nordic trajectories and clusters: non‐completers ... 136 5. Non‐completers’ school‐to‐work trajectories: stylized cluster results ... 147 6. Labour market outcomes as young adults ... 171 6.1 Main activities beyond age 21 – all young people ... 171 6.2 Main activities beyond age 21 – young men vs. young women ... 181 6.3 Main activities beyond age 21 – completers vs. non‐completers ... 190 6.4 Main activities beyond age 21 – late completion vs. non‐completion ... 210 7. Labour market outcomes in view of background ... 223 7.1 Gender and labour market outcomes ... 223 7.2 Cohort and labour market outcomes ... 227 7.3 Family background and labour market outcomes ... 232 7.4 Early pathways through education and labour market outcomes ... 241 8. Summary and discussion ... 273 References ... 279 Sammanfattning ... 285 Appendix: Descriptions of national datasets used ... 293 Denmark ... 293 Finland ... 294 Norway ... 295 Sweden... 296Introduction
Youth unemployment has for several decades been a much debated topic in both the academic and the political arena. The recent global economic crisis, in combination with profound changes in labour market structures (see e.g. Acemoglu and Autor, 2011), shifted youth unemployment to the top of the political agenda after alarming reports on surging youth unem‐ ployment rates and growing risks of young people becoming economically and socially marginalised (e.g. Scarpetta et al., 2010; ILO, 2011, 2013; Räisänen, 2013). Concomitantly, increasing attention was paid to so‐called NEETs, that is, young people not in employment, education or training. Several recent reports highlight the prevalence of this phenomenon and also provide estimates of the societal costs of early school leaving and NEETs (e.g. Eurofound, 2012; Brunello and De Paola, 2014). Other studies highlight the complexity of problems often associated with being a NEET. A survey of the Prince Trust (2010) covering young people aged 16–25 reports that NEETs are significantly more likely to feel ashamed, rejected, lost, anxious, insecure, down and depressed, isolated and unloved. They are also disproportionately more likely to say that they had turned to drugs and that their life had no direction.Increasing focus on school‐to‐work transitions
A growing body of evidence identifies early school leaving and school dropout as major reasons underlying youth unemployment and margin‐ alisation from working life in a world where an upper secondary certifi‐ cate has increasingly become the minimum requirement for proper ac‐ cess to the job market. Those left behind at the lowest floor – the low‐ or unskilled school leavers lacking work experience – are the losers in the competition with the better skilled. Their disproportionate presence among those holding temporary jobs, in combination with their high concentration in cyclically sensitive industries, makes them especially vulnerable. Apart from a much higher risk of becoming unemployed, as compared to their higher‐educated peers, young people with a low edu‐ cation also face a much higher risk of repeated spells of unemployment
that, moreover, tend to prolong over time. Ultimately school leavers end up outside the labour force for shorter or longer periods of time.
Hence, low educational attainment levels not only impede initial in‐ sertion into the labour market, but also represent an enduring barrier to employment (e.g. OECD, 2008a). Indeed, while the negative labour mar‐ ket and social outcomes of youth unemployment of a more temporary nature have been shown to diminish over time, there is a considerable body of evidence on long‐term unemployment having lasting scarring effects on young people in terms of both future employment and future wages. Illustrative examples are a study by Kahn (2010) for the USA showing that graduating from college in a bad economy has large, nega‐ tive and persistent effects on wages, and a study by Bell and Blanchflow‐ er (2009) for the UK reporting that youth unemployment raises unem‐ ployment, lowers wages, worsens health and lowers job satisfaction still 25 years later. Studies reporting permanent employment and wage loss‐ es are also found for other European countries, including Germany (e.g. Schmillen and Umkehrer, 2013; Möller and Umkehrer, 2014), Norway (e.g. Nilsen and Holm Reiso, 2014) and Sweden (e.g. Nordström Skans, 2011). Taken together, the existing evidence implies that the long‐term costs of early exit from the education system have increased.
While the economic business cycle tends to have long‐lasting career consequences for young labour market entrants, also the schooling deci‐ sion itself may be affected by the state of the labour market. Desire to work may be an important motivation for some youth to end their edu‐ cation at an earlier stage. According to standard human capital theory (Becker, 1964), the economic situation affects the schooling decision mainly through the opportunity cost of schooling, measured as foregone earnings. A booming labour market implies more job openings and high‐ er wages, which in turn increase the opportunity cost of schooling. This may encourage some youth to take advantage of the favourable labour market conditions and leave school on a temporary or permanent basis. An economic downturn, on the other hand, may induce youth to stay in school and postpone their labour market entry, or to return to educa‐ tion. Previous research on upper secondary schooling supports this pre‐ diction: Students are less likely to stay in school in good times. Also en‐ rolment tends to decrease in good times (Clark, 2011), with graduation rates being countercyclical, as well (Reiling and Strøm, 2015). Addition‐ ally, the propensity to interrupt the education and drop out from school altogether increases in economic upturns (von Simson, 2014). On the whole, though, the association is not very strong and other factors, such
as parental education, are more important in explaining schooling deci‐ sions than is the economic situation.
Nonetheless, early school leaving and dropout from upper secondary education can be seen to typically represent unsuccessful transitions within the school system and further into working life. This contention has, more recently, broadened the focus on unemployment and margin‐ alisation among young people to the role of school‐to‐work transitions. Indeed, the transition from education to working life has frequently been argued to be the most critical phase in terms of a young person’s labour market outcomes later in life. While these transitions evidently reflect the family situation and compulsory‐school outcomes, these much researched background factors cannot offer a full explanation for young people’s highly different school‐to‐work‐transition patterns and, ultimately, for their differences in labour market outcomes in adulthood. The transitions in themselves seem to be of importance, as well. In other words, it seems reasonable to assume that young people’s early school and labour market experiences upon leaving compulsory school also play a role for their labour market outcomes later in life.
These contentions explain and motivate the focus of our study on four Nordic countries – Denmark, Finland, Norway and Sweden – the main results of which are reported in this volume. More precisely, first we present and discuss the school‐to‐work transitions of young people leaving compulsory school. Next we use this information to indicate the extent to which different school‐to‐work‐transition patterns are related to the probability of young people ending up in alternative labour mar‐ ket situations in adulthood. Doing so, we also include basic information on family background, which allows us to test whether or not early post‐ compulsory‐school experiences have a “signal value of their own” espe‐ cially when it comes to young people’s probability of going into risky labour‐market tracks dominated by time spent in NEET activities, that is, in unemployment or entirely outside the labour force. Put differently, is it evident that, in addition to family background, also early school‐to‐ work transitions contain important information concerning the likeli‐ hood of different labour market outcomes later in life? The rest of this chapter provides a more detailed outline of our study and the structure of the present report.
Key features of the study
The labour market performance of youth is commonly described by use of various rather conventional indicators highlighting phenomena such as early school leaving, premature training dropout, youth employment and unemployment, and NEET. These indicators share the feature of providing an instantaneous picture of the educational outcome or of the position/status of youth in the labour market. The mediated picture can, as a consequence, be partly misleading as these static indicators fail to see the observed outcome “as a cumulative process of disengagement or withdrawal that occurs over time” (Lyche, 2010, p. 14). Emerging indica‐ tors, providing a more dynamic description of youth labour market per‐ formance, can correct for some of the shortcomings characterising static indicators but share, nonetheless, the common drawback of oversimpli‐ fying the dynamic nature of youth school‐to‐work trajectories. In order to overcome this unsatisfactory situation, growing numbers of researchers have used alternative ways to assess comprehensively the multiple patterns of school‐to‐work transitions that youth are known to face when moving from education into working life. However, these tran‐ sitions from education to work are far from easy to measure because of the “fluidity of the youth labour market” (OECD 2008b, p. 59). In particu‐ lar, school‐to‐work transitions are often long‐lasting processes involving frequent status changes between education, temporary jobs, unemploy‐ ment and inactivity (Müller and Gangl, 2003; Wolbers, 2007; Saar et al., 2008). This also explains why transitions from education to work cannot be fully understood by analysing single changes of status only.
More recent research on school‐to‐work transitions is therefore in‐ creasingly based on longitudinal data allowing young people to be fol‐ lowed after they have completed their education over a longer time pe‐ riod. However, apart from high‐quality longitudinal data, such a dynamic approach also requires the use of proper statistical methods. Since young people often shift between education, inactivity, unemployment and work before getting a stable job, sequence and cluster analysis has often been argued to be the most appropriate methodological approach in this context (e.g. Brzinsky‐Fay, 2007). A strong advantage of this soci‐ ological method is that it allows entire individual school‐to‐work trajec‐ tories, including nature of spells and their order, to be identified, com‐ pared and classified into one of several distinct types of youth trajecto‐ ries. This categorisation also allows proper account to be made for the fact that youth trajectories often show a high degree of diversity espe‐ cially by gender and educational background. Accordingly, this evidence
clearly improves our understanding of young people’s often bumpy, occasionally unsuccessful, transition into employment. As already noted, this dynamic approach to analysing school‐to‐work trajectories requires access to high‐quality longitudinal data. It is, there‐ fore, hardly surprising that this kind of evidence is, so far, available only for a small number of countries, occasionally for the whole of Europe as averages using information on a limited number of European countries, as done in Quintini and Manfredi (2009). Also missing is broad‐based comparative information for individual Nordic countries, a knowledge gap that the present report aims to fill. Indeed, this report is, to our knowledge, the first contribution using sequence and cluster analysis to investigate school‐to‐work transitions for full cohorts of young people and, moreover, to also undertake cross‐country comparisons of such transitions among young people based on comparative national data.
In exploring the educational and labour market experiences of young people, we pay particular attention to identifying risky trajectories and conspicuous differences in these respects between youth differing in their educational background, while also differentiating across genders. Additionally, attempts are made to identify and quantify possible chang‐ es in early transition patterns within countries by comparing key out‐ comes for a total of three youth cohorts: 16‐year‐olds in 1993, 1998 and 2003, respectively. All three cohorts are traced up to the year 2008 im‐ plying that the shortest follow‐up period covers 5 years and the longest 15 years. Equally important, school‐to‐work‐transition patterns and changes in these patterns are compared across the four Nordic countries under study to highlight major similarities and dissimilarities in “typi‐ cal” school‐to‐work trajectories.
The analysis briefly outlined above provides detailed cross‐Nordic in‐ formation on distinct types of school‐to‐work trajectories for our three cohorts of 16‐year‐olds, up to age 20. Finally, this information is linked to the young persons’ labour market outcomes at three points later in time: when they turn 21, 26 and 31. Throughout, these alternative la‐ bour market activities are grouped into five broad categories – full‐time studying, employment, unemployment, disability benefits and “other” (inactivity). Apart from simply describing these relations between early and later labour market outcomes, we also undertake statistical analysis by use of so‐called multinomial logit techniques, with a view of high‐ lighting the relative strength between different early school‐to‐work‐ transition patterns and alternative labour market outcomes later as a young adult. As explained earlier, we thereby also account for family background in order to explore whether the link observed between ear‐
ly school‐to‐work‐transition patterns and alternative labour market outcomes in adulthood remains approximately unchanged, diminishes or eventually disappears when adding parental information. The last option would, of course, mean that the distinct types of early school‐to‐ work trajectories identified merely reflect differences in the young per‐ sons’ family background. Likewise, the first option would point to the opposite: no link whatsoever between early school‐to‐work trajectories and family background. Taken together, all this new evidence for the four Nordic countries under study should provide policy‐makers valua‐ ble information to guide them in their decisions on actions aimed to enhance the transition of youth from school into working life.
Structure and content of the present report
The report is structured as follows. The next chapter provides a snap‐ shot of what widely used international indicators can tell us about edu‐ cational outcomes, school‐to‐work transitions and labour market per‐ formance of young people in the Nordic countries. Simultaneously, the information mediated by these mainly static indicators serves as a benchmark when we in the next chapters turn to presenting results ob‐ tained based on our national longitudinal data.
Chapter 2 introduces the national datasets underlying the empirical evidence reported in this volume. It also describes and compares across countries the main post‐compulsory‐school activities in which the young people covered by our data have been engaged in, with the emphasis being on their situation up to age 20. In other words, this chapter paints a general picture of young people’s activities over a time period which is often argued to be the most critical in terms of their future labour mar‐ ket outcomes. The chapter also introduces our preferred definition of young people lacking an upper secondary certificate: these young people are called “non‐completers”, as compared to “completers”, implying that they only have their compulsory‐school exam still five years after having left primary education.
In the next chapter, Chapter 3, we present a first set of results ob‐ tained by “grouping” the multitude of individual school‐to‐work‐ transition pathways followed by young people when aged 16 to 20, as reported in Chapter 2, by use of so‐called cluster analysis. Accordingly, the chapter starts with a brief outline and discussion of the basic idea of the cluster analysis method. Only then we turn to the cluster results produced for each country using information on the full youth popula‐
tion. For comparative purposes, separate results are presented also for the non‐completers. All these results on “typical” early school‐to‐work‐ transition patterns are obtained by allowing each national dataset to form the clusters for the country in question, for which reason we refer to them as “country‐specific cluster results”. In other words, we do not restrict the cluster analysis in order to produce as similar clusters as possible across the four Nordic countries under study. The country‐specific cluster results reported in Chapter 3 are used as key inputs for the cluster analyses undertaken in the next two chapters, where we explicitly aim at improving the comparability of early school‐ to‐work trajectories across the four Nordic countries by identifying what we have labelled “common” Nordic school‐to‐work trajectories (Chapter 4) and “stylized” school‐to‐work pathways for the Nordic countries (Chapter 5). For the cluster analysis undertaken in Chapter 4 we have for each country made a list of the observed trajectories (sequences of activities) from age 16 up to age 20 and then calculated the number of young people following each of these sequences. This country‐specific information is then pooled into one big data to which we apply cluster analysis in order to allocate all these trajectories of Nordic youth across ten clusters “common” for the four Nordic countries under study.1 This
approach allows interesting patterns common to the Nordic countries to be identified. Also this analysis is undertaken separately for all young people and non‐completers. In Chapter 5, the focus is on comparing a set of “stylized” school‐to‐ work pathways constructed for the four Nordic countries under study. In brief, the basic idea is to first select a number of “typical” early school‐ to‐work trajectories based on the results obtained in Chapter 3, and then allocate the trajectories of all other young people across these “typical” pathways. By using identical “typical” early school‐to‐work trajectories as the point of departure for all four Nordic countries, we are able to shed further light on both similarities and dissimilarities across the four countries in relation to young people’s post‐compulsory‐school experi‐ ences up to age 20. However, in contrast to the analyses reported in the previous chapters, Chapter 5 is restricted to non‐completers only, that is, ────────────────────────── 1 Hence, for producing the common Nordic cluster results reported in Chapter 4, we have not merged indi‐ vidual‐level data for the four Nordic countries under study. Instead, we have merely combined information on individual trajectories showing sequences of activities from age 16 up to age 20. We have asked for and also received permission from the respective statistical bureaus to undertake such a pooling of country‐ specific individual trajectories.
to those young people who have no degree beyond the compulsory‐ school exam still five years after leaving basic education. A main reason for this choice of focus is that the group of young completers is highly similar in the four countries, whereas we see both striking similarities and distinct differences between the four Nordic countries when it comes to non‐completers. By complementing the results produced for non‐completers in the previous chapters with information provided by these “stylized” school‐to‐work pathways, we obtain a fuller picture of the multitude of early post‐compulsory trajectories followed by Nordic non‐completers.
After Chapter 5, our focus turns from exploring young people’s main activities and school‐to‐work‐transition patterns over the five years following upon compulsory education (i.e., from age 16 up to age 20) to investigating what happens to these youngsters after they have turned 20. What kind of main activities – studying, employment, unemploy‐ ment, disability arrangements or other types of inactivity – are they mostly engaged in as young adults? Can we observe distinct and rather stable differences in this respect across genders, on the one hand, and between those differing in their educational background, on the other hand? Or is it possible that these later outcomes are, by and large, quite similar for young men and women, as well as for early and later com‐ pleters of an upper secondary degree and, possibly, even for adult non‐ completers, i.e. those with no exam beyond primary education still in adulthood? Can we identify conspicuous variations across cohorts obvi‐ ously related to fluctuations in the economic environment, or is the eventual impact of economic shocks rather outweighed by other pro‐ cesses and mechanisms affecting the labour market situation of young people representing different cohorts? Last, but not least, can we identi‐ fy clear‐cut similarities or dissimilarities in all these important dimen‐ sions across the four Nordic countries under study? Chapter 6 sets out to provide answers to these key questions.
While Chapter 6 gives a description of young people’s labour mar‐ ket situation in adulthood, Chapter 7 looks into the background of these young people in an attempt to identify factors that seem to be especially strongly related to the labour market outcomes observed up to age 31. Our statistical analysis relies on so‐called multinomial logit models which show the probability of belonging to one of several mu‐ tually exclusive groups, given a particular set of background character‐ istics. In our case, these groups are made up of the five main categories of labour market activities used in the previous chapters: full‐time student, employed, unemployed, disability beneficiary or outside all of
these activities (“other”). The background factors accounted for in these multinomial logit models can be divided basically into two groups: one reflecting family background and the other early school‐ to‐work‐transition patterns, that is, trajectories followed straight after completion of compulsory education up to age 20. Additionally, we account for gender as well as cohort. Accounting for cohort is relevant as we base our analysis on the pooled information available for all three youth cohorts under scrutiny, i.e., those young people who turned 16 in 1993, 1998 and 2003, respectively.
The last chapter of this report, Chapter 8, gathers and discusses the main findings presented in the previous chapters. While each chapter presenting our results, that is, Chapters 3 to 8, contains several sections titled “Main findings” – one for each sub‐chapter – this concluding chap‐ ter aims to draw, based on our multifaceted results, a broader picture for the four Nordic countries under study. In other words, in this concluding chapter we choose to overlook the multitude of more detailed findings reported and discussed in the separate chapters and sub‐chapters. This does by no means imply that these details are trivial. Instead, this way of presenting the main results of our study is the product of a deliberate choice with overall conclusions and remarks given in Chapter 8, with theme‐specific conclusions drawn together in the sections titled “Main findings”, and detailed country‐specific as well as cross‐country results and conclusions reported and discussed throughout the text.
1. Performance of young people
– an international
perspective
The main focus of this chapter is on exploring what internationally wide‐ ly‐used indicators can tell us about educational outcomes, school‐to‐ work transitions and labour market performance of young people in the Nordic countries. Simultaneously, the information mediated by these overwhelmingly static indicators serves as an important benchmark when we, starting in the next chapter, turn to presenting results ob‐ tained based on our national longitudinal datasets.
1.1 Setting the stage
The youth population has been the most affected by the recent global crisis. There are several obvious reasons why young people have been hit so hard (see e.g. OECD, 2009, 2010a; Scarpetta et al., 2010). School‐ leavers are often the first to encounter difficulties: when the labour market deteriorates, employers shed workers and also become much more selective in their hiring of new staff. As those making the transition from school to work compete with more experienced workers for (few‐ er) jobs, they often face virtually impossible barriers when trying to get a foothold in the labour market. However, the crisis has posed challeng‐ es also to those youth who were already in the labour market but hold‐ ing temporary jobs and/or working in business‐cycle sensitive indus‐ tries; they have often been among the first to lose their jobs. And with the labour market having become more selective, the risk of unemploy‐ ment for recent entrants is notably higher among those lacking relevant skills or experience and, conversely, they also face particular difficulties in finding a new job.
The relatively higher vulnerability of youth to unemployment and inactivity was, in effect, a widely recognised problem in many Europe‐ an countries even before the onset of the economic crisis. Particular attention was thereby paid to the multiple barriers in finding work
faced by low‐skilled youth, that is, early school‐leavers. Indeed, many European economies were already before the crisis tackling a number of labour market problems – judged to affect adversely the transition from school to work of youth as well as their initial labour market ex‐ periences – in order to cope with unacceptably high youth unemploy‐ ment and inactivity rates.
The recent economic crisis is commonly seen to have aggravated many of these structural problems and, consequently, the situation of especially those youth whose labour market prospects were weak al‐ ready prior to the crisis. The Nordic countries are no exception to this pattern, as shown in statistics compiled by notably Eurostat, ILO and OECD. In particular, although there were significant pre‐crisis differ‐ ences both in the level and evolution of youth unemployment also across the Nordic countries, they are nonetheless characterised by two distinct features which they share with the rest of Europe. First, youth face a clearly higher risk of unemployment than adults also in Northern Europe. However, while the youth/adult unemployment ratio (for 2008) falls within the interval 2 to 3 for most OECD countries, it rang‐ es between 3 and 4 in seven countries, three of which are located in the northern part of Europe (Denmark, Finland and Norway), and settles above 4 in only two countries – Iceland and Sweden (Scarpetta et al., 2010, pp. 11–12). Second, all Nordic countries have experienced a marked increase in youth unemployment since the recession began.
Increasing youth unemployment rates in combination with discour‐ aging estimates of the likely short‐term evolution of youth unemploy‐ ment soon triggered, in individual countries, a multitude of actions aimed at cushioning the effects of the crisis on youth while, simultane‐ ously, pushing forward the long‐term agenda of necessary structural reforms for tackling pre‐crisis youth unemployment problems. A major challenge has thereby been to devise short‐term measures which do not conflict with but, preferably, complement and support the long‐term reform agenda of promoting more and better jobs for youth in response to projected demographic changes. The short‐ and long‐term measures planned and realised in individu‐ al countries have been surrounded by a myriad of activities initiated, not least, by the European Commission and the OECD. The many initiatives of the European Commission were brought to a head in the Europe 2020 framework launched in March 2010 [COM(2010)2020] as a continuation of the Lisbon process. This EU strategy for smart, sustainable and inclu‐ sive growth has a strong youth dimension, as have several of its accom‐ panying flagship initiatives, most notably “Youth on the Move”
[COM(2010)477] and “An Agenda for New Skills and Jobs” [COM(2010)682], but also the Horizon 2020 financial instrument aimed at securing Europe’s global competitiveness. Illustrative examples of recent actions supplementing the Youth on the Move education and em‐ ployment initiative include an action plan to reduce early school leaving in the EU [COM(2011)18, COM(2011)19, SEC(2011)96], and the Youth Opportunities Initiative [COM(2011)933] launched in December 2011, which can be described as a set of measures, planned for 2012 and 2013, to drive down youth unemployment. The Youth Employment Package adopted in December 2012 can be seen as a key milestone of this YOI. Most notably, this package of Commission proposals to fight youth un‐ employment recommended that member states introduce a Youth Guar‐ antee, launch a consultation of European social partners on a Quality Framework for Traineeships, and announce a European Alliance for Apprenticeships. The EU countries endorsed the principle of the Youth Guarantee in April 2013. Until the end of 2014, the EU provided an ad‐ vice service on apprenticeship and traineeship schemes in order to sup‐ port its Member States to develop high quality apprenticeship and train‐ eeship programs. Complementary to the Youth on the Move flagship initiative of the Eu‐ rope 2020 strategy is, inter alia, the EU Youth Strategy: Council Resolution on the renewed framework for European cooperation in the youth field (2010–2018) (OJ C 311, 19.12.2009, pp. 1–11). A particular feature of this strategy is that an EU Youth Report is to be drawn up at the end of each three‐year cycle to evaluate the progress made towards the overall objec‐ tives of the strategy, on the one hand, and to serve as a basis for establish‐ ing a set of priorities for the coming work cycle, on the other. The first work‐cycle EU Youth Report [COM(2012)495 final] was published in Sep‐ tember 2012 and adopted as a Joint Council–Commission Report in No‐ vember 2012. In relation to the EU Youth Strategy, a dashboard of EU Youth Indicators was released in 2011 [SEC(2011)401]. Key instruments to support the EU Youth Strategy are, most notably, the Lifelong Learning and Youth in Action programs and the Erasmus for All program. Among the many recent initiatives of the OECD, two in particular de‐ serve to be mentioned here. The first is the High‐Level Policy Forum on Jobs for Youth: Addressing Policy Challenges in OECD Countries, which was organised jointly with the Norwegian Ministry of Labour in late September 2010. The main issues and policy recommendations on how to tackle youth unemployment problems presented at this Forum, and later published in a comprehensive report (OECD, 2010b), synthesised the findings of thematic reviews of Jobs for Youth undertaken over the
years 2006–2009 in 16 member countries. While the review for Norway (OECD, 2008c) took place against the background of a buoyant economy, the corresponding review for Denmark (2010c) was more concerned with youth unemployment in the context of the ongoing economic crisis. These thematic reviews did not cover Finland, Iceland or Sweden, though. This High‐Level Policy Forum was preceded, about one week earlier, by a joint ILO–IMF conference – also arranged in Oslo but in co‐ operation with the Office of the Prime Minister of Norway – on The Chal‐ lenges of Growth, Employment and Social Cohesion, one focus of which was youth unemployment (ILO–IMF, 2010). A second key initiative of the OECD is the so‐called OECD Action Plan for Youth, launched in 2013 as an integral part of OECD’s work on youth, and the high‐level meetings and comprehensive reports related to the implementation of the plan (http://www.oecd.org/employment/action‐plan‐youth.htm).
1.2 Snapshot of recent Nordic comparative studies
The Nordic Council of Ministers has also in recent years initiated several reports on how the youth unemployment problem is addressed in the Nordic countries. Especially the following reports should be mentioned in this context. A report edited by Markussen (2010) focuses on dropout in upper secondary education in the Nordic countries. In particular, for each Nordic country it provides an overview of the structure of upper secondary education, looks at research and results on dropouts, gives an overview of implemented measures to reduce dropout and improve through‐put of students and, finally, assesses possible effects of the im‐ plemented measures. It concludes by pointing to the need for further reforms to reduce dropout and improve levels of upper secondary com‐ pletion. Another report, by Engberg (2014), continues on this topic in the sense that it describes the reforms and other actions carried out in the Nordic countries concerning vocational and apprenticeship training, and also reflects on the challenges characterising these systems, using desk studies and interviews with national experts as analytical tools. Still another report of some relevance in this context describes both existing and planned measures, as initiated by relevant government departments, to prevent youth unemployment in the Nordic countries (Ramböll Management Consulting AB, 2010). The report reviews both short‐term measures implemented during the economic crisis and long‐ term measures related to future demographic challenges. This reportalso relies on desk studies and interviews with national experts and public servants within the fields of education and labour markets.
While this kind of comparative analysis of short‐ and long‐term measures can provide important information on what is done and planned – and in relation to which target group(s) and with which ex‐ pected outcomes in mind – in different countries, they can tell little, if anything, about the genuine impact of the measures undertaken. Such information can be obtained only by means of carefully designed and performed evaluation studies. However, the international research fo‐ cusing on in‐depth evaluation of various modes of measures directed at disadvantaged and/or unemployed youth is still surprisingly scant. More important, the evidence produced by such evaluations has, so far, been rather discouraging when it comes to both impact and effectiveness [see e.g. the reviews by Asplund (2009) and Asplund and Koistinen (2014) and, especially, the references therein]. Also worth mentioning in this context is a recent report by Halvorsen et al. (2012) on the transition between school and work for particularly vulnerable groups of youth. It concludes that between 2% and 5% of the youth cohorts are already “outsiders”. The report summarises the existing knowledge on vulnerable youth, discusses challenges and policy measures in the Nordic countries, with particular attention paid to youth, and sug‐ gests the building of a Nordic knowledge bank for good practices.
1.3 The Nordic story told by international
comparative indicators
Another source highlighting the youth unemployment problem from a cross‐country perspective contains indicators developed and compiled mainly by Eurostat and OECD, and published on a regular basis. Excel‐ lent examples are Eurostat’s statistical portraits of youth in Europe and the OECD’s Education at a Glance reports. In this sub‐chapter, we draw on some of these statistical sources to provide an overview of recent developments in the Nordic countries, also in comparison with the rest of Europe and the OECD area.
While offering comprehensive information, these sources also have their shortcomings. First, the provided information is basically static in nature in the sense that it gives a snapshot of the situation in – typically – a specific year, and compares the findings with corresponding information from a previous year (given that such information is available). According‐ ly, this type of year‐specific information highlights the average situation at
a given point in time, but can say nothing about the underlying dynamics such as the shifts over time of young people between education, work, unemployment and inactivity. Second, indicators aiming to describe at least some specific dynamic aspect of this continuous transition process can usually be derived only for a limited number of countries with the Nordic countries mostly being surprisingly weakly represented.
This is the prevailing situation also in specific studies, of which Quin‐ tini and Manfredi (2009) is an illustrative example. They address a topi‐ cal issue – the dynamic nature of youth labour market situations and key pathways of youth leaving secondary education – but, due to data limita‐ tions, they can only include Denmark and Finland out of the Nordic countries and only up to the year 2001. Simultaneously, this highlights the lack of extensive cross‐country comparative evidence on the dynam‐ ic nature of the labour market situation of youth in the Nordic countries and the key pathways followed by school‐leaving youth having acquired different levels of education – not merely a secondary diploma as in the Quintini and Manfredi (2009) study. Indeed, this is the kind of analysis that we will undertake in the subsequent chapters of this report. A key challenge when addressing the issue of young people’s unem‐ ployment problems and risks of marginalisation is that the youth popu‐ lation is far from homogenous. School‐leavers are equipped with differ‐ ent quantities and qualities of formal education. They also differ in a multitude of other dimensions, including school experiences and early lifetime experiences, notably family background. Their transition from school to work and initial labour market experiences reveal considera‐ ble variation both in length and quality. This variation has been shown to partly originate in differences in the school‐leavers’ educational and social background (e.g. Markussen, 2010). However, it has also been maintained to largely reflect the functioning of the labour market, that is, the labour market institutions in force and the labour market policies pursued in a rapidly changing economic and social environment. Indeed, several reports have shown that the conditions for young people to es‐ tablish themselves in the labour market reveal important differences also across the Nordic countries (see e.g. Olofsson and Wadensjö, 2007; Olofsson and Panican, 2008).
Furthermore, while early unemployment is known to affect the youth to a substantial degree, it is also recognized that the short‐ and long‐ term consequences of early unemployment differ markedly across young individuals. As pointed out in the outset, a growing body of litera‐ ture – with evidence emerging also for the Nordic countries – indicates that spells of unemployment entail the risk of creating permanent scars
especially for disadvantaged youth who tend to be particularly ill‐ prepared for today’s labour market.
Our subsequent comparisons, based on available international data, clearly illustrate how important it is to distinguish between young peo‐ ple’s different situations and composites of activities also when undertak‐ ing international comparisons. In particular, since young people often combine school with part‐time work, especially in the Nordic countries, the results obtained vary substantially with the way in which the status of youth is measured. Let us start by first reflecting on youth employment.
1.3.1 Youth employment
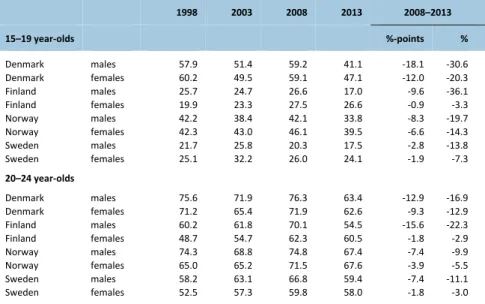
Our national longitudinal datasets cover three full youth cohorts: all young people turning 16 in 1993, 1998 or 2003 (see Chapter 2). We therefore start by illustrating – using OECD statistics – the overall em‐ ployment situation for young people five years later, that is, when our young people turned 21. By this age, most of them could be expected to have completed an upper secondary degree. What actually happened to the young people contained in our three youth cohorts will become evi‐ dent in the next chapter. Table 1.1 presents OECD employment population ratios for the Nor‐ dic countries for four selected years: in 1998, 2003 and 2008, as well as in the last year of available data, 2013. In all these years, Denmark shows up with the highest employment population ratio, both for the very young and for the 20–24 year‐olds, followed by Norway, Finland and Sweden. However, the table also reveals that Denmark experienced a marked decline in employment population ratios up to 2003, that Fin‐ land saw a clear improvement in employment population ratios between 2003 and 2008, and that the employment population ratios of Norwe‐ gian males deteriorated in 2003 but recovered by 2008, whereas the employment population ratios of Swedish males started increasing al‐ ready in 1998. In all four countries, there was a remarkable drop in the employment population ratios of young people between 2008 and 2013. This decline was notably stronger for young men than for young women.
Table 1.1: Employment population ratios (%) for Nordic youth in 1998, 2003, 2008 and 2013 1998 2003 2008 2013 2008–2013 15–19 year‐olds %‐points % Denmark males 57.9 51.4 59.2 41.1 ‐18.1 ‐30.6 Denmark females 60.2 49.5 59.1 47.1 ‐12.0 ‐20.3 Finland males 25.7 24.7 26.6 17.0 ‐9.6 ‐36.1 Finland females 19.9 23.3 27.5 26.6 ‐0.9 ‐3.3 Norway males 42.2 38.4 42.1 33.8 ‐8.3 ‐19.7 Norway females 42.3 43.0 46.1 39.5 ‐6.6 ‐14.3 Sweden males 21.7 25.8 20.3 17.5 ‐2.8 ‐13.8 Sweden females 25.1 32.2 26.0 24.1 ‐1.9 ‐7.3 20–24 year‐olds Denmark males 75.6 71.9 76.3 63.4 ‐12.9 ‐16.9 Denmark females 71.2 65.4 71.9 62.6 ‐9.3 ‐12.9 Finland males 60.2 61.8 70.1 54.5 ‐15.6 ‐22.3 Finland females 48.7 54.7 62.3 60.5 ‐1.8 ‐2.9 Norway males 74.3 68.8 74.8 67.4 ‐7.4 ‐9.9 Norway females 65.0 65.2 71.5 67.6 ‐3.9 ‐5.5 Sweden males 58.2 63.1 66.8 59.4 ‐7.4 ‐11.1 Sweden females 52.5 57.3 59.8 58.0 ‐1.8 ‐3.0 Note: The employment population ratio measures the employed as a percentage of the population in the age group. Source: OECD Labour force statistics. OECDiLibrary. Figure 1.1 extends the picture by showing employment population ratios of youth aged 15–24 for the Nordic countries in comparison with select‐ ed large OECD economies (with the information referring to the 1st quarter of 2012). The employment population ratios displayed in the figure are measured in two different ways: the vertical axis gives the employment population ratio for all young people, whereas the horizon‐ tal axis restricts the employment ratio to non‐students only, as youth employment ratios can be criticised for being blurred by pupils and stu‐ dents working part‐time while in school. This setting reveals that Den‐ mark, Iceland and Norway have high youth employment ratios, together with Germany, the UK and USA, also when account is made for part‐time working students. Finland and Sweden, on the other hand, move from above the OECD average to below the OECD average when the youth employment ratio is adjusted with respect to students working on a part‐time basis.
Figure 1.1: Employment population ratios (%) for all young people aged 15–24 (vertical axis) and separately for non‐students only (horizontal axis), 2012 (1st quarter) Note: The employment population ratio measures the employed as a percentage of the population in the age group. Source: OECD based on national Labour Force Surveys.
1.3.2 Youth unemployment
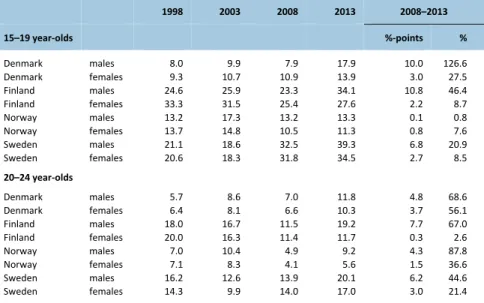
Unemployment is a much more widespread phenomenon among youth than among adults virtually everywhere. Young people are also the first to be hit by rising unemployment, and typically the last to benefit from recovering labour markets. Table 1.2 shows unemployment rates, meas‐ ured as a percentage of the labour force, for the four Nordic countries under study in the years 1998, 2003, 2008 and 2013. Among young peo‐ ple under age 20, Denmark stands out with a comparatively low unem‐ ployment rate in 1998, whereas Finland was still struggling with high post‐recession youth unemployment. The unemployment rate of the very young has been increasing in all four countries from 1998 to 2013, except for Norway where it has declined, but only among young women. The unemployment rates of young people aged 20–24 are also high, but not as dramatically high as for those aged 15–19. Yet, in both Finland and Sweden, about one‐fifth of the male labour force of 20–24 year‐olds was unemployed in 2013, according to OECD statistics.Table 1.2: Unemployment rates (%) for Nordic youth in 1998, 2003, 2008 and 2013 1998 2003 2008 2013 2008–2013 15–19 year‐olds %‐points % Denmark males 8.0 9.9 7.9 17.9 10.0 126.6 Denmark females 9.3 10.7 10.9 13.9 3.0 27.5 Finland males 24.6 25.9 23.3 34.1 10.8 46.4 Finland females 33.3 31.5 25.4 27.6 2.2 8.7 Norway males 13.2 17.3 13.2 13.3 0.1 0.8 Norway females 13.7 14.8 10.5 11.3 0.8 7.6 Sweden males 21.1 18.6 32.5 39.3 6.8 20.9 Sweden females 20.6 18.3 31.8 34.5 2.7 8.5 20–24 year‐olds Denmark males 5.7 8.6 7.0 11.8 4.8 68.6 Denmark females 6.4 8.1 6.6 10.3 3.7 56.1 Finland males 18.0 16.7 11.5 19.2 7.7 67.0 Finland females 20.0 16.3 11.4 11.7 0.3 2.6 Norway males 7.0 10.4 4.9 9.2 4.3 87.8 Norway females 7.1 8.3 4.1 5.6 1.5 36.6 Sweden males 16.2 12.6 13.9 20.1 6.2 44.6 Sweden females 14.3 9.9 14.0 17.0 3.0 21.4 Notes: The unemployment rate measures the number of unemployed as a percentage of the labour force in the age group. Note also that Sweden undertook, in 2007, a harmonisation of the unem‐ ployment definition towards the one used by ILO. This harmonisation seems to be overlooked in the OECD statistics, implying that the Swedish figures for 1998 and 2003 are not directly comparable with those for 2008 and onwards. Based on harmonised data, the unemployment rate of 15–19 year‐old males and females was in 2003 27.1% and 23.8%, respectively. These rates notably exceed those given above. The discrepancy is much lower for 20–24 year‐olds: an unemployment rate of 14.8% for men and 12.5% for women according to harmonised data published by the Swedish statistical bureau SCB. Source: OECD Labour market statistics. OECDiLibrary.
The unemployment rates reported in Table 1.2 are commonly used in international comparisons of youth unemployment. They are based on Labour Force Survey (LFS) data and measured in a traditional way: by relating the number of unemployed to the total labour force (employed + unemployed). This ILO–LFS measure of unemployment is based on ques‐ tions in the LSF asking the interviewees, inter alia, whether they have been actively looking for a job during the past four weeks. The LFS measure of the total number of unemployed may, as a consequence, also include young people who are actively looking for a job while also being enrolled as full‐time students.
Another way of measuring unemployment is to rely on registered un‐ employment, which merely comprises those who have registered as unemployed jobseekers at an unemployment office (PES). The extent to which registered unemployment includes full‐time students depends on the eligibility conditions of young people for registering as unemployed jobseekers. Table 1.3, which is reproduced from Halvorsen et al. (2012), shows the percentage share of youth in each age group registered as
unemployed in the years 2000 and 2005–2009. We note that the differ‐ ence between registered unemployment and LFS unemployment is par‐ ticularly large for young people, especially for Sweden. A major reason for this discrepancy is that registered unemployment is typically lower among young people not eligible for unemployment benefits. Table 1.3: Registered unemployment rates (%) for Nordic youth, 2000 and 2005–2009 Age 2000 2005 2006 2007 2008 2009 Denmark 16–19 1.0 0.8 0.7 0.7 1.0 20–24 4.7 3.7 2.7 2.5 4.7 16–64 5.3 4.2 2.9 2.1 3.6 Finland 16–19 3.2 2.5 2.4 2.4 2.7 3.5 20–24 9.4 9.0 8.6 8.1 8.4 10.9 Iceland 16–19 0.7 0.9 0.5 0.4 0.9 3.6 20–24 1.1 2.4 1.4 1.0 2.1 9.9 16–70 1.1 1.7 1.1 0.5 1.4 6.8 Norway 16–19 1.2 1.2 1.0 0.7 0.7 1.0 20–24 3.3 4.5 3.2 2.2 2.0 3.5 16–74 2.7 3.5 2.6 1.9 1.7 2.7 Sweden 16–19 1.5 2.2 1.8 1.6 1.8 2.9 20–24 5.0 5.7 5.9 5.0 4.0 6.0 16–64 4.1 4.2 3.6 2.9 2.8 4.0 Notes: The unemployment rate measures the number of registered unemployed as a percentage of the population in the age group. Information for the year 2000 is missing for Denmark while infor‐ mation on all age groups combined is not available for Finland. Source: Halvorsen et al. (2012). Also the information on unemployment contained in our national longi‐ tudinal datasets used in the subsequent chapters refers to registered unemployment. However, it differs from the information underlying the registered unemployment reported in Table 1.3, as our datasets are re‐ coded to identify all young people enrolled in education as full‐time stu‐ dents also when they appear as employed or unemployed in the original data (see further Chapter 2). Indeed, as in the case of youth employment, the way full‐time students are treated makes a big difference also when calculating youth unemployment rates. We illustrate this by going back to the LFS data to show what happens to the ranking of the Nordic coun‐ tries depending on the unemployment measure used. We thereby start by showing, in Figure 1.2, the number of students as a percentage share of the population in the age group. In the LFS data, more than 80% of those aged 16–19 report studying to be their main activity. For those aged 20–24, this share is notably lower, ranging from
40 to almost 60% with Denmark having the highest and Sweden the lowest share of young people reporting studying as their main activity. In view of these large shares of students in both youth populations, it is obvious that the results obtained depend critically on the way students are treated in the calculations. Figure 1.2: Students as a share (%) of the population in the age group, for four Nordic countries Note: Students are defined as young people who report studying to be their main activity in the LFS. The drops in the series in 2005 for Norway and Sweden are most likely due to data issues. Cf. the notes in Table 1.2. Source: Own calculations based on LFS quarterly data. Let us now return to unemployment. Figure 1.3 provides information on youth unemployment from the 1st quarter of 2012 for the Nordic coun‐ tries as well as for a selected number of non‐Nordic countries. The hori‐ zontal axis measures the unemployment rate, that is, the number of un‐ employed as a percentage of the labour force. Sweden comes out with a higher youth unemployment rate than the average for Euro countries (EURO). Sweden, together with Finland, also ranks higher than both the UK and the USA.
The vertical axis, in turn, measures youth unemployment by means of the unemployment ratio, that is, the number of unemployed as a per‐ centage of the whole youth population. While 23% of the European youth labour force is unemployed, these unemployed young people con‐ stitute less than 10% of the youth population. In terms of the unem‐
ployment ratio, however, all Nordic countries except Norway score higher than the average for Euro countries. In both Iceland and Sweden, youth unemployment is, in fact, higher than in Italy when measured by means of the unemployment ratio. Figure 1.3: Youth unemployment rates (%) and unemployment ratios (%), the Nordic countries and selected non‐Nordic countries, 2012 (1st quarter) Notes: Unemployment rate = unemployed 15–24 year‐olds in relation to the labour force of the age group. Unemployment ratio = unemployed 15–24 year‐olds in relation to the whole population of the age group. Source: OECD as reproduced from Albæk et al. (2014). However, many of the young people recorded as unemployed in the LFS are actually attending school and, moreover, typically on a full‐time ba‐ sis. Figure 1.4 shows what happens when we remove from the pool of young unemployed those who report studying as their main activity. The vertical axis of Figure 1.4 now shows unemployed young persons who are not attending school. For the Euro area as a whole, the youth unem‐ ployment ratio drops from 9.3% to 7.2% of the youth population. For the Nordic countries, the change is even larger. After this correction, all Nordic countries rank among those with the lowest level of youth un‐ employment (among the non‐students).
The countries with the largest drop below the 45‐degree line added to Figure 1.4 are the ones with the largest proportion of unemployed youth who are also students. The pattern displayed in the figure thus arises from the fact that the unemployed young persons who are not at the same time attending school make up a smaller proportion in the Nordic countries
compared to the other countries in the figure. In all Nordic countries, the proportion of unemployed young people who are not also in school is less than one‐half, and as small as one‐third in Sweden.
The huge difference between youth unemployment ratios including and excluding unemployed students is also evident in the next two fig‐ ures which, moreover, separate 16–19 year‐olds from 20–24 year‐olds. A comparison of Figure 1.5a with Figure 1.5b reveals a strikingly large drop in the unemployment ratio for the very young (16–19 year‐olds) when leaving out students recorded as being unemployed. Figure 1.4: Youth unemployment ratios (%) with and without students, the Nordic countries and selected non‐Nordic countries, 2012 (1st quarter) Notes: Unemployment ratio = unemployed 15–24 year‐olds in relation to the whole population of the age group. Unemployment ratio, non‐students = unemployed 15–24 year‐olds with studying not being their main activity, in relation to the whole population of the age group. The red line shows the 45 degree angle. Source: OECD, as reproduced from Albæk et al. (2014).
Figure 1.5a: Youth unemployment ratios (%) for four Nordic countries, 1995–2012 Notes: Unemployment ratio = unemployed in relation to the whole population of the age group. Cf. the notes in Table 1.2 concerning the unemployment information on Sweden prior to 2005. Source: Own calculations based on LFS quarterly data. Figure 1.5b: Youth unemployment ratios (%), excluding students, for four Nordic countries, 1995–2012 Notes: Unemployment ratio = unemployed in relation to the whole population of the age group. Students are defined by self‐reported main activity. Cf. the notes in Table 1.2 concerning the unem‐ ployment information on Sweden prior to 2005. Source: Own calculations based on LFS quarterly data.
1.3.3 NEET rates
NEETs refer to young people who are Not in Employment, Education or Training. Figure 1.6 gives NEET rates for the last quarter of 2012 for 15–24 year‐olds in OECD countries, measured as a percentage of the total population in the age group. The Nordic countries are located rela‐ tively high up on this ranking scale, implying that they are characterised by low NEET rates. For 2012, the share of young people in NEET activi‐ ties was estimated to be 5.9% for Denmark, 6.7% for Norway, 7.2% for Sweden and 8.4% for Finland. All in all, the information provided so far shows that the labour mar‐ ket is quite accessible for young people in the Nordic countries. In par‐ ticular, employment rates are relatively high among those who do not attend school and, conversely, unemployment rates are relatively low. The descriptive evidence presented above also implies that the attach‐ ment to the labour market is relatively strong also among young people attending school. This follows from the fact that large shares of young people recorded to be employed or unemployed are, actually, pupils and students with studying as their main activity. Simultaneously, they are an integral part of the labour force. Figure 1.6: NEET rates (%) for 15–24 year‐olds in OECD countries, as split by unemployment and inactivity, 2012 (4th quarter) Notes: NEET rate = young people not in employment, education or training as a percentage of the population in the age group. Source: OECD Society at a Glance 2014.
1.3.4 Upper secondary education – completion, non‐
completion and dropout
Finally, we take a closer look at school completion, non‐completion and dropout with the focus being on upper secondary education. The pro‐ portion of 30–34 year‐olds holding an upper secondary degree is not particularly high in Denmark or Norway, as is evident in Figure 1.7. Fin‐ land and Sweden, on the other hand, rank quite high with more than 90% of the 30–34 year‐olds holding an upper secondary degree in 2012. If we explore the average age of upper secondary graduation (Figure 1.8), Sweden comes out with the lowest average age among the Nordic countries, or about 18 years‐of‐age. In the other Nordic countries, the average graduation age is much higher for both general programs and especially for vocational programs. Indeed, the average age of upper secondary graduation from vocational programs is 28 in both Denmark and Norway. For Finland, it is reported to be even higher. Figure 1.7: Attainment (%) of an upper secondary degree among 30–34 year‐ olds in OECD countries, 2012 Source: OECD Education at a Glance 2014.
Figure 1.8: Average age of upper secondary graduation in OECD countries, 2012
Source: OECD Education at a Glance 2014, Chart A2.2.
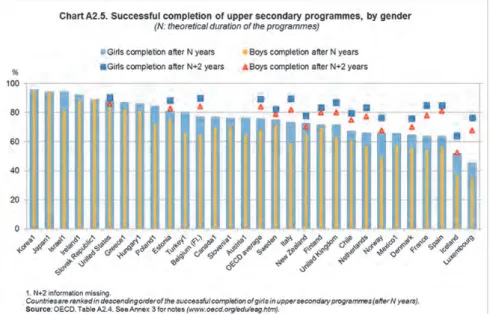
There are numerous ways to measure dropout or non‐completion rates from upper secondary education. Figure 1.9 illustrates the share of stu‐ dents who successfully completes after the theoretical duration of the upper secondary program, or two years after the theoretical duration of the program. The countries are sorted according to the successful com‐ pletion of girls in upper secondary programs. All Nordic countries rank below the OECD average, with Sweden and Finland doing slightly better than Denmark and Norway.
Figure 1.9: Upper secondary completion rates (%) in OECD countries, by gender
Source: Education at a Glance 2014. Chart A2.5.
Table 1.4, finally, presents alternative measures of completion rates, as reported by Eurostat and OECD. While Figure 1.9 gives the completion rates among those who attend upper secondary programs, Table 1.4 presents completion rates as percentage shares related to the whole youth population.
Table 1.4: Completion, early leaving and dropout rates (%) for the Nordic countries
Denmark Finland Iceland Norway Sweden
Upper secondary graduation rates < 25 year‐olds 2011 79.4 85.0 70.4 77.7 75.4 ≥ 25 year‐olds 2011 10.2 11.0 17.4 11.8 0 Total 89.6 96.0 87.8 89.5 75.4 Early school leavers 2007 12.9 9.1 23.2 18.4 8.0 (Eurostat) 2012 9.1 8.9 20.1 14.8 7.5 School dropouts 2009 14.2 9.7 55.2 20.3 7.4 (OECD scoreboard for youth) Notes: The first lines show expected graduation rates before and after the age of 25 as reported in the OECD publication Education at a Glance. “Early school leavers” (Eurostat) refer to persons aged 18–24 fulfilling the following two conditions: first, the highest level of education or training attained is ISCED 0, 1, 2 or 3c short; second, respondents declared not having received any education or training in the four weeks preceding the survey (numerator). The denominator consists of the total population of the same age group, excluding no answers to the questions “highest level of educa‐ tion or training attained” and “participation in education and training”. Both the numerators and the denominators come from the EU LFS (Eurostat). The OECD Scoreboard for youth: share of youth not in education and without an ISCED 3 degree.
The information contained in Table 1.4 clearly shows that the picture looks quite different depending on both the measure used and the time of measurement. Again, the reason for this is that youth career trajecto‐ ries are very heterogeneous, involving both multiple states at a given point in time (e.g. combined schooling and employment) and frequent transitions back and forth between different states (e.g. education– employment–unemployment–education). As we will show in the next chapter, non‐completion rates drop considerably over time within each cohort, and do not settle at a certain level until well into the thirties.
Any analysis of young people’s careers needs to handle this heteroge‐ neity in sensible ways. Indeed, one major purpose of the present report is to deepen our understanding of the different trajectories followed by youth up to age 20, to compare the patterns of trajectories across the four Nordic countries under study, and to link these patterns to labour market outcomes in adulthood. Simultaneously, many of the results and patterns reported in the subsequent chapters touch upon the overall picture medi‐ ated by the international and cross‐Nordic comparisons presented in this chapter. In particular, several of the distinct characteristics of the Nordic countries, when compared to non‐Nordic countries, will show up in the subsequent chapters. This holds true also for many of the pronounced differences between the Nordic countries pointed out above. In our analy‐ sis, we aim at positioning them in a broader, more dynamic context, with a view of improving our knowledge on the performance of young people in school and in the labour market.
2. General description of post‐
compulsory‐school activities
This chapter introduces the national datasets underlying the empirical evidence reported in this volume. It also provides a general description of the main post‐compulsory‐school activities in which the young people covered by our data have been engaged in, with the emphasis being on their situation up to age 20. In other words, in this chapter we give an overall picture of young people’s activities over a time period which is often argued to be the most critical in terms of their future labour mar‐ ket outcomes. Additionally, we introduce our preferred definition of young people lacking an upper secondary certificate. More precisely, we prefer to call these young people “non‐completers”, as compared to “completers”, implying that they only have their compulsory‐school exam still five years after having left primary education. As shown in the previous chapter, both Eurostat and OECD label such young people in a different way – early school leavers and dropouts, respectively – and also define them slightly differently. A major reason for using the term “non‐ completers” is that, as will be highlighted below, large shares of them spend, in effect, a considerable amount of time as full‐time students but without completing an upper secondary degree. Calling them early school leavers or school dropouts would, therefore, mediate a mislead‐ ing picture of their actual situation. This, in turn, gives us also reason to contrast our non‐completers’ results to the early school leaving and dropout statistics reported by Eurostat and OECD for the Nordic coun‐ tries, information that was briefly reviewed in Chapter 1.
2.1 The national datasets used
This sub‐chapter provides a general outline of the national datasets used in our subsequent analyses of young people in four Nordic countries. More details on our data are given in Appendix 1.