A material study of insoles
Manufactured using different methods
Field of study: Material science for foot orthoses Author: Erik Hermansson, Marcus Ekberg Supervisor: Christina Zong-Hao Ma Jönköping 2019 May
Table of contents
Abstract ... 1
1. Introduction ... 1
2. Background ... 1
2.1 History of insoles ... 1
2.2 Application and function of insoles ... 2
2.3 Manufacturing of insoles ... 2 2.4 Cost differences ... 3 2.5 Additive manufacturing ... 4 2.6 Internal structure ... 5 2.7 Structural optimization ... 5 2.8 Materials ... 5 2.9 Mechanics ... 6 2.9.1 Shock absorption ... 6 2.9.2 Friction ... 6 2.9.3 Hooke’s law... 7 2.9.4 Shear stress ... 7 2.9.5 Material fatigue ... 7 3. Aim ... 8 4. Method ... 8 4.1 Participant ... 8
4.2 Production of insole samples ... 8
4.3 Testing machine ... 8 4.4 Outcome measures ... 9 4.5 Test standard ... 9 4.6 Pilot tests ... 9 4.6.1 First test ... 9 4.6.1.1 First sample ... 10 4.6.1.2 Second sample ... 10 4.6.1.3 Third sample ... 10 4.6.2 Second test ... 10 4.6.2.1 First sample ... 10 4.6.2.2 Second sample ... 10 4.7 Main test ... 10 4.8 Ethical considerations ... 10 5. Results ... 11 6. Discussion ... 12 6.1 Main result ... 12 6.2 Structural optimization ... 12 6.3 Pilot test ... 13
6.4 Samples ... 13 6.5 Machine ... 13 6.6 The pin... 14 6.7 Method... 14 6.8 Outcome measurement ... 15 6.9 Manufacturing of insoles ... 15 6.10 Ethical consideration ... 16 6.11 Friction ... 16 6.12 Further research ... 17 7. Conclusion ... 17 8. Acknowledgements ... 17 9. References ... 18 10. Appendix ... 22
10.1 Data sheet EVA ... 22
10.2 Ethical approval ... 23
10.2.1 Form for approval of participation in study ... 23
10.2.2 Consent form ... 24
10.3 Pictures of samples for the first pilot test ... 25
10.4 Pictures of samples for the second pilot test ... 25
10.5 Pictures of samples for the VF test ... 26
10.6 Pictures of samples for the SM test ... 26
10.7 Pictures of samples for the AM test ... 27
10.8 Calculation of number of steps for the total amount of cycles ... 27
10.9 Calculation of the internal stress ... 27
10.10 Calculation of the optimal pin ... 27
1
Abstract
Aim: The aim of this study is to evaluate if additive manufacturing (AM) is an appropriate
manufacturing method for insoles in comparison to vacuum forming (VF) and subtractive manufacturing (SM) in regards of material properties such as abrasion resistance. Background:
Traditionally insoles are manufactured with either VF or SM. AM has been around for some decades but implementation into orthotic and prosthetic (O&P) business has not been accomplished yet. Therefore, the quality of the products produced with AM must be tested in comparison with traditional methods.
Method: A comparison of samples for the mentioned manufacturing methods was done with the help
of an abrasion testing machine with the standard ASTM G133. Two samples were produced from each manufacturing method and respectively tested for one and two hours. All the samples were weighed before and after the tests with the help of a four decimal scale. The difference in weight before and after the test and coefficient of friction was evaluated. The weight difference was analyzed to see how much material had been removed from the sample. The percentage of wear loss was calculated for each specific sample, both for one hour and two hours of testing. No statistical analysis could be made due to the limited amount of samples and testing time. Result: No statistically significant could be found for either wear loss or the coefficient of friction as mentioned above. Conclusion: A conclusion whether which material having the best abrasion resistance for respectively manufacturing method could not be drawn due to limited results. This study can be seen as a pilot study where the methodology can be used in further studies. Further research on AM needs to be conducted.
Keywords: Additive manufacturing, insoles, abrasion resistance, internal structure, materials.
1. Introduction
Insoles have been used for several decades to adjust structural deformities and unload threatened areas that are exposed to pressure beneath the foot. To produce insoles, a representation of the patient feet's is required. This is usually made through casting or with the help of a foam box. During the recent years three-dimensional (3D) scanning has been implemented to get a representation of the feet. This representation of the feet makes it possible to manufacture individualized insoles. The manufacturing methods used today are vacuum forming (VF) or subtractive
manufacturing (SM). Materials which is being used according to Nole, Kowalsky, Garbalosa, Pollard and Thompson (2013) is ethylene-vinyl acetate (EVA) and in some cases combined with cork or plastic. This study investigates the material properties such as abrasion resistance of EVA compared to thermoplastic elastomer (TPE).
The reason why this study is made is to see if additive manufacturing (AM) using TPE could be a potential manufacturing method for insoles due to the abrasion resistance of the materials being used. To analyze the abrasion resistance for each manufacturing method and the included materials an abrasion machine was used with a roughened pin that goes back and forth in a linear direction upon the material to create friction resulting in wear. Each sample was weighted with a sensitive scale before and after the test to see how much material has been removed. The collected data was analyzed to draw a conclusion of whether VF, AM or SM has the best abrasion resistance.
2. Background
2.1 History of insoles
According to Kirby and Werd (2014) interventions like insoles are described to have
2 existed since 1845. Back then metal reinforced
leather strips inside of shoes were created to alleviate pathologies and deformities of the foot. 1958 an American podiatrist named Merton Root started to manufacture thermoplastic foot orthotics using casts from feet in what Root called “neutral position” (Kirby & Werd, 2014).
Cochrane (1940) describes an orthotic aid called Whitman brace is mentioned being used for treating foot pathologies as pes planus. The specific orthotic is not described in this correspondence but it is mentioned that it was created using plaster models cast in a corrected position and that it maintains the correct relationship between os talus and os calcaneus (Cochrane, 1940). Staats and Kriechbaum (1989) describe that using plaster models made it possible to treat people with foot orthotics made by thermoplastics. An issue noted in an article was that if the finished plaster models were to be stored for future use the high volume of service would create a storage problem. The authors proposed that this problem could be solved using computer-aided design and computer aided manufacturing (CAD/CAM). The foam boxes or plaster casts used to make a negative impression of the patient's foot would be scanned and modeled in a computer program (as will be described in section 2.3). The finished model would then be milled out of a block of the desired material. This would greatly decrease production time, cost and orthosis rejection. Future projects were to implement a 3D scanner with which to scan the patient's foot directly (Staats & Kriechbaum, 1989). Nole et al. (2013) describe how the technology developed even more, and 3D scanning of the patient’s feet was introduced as an optional casting technique. From this, the orthotist would get a 3D picture of the foot from which an insole could be created (Nole et al., 2013). This study investigates if AM as a technology has the potential to be complementary to traditional manufacturing methods.
2.2 Application and function of
insoles
According to Nole et al. (2013) foot orthoses or insoles have a lot of applications and can theoretically be used to treat a handful of
pathologies. How the insole is created depends on its intended use. There are many different pathologies, gait patterns and deformities that can be treated using foot orthoses. Some examples of different orthotic goals mentioned by Nole et al. (2013) could be to control the velocity and degree of ankle pronation. To redistribute plantar pressure to for example, give an ulcer a chance to heal. To support deformities in either the rear/forefoot or both to eliminate adverse consequences. To help the foot resist extrinsic forces of the leg that lead to abnormal pronation/supination of the foot. To improve calcaneal positioning at initial contact. To reposition the subtalar joint in a neutral position just before heel rise and fully pronate the midtarsal joint in order to make the foot into a rigid lever for propulsion. Allowing normal plantarflexion of the first ray and to stabilize the forefoot in response to the backward directed ground reaction force created during propulsion in terminal stance. To provide enough shock absorption during loading response (Nole et al., 2013).
Individualized made insoles combined with rehabilitation exercises has a good effect when it comes to removing pain and adjusting pressure distribution compared to using sham insoles (Yurt, Şener, & Yakut, 2018). Rehabilitation practice together with insoles has in the long term reduced pain and relieving pressure for the specific area that was treated (Hellstrand Tang et al., 2014).
2.3 Manufacturing of insoles
Nole et al. (2013) thoroughly described the different manufacturing methods that have been used throughout history. The oldest one was described by Merton Root. Root’s work in developing casting techniques, positive cast modeling methods and posting techniques is said to have enhanced the comfort and function of the foot orthotics (Nole et al., 2013).
Nowadays, according to Nole et al. (2013) there are multiple manufacturing methods depending on where the orthosis is created, which practitioner is treating the patient and what the purpose of the orthosis is. Generally, the standard procedure is to create a positive model of the patient's foot from which the
3 orthosis is created to satisfy both the goals of the
practitioner and the patient. How the positive model is made and how the insole is created differs between methods.
Traditionally, according to Nole et al. (2013) the patient was placed in a prone position with the feet free to manipulate. Plaster bandages of appropriate sizes were cut and applied to the patient’s feet. The pathologies were corrected, and the foot was manipulated in the most biomechanically favorable position before the plaster hardened. The plaster cast was filled with liquid plaster and a positive model of the patient’s feet had been created. Another method of creating a plaster model of the foot is using foam boxes. Variants of these foam boxes have been developed but the general idea is that the practitioner presses down the patient’s feet in the most biomechanically favorable position into the easily compressed foam, thus creating an impression of the feet in the foam. These foam boxes are filled with liquid plaster to create a positive plaster model. Since the CAD/CAM technology was introduced into orthotic practice digital casting has been an alternative for creating models of the feet. Using optic lasers, pressure mat systems or digital photography casts can be made (Nole et al., 2013). Molnár and Morovič (2018) explain that 3D scanning works by transmitting light from a projector onto the surface that is to be scanned. The light is then reflected onto the sensors of the camera (charged couple devices or complementary metal-oxide semiconductor sensors). The scanned points of the surface are then triangulated in relation to each other and to where the light projector is to determine their exact position (Molnár & Morovič, 2018).
Depending on the pathology the practitioner is trying to correct, different cast modifications are done as described by Nole et al (2013). The practitioner modifies the cast to ensure optimal biomechanical conditions for the patient's feet. Areas with excessive, harmful pressure are unloaded. Medial or lateral posting of either the rear or forefoot is made. This can be done both with CAD and by adding and removing plaster from the positive model. After this, the insole is then created “around” the positive model. One method is that different thermoplastic materials are heated up and formed around the
positive model. Nole et al. (2013) also mention that another method is to use a computerized numerically controlled (CNC) mill to subtract material from a block according to the modified CAD-model otherwise called SM. The insoles are then fitted into the patient’s shoes by the practitioner using grinding machines (Nole et al., 2013).
A study made by Telfer, Gibson, Hennessy, Steultjens and Woodburn (2012) investigated the intra and inter practitioner reproducibility when obtaining the foot shape in order to create insoles. It was a cross-sectional study with a convenience sample of 22 people. Two experienced podiatrists met the participants on two separate occasions. They performed casting using 3D-scanner, foam boxes and plaster casting concluding in a total of six casts taken per participant. Specific predetermined measurement of critical design parameters such as insole length, forefoot width, heel width and peak medial arch height. The intra and inter CAD-operator reproducibility was investigated. The results indicated that the intra and inter reproducibility was not enough for any of the six techniques a variability during the CAD-process was identified. How these results affect the function of the insole and the patient is not clear and would need further testing (Telfer et al, 2012).
2.4 Cost differences
Payne (2009) describes CAD/CAM as a more cost-effective manufacturing technique than other described techniques. Plaster casting is more expensive compared with scanning. The cost for plaster casting is 27.94 $ – 49.60 $ while scanning cost 3.30 $ - 10.00 $. A calculation for the time of work for each of the processes by the practitioner, manufacturing of the detail and the material cost is included. Thereby, it is more beneficial to use scanning in relation to plaster casting in the orthopedic department (Payne, 2007).
Lefteri (2014) mentions another reason how AM can be more efficient than SM. AM has the capability to produce details faster when it comes to small production quantities with mass customization. Material cost, production speed, machine cost, failure rate, maintenance and
4 electricity are included in the comparison.
When it comes to higher quantities with less customization SM is to prefer. AM is a feasible manufacturing method for insoles due to the fact stated earlier (Davia-Aracil, Hinojo-Pérez, Jimeno-Morenilla, & Mora-Mora, 2018). The price for AM materials is higher than the price for EVA which is below three dollars per kilogram (Lefteri, 2014).
SM has a side effect which is a waste of material compared to AM that allows a higher percentage of used material, almost 100 percent. Using AM will result in reduction of waste and material cost with up to 90 percent. AM may also be able to reduce the energy consumption with over 50 percent compared to SM according to Chu (2012).
2.5 Additive manufacturing
AM together with CAD could make it possible to manufacture individually customized insoles. This process is beneficial in the field of medicine due to the wide range of customized orthotics described by Molnár and Morovič (2018). To obtain a mesh file to work within CAD, 3D digitization is used to acquiring image data. The one used in the area of orthotics and prosthetics is active triangulation. The benefits of working with active triangulation are the low cost of 3D scanning equipment, enough accuracy, speed and practical usability (Molnár & Morovič, 2018; Veres, 2018).
According to Molnár and Morovič (2018) there are plenty of AM methods to choose from suitable for the medical field. Some of these are Stereolithography (SLA), Selective Laser Sintering (SLS), Poly Jet Modeling (PJM) and Fused Deposition Modeling (FDM). The mentioned methods above are the ones most used in the field of medicine. For individual orthopedic aids, FDM manufacturing is the most optimal (Molnár & Morovič, 2018). This because of the low price for the machine and the material.
Fused thermoplastic fibers are extruded through the heated tip of the printer head that moves in the X and Y axes in the transversal plane. Layer-by-layer in a two-dimensional plane is extruded on a platform until the
three-dimensional structure of the detail is fully created. The material comes in filaments that are fed to the machine through a nozzle. Either the platform or the nozzle moves up and down extruding the layer depending on which machine is being used. Water-soluble support material is often used for several of the AM methods to create a structure for overhanging surfaces. The support material can later be removed using a water-based liquid (Molnár & Morovič, 2018; Ngo, Kashani, Imbalzano, Nguyen, & Hui, 2018; Stucker, 2012)
The 3D model of the orthopedic aid is created using CAD software where the data from the active triangulation has been imported. This 3D model can be designed and changed based on the patient's needs according to Veres (2018). The file will be stored in a database and can be used several times with different adjustments. 3D digitalization and AM offer advantages as low material consumption and automated production meanwhile it is easy and fast to use well familiar to the program. Molnár and Morovič (2018) mentioned that it also enables a visually appealing solution for the patient. Another advantage is the archive. By storing all the files into a database makes it possible to easily search for a file. Challenges working with 3D-printing is related to the cost of investing in a 3D-printer at the orthopedic department, CAD software and license, maintenance and knowledge (Molnár & Morovič, 2018; Smith & Burgess, 2001; Veres, 2018).
The most common material for 3D-printing is polymers where thermoplastic filaments are included. Thermoplastic filaments are suited for many applications especially in the medical field due to the complex geometry (Ngo et al., 2018).
Usually, AM machines print the detail in one material, but it has been developed more advanced machines that can produce a multiple material detail. Vaezi, Chianrabutra, Mellor and Yang (2013) describing multiple material AM (MMAM), this method has the possibility to create more complexity and functionality in a detail such as various hardness in different areas. One-way that MMAM works including several filaments attach to separate nozzles which extrudes the usual way as FDM. This
5 combined with a CAD program where the user
can define the material settings for specific areas creates opportunities for product development. MMAM meets the needs where the regular AM systems don't fulfill the requirements but to a high cost (Vaezi, Chianrabutra, Mellor, & Yang, 2013).
Regular AM could theoretically be capable to produce details with areas in different hardness by managing the internal structure like cavities in the detail.
2.6 Internal structure
According to Brennan-Craddock, Brackett, Wildman and Hague (2012) AM utilize the complexity of doing advanced internal structures to obtain shock absorption properties. With the help of CAD, products can be designed in terms of function simultaneously as weight and size can be minimized. A product manufactured with AM is fabricated layer-by-layer and the material alternatives are restricted. CAD makes it possible to customize the internal structure and affect the properties to meet certain needs. Theoretically, cavities in the insole would generate shock absorption so long as the chosen materials are not too rigid. There are two types of structures, open cells and closed cells. Open cell structure absorbs energy through the struts buckling when air is pushing out compared to a closed cell where the walls bend when compression of air is accomplished. Both procedures will deform under a specific load but will revert to its original form when no load is applied unless the load gets too high and causes plasticity. The level of shock absorption is dependent on how rigid the materials are, how big the cavities are or how the internal structure is designed. When creating the internal structure consideration of machine must be taken due to the printer capacities (Brennan-Craddock et al., 2012).
Davia-Aracil et al. (2018) describe SM as a method that is being frequently used for producing insoles. The method has some downsides which are waste of material, hard to alternate materials in different areas and impossible to adjust the internal structure of the insole. AM fulfill these downsides but has limited materials to choose from to the same
price. It is possible to print out an insole with different shore in various areas but this to a high cost. Though the O&P business is small compared to other industries it is not beneficial to invest in these expensive printers. This could be solved by choosing a less expensive printer but change the internal structure of the insole. Adding hollowed areas for the internal structure of the insole could modify the shock absorption and flexibility. The internal structure shall be dependent on the shore grade for different areas. Using AM make it possible to produce insoles with an internal structure that is modified in different areas. By doing this, shock absorption can vary beneath different parts of the plantar surface of the foot. This will result in higher individual customization that SM cannot satisfy (Davia-Aracil et al., 2018).
2.7 Structural optimization
Huang and Xie (2010) describe structural optimization as a method to find the most profitable structure of the product, in this case the insole, while satisfying various constraints. This procedure offers a lightweight product with a low cost and with high-performance structure. Structural optimization can be divided into three categories which are 1) size, 2) shape and 3) topology optimization. Size optimization refers to finding the most favorable design such as thickness. Shape optimization refers to modifying the boundaries of the product to maintain the most optimal design. Topology optimization seeks to find the most optimal design by determining the best locations and geometries of cavities for the product (Huang & Xie, 2010).
2.8 Materials
Healy, Dunning and Chockalingam (2010) mentioned that when selecting a material for the insole there are some factors that must be considered. The material must be easy to produce and work with, have good durability and availability, favorable mechanical properties, subjective comfort and be affordable (Healy, Dunning, & Chockalingam, 2010).
According to Hsu, Michael, Fisk and Mojica, (2008) materials that have a low coefficient of friction will help decrease the sheer stress of the insole. When selecting a material for the insole
6 the sheer stress of the plantar surface must be
considered. Materials that are commonly used for insoles are rubber, plastic and cork. These alternatives provide structural stability. Increasing the density of the material and the thickness will enhance the stability even more. The mentioned materials can offer a combination of support and shock absorption properties. Depending on the density and thickness, the material will either have better stability properties or shock absorption properties. If the material is too thin or soft it will easily scar and tear. Another important aspect when choosing a material is the ability to resist permanent deformation (Hsu et al., 2008).
Lefteri (2014) describes that EVA is common to see as the material for the midsole in running shoes due to the fact it has good cushioning properties. It is also the most common material for insoles for both VF and SM. EVA is a thermoset polymer processed in a sheet form in different thickness and hardness. The form sheet usually consists of one layer with the same shore grade but can also be produced with several layers with different shore grade (Davia-Aracil et al., 2018). Another reason why it is being used for the midsole in the shoe is that it can withstand cold temperature without the material properties will be affected such as the flexibility mentioned by Lefteri (2014). The material doesn’t resist heat as well as coldness. When the temperature is too high around 45-65 degrees the material properties can be affected. It is also resistant to a wide range of chemicals. The flexibility of the material is depending on how much vinyl acetate the material contains. The EVA material is widely available and recyclable. EVA can be used in a wide range of products. According to Waterman and Ashby (1991a) there are several manufacturing techniques for EVA such as injection molded, extruded, blow molded and thermoformed.
EVA 50 shore has a density of 0.31 g/cm3 stated
through the test standard DIN 53526 and abrasion of 207 mm3 stated through the test
standard DIN EN 12770 with a load of 5 N (see Appendix 10.1).
According to Gaaz, Sulong, Akhtar and Raza (2015) TPE are versatile materials that offer
both soft and flexible solutions but nevertheless, they can be strong and rigid. TPE is well-used materials that are suitable for different types of products. These materials can be categorized between rubber and plastic due to their mechanical properties. Some of the properties for the materials are that they have high abrasion resistance and offers good elasticity (Gaaz et al., 2015).
Advantages using TPE described by Waterman and Ashby (1991b) is high tear strength and flexibility throughout wide range temperature. The material has relatively high stiffness and low bending resistance. To process TPE liquid casting, injection molding, compression molding, transfer molding, extrusion, centrifugal molding, calendering and VF of a sheet can be done (Waterman & Ashby, 1991b).
Thavamani and Khastgir (1997) mentioned that some tests of abrasion resistance for different blends of EVA have been performed. Using various techniques and machines called DuPont Abraders. Results have concluded that EVA and abrasion loss is positively, linearly related as long as the temperature is below 50-70°C where the crystalline segments of EVA start to melt, drastically changing the material properties (Thavamani & Khastgir, 1997).
2.9 Mechanics
2.9.1 Shock absorption
According to Grahn and Jansson (2013b), when two solid bodies with momentum collide, they will exert equal forces on each other. The resulting forces depend on the mass and the velocity of the colliding bodies and the deformation of the material (Grahn & Jansson, 2013b). Chiu & Shiang (2007) explains that a way to decrease deformation in one body is to deform a cushioning foam. In shoe application, the shock absorption of insoles increases with limited midsole cushioning (Chiu & Shiang, 2007).
2.9.2 Friction
Grahn and Jansson (2013a) describe friction as a force resulting from two surfaces sliding against each other. The force depends on the weight of the object and the coefficient of
7 friction µs. The value of µs varies depending on
the material, the “wetness” of the surface and if the scenario is static or dynamic (Grahn & Jansson, 2013a). This is called the dissipation of energy as the friction generates energy which to some degree translate into heat (Apazidis, 2004).
This study investigates the abrasion resistance of different materials. According to Grahn and Jansson (2013a) abrasion resistance is a property that partly results from friction. Friction is calculated by the following formula:
F = µs × m × g
g = 9.81 m/s2
For this study, the effects of frictional forces from the sock against the EVA are tested. Mean value of roughness for cotton fabrics (generally used for socks) is 23.67 μm (Sular, Öner, & Okur, 2014). The surface of the pin (see section 4.3) should be the same to simulate the roughness of a sock. A study was conducted by Liu (2018) were the roughness of different samples of sandpaper was tested. Two of the included sandpapers had a grit size of 180 respectively 320. The one with 180 had a roughness of 27.29 μm while 320 had a roughness of 17.92 μm (Liu, 2018).
2.9.3 Hooke’s law
According to Dahlberg (2001b) when a force acts upon a strut in a pulling fashion internal stresses arise. These stresses are calculated as the following:
σ = F / A
Where F is the force acting over the cross-sectional area A.
Deformation of a strut due to external pulling forces is usually called strain as explained by Dahlberg (2001c). The strain is calculated as follows:
ε = δ / L0
Where δ is the change of strut length and L0 is
the original strut length.
Dahlberg (2001a) describe that materials show different properties when stresses are acting upon them. Depending on the material and the amount of stress on the strut it will either show elastic or non-elastic/plastic properties. From strut testing with different stresses, a
stress/strain proportionality can be identified. The modulus of elasticity is this
proportionality when the properties of the material are elastic. It is calculated as following and is formally known as Hooke’s law
(Dahlberg, 2001a):
E = σ / ε
2.9.4 Shear stress
Shear stress is caused when translatory forces are created parallel to the material’s surface area (Dahlberg, 2001d). Rahemi et al. (2017) shown that loose-fitting shoes induce a plantar thermal stress response that may be due to shearing in the shoe-foot interface. Hamatani et al. (2016) described that shear stress give a higher risk of calluses forming in the feet during gait. As calluses are closely related to ulceration shear stress may be an important cause.
2.9.5 Material fatigue
Dahlberg (2001e) describes that material fatigue is a process where a small amount of load is applied to a structure for a lot of cycles. Somewhere during the fatigue process, a microcrack appears. With continued loading, the microcrack grows until the structure gives way and fails (Dahlberg, 2001e). Biofidelic fatigue trials of EVA have concluded that material energy absorption decreases and softens the material (Lippa, Hall, Piland, Gould, & Rawlins, 2014). According to Verdejo and Mills (2004b) EVA fatigue results from a decrease in the initial compressive collapse stress. This could be confirmed from Verdejo and Mills (2004a) who identified structural damage to EVA from running using a scanning electron microscopy.
8
3. Aim
The aim of this study is to evaluate if AM is an appropriate manufacturing method for insoles in comparison to VF and SM in regards to material properties such as abrasion resistance.
4. Method
4.1 Participant
To find a suitable candidate for the test the inclusion criteria was a person who could put load on the entire plantar surface of the foot. The exclusion criteria were no vascular diseases and no major structural foot deformities. This was decided through clinical experience by the acting orthotist at Skaraborgs Ortopedservice. They chose a pseudo-random candidate based on our criteria who participated in the study. A written and oral consent of participation was approved and signed by the participant before the study was initiated.
4.2 Production of insole samples
As described earlier there are three different manufacturing methods. The insoles for this study was produced from the same feet. The insoles manufactured using SM was obtained by Skaraborgs Ortopedservice from Cadmed Sweden. The VF insoles were also obtained from Skaraborgs Ortopedservice who used EVA form sheet from Mediroyal. Both insoles produced with VF and SM were made by the same orthotist at the mentioned P&O department.
The third manufacturing method is AM. To manufacture this type of insoles a structure sensor connected to an iPad was used. The milled insole received from the above company was scanned. Using this method, an almost identical insole was obtained and could be work within a CAD application such as Solidworks and Rhino. A mesh file is created when scanning an insole or a foot. A mesh file is a digital representation of a geometric model containing a collection of vertices, edges and faces that defines the shape. The faces usually consist of triangles because it simplifies the rendering. Opening a mesh file as a text document it includes the collection as mentioned above that
creates a grid visualized as a surface model. Rhino was used to edit the mesh file and refine the insole. In Rhino unnecessary polygons were deleted to get a smooth and clean surface. When this was done Solidworks was used to create a solid body from the surface and cavities in the heel could be applied. The imported surface was converted to a solid body. Trimlines were adjusted and the face up-side at the forefoot were flattened out. The plantar surface was also flattened out. To create the pattern for the cavities at the heel instructions described in the article (Davia-Aracil et al., 2018) was followed.
The chosen design for this study was a linear rectangular pattern distanced one mm from the top surface and two mm from the bottom surface. A two-dimensional sketch was done similarly to the described article and in relation to the features and settings of the 3D-printer at Jönköping School of Engineering in terms of geometry and size. The same tool to generate the cavities of the insole was not available, for this reason the cavities were made from the same principle. Through the sketch extrude cut was made with setting a distance from the plantar surface and a distance to the above surface. The model was cleaned up using chamfer to remove sharp edges. To 3D print the finished model an FDM 3D-printer at Jönköping School of Engineering was used. The name of the printer is Raise3D N2+ manufactured by the company Raise 3D in the USA, the serial number for the machine being used is 10111713009.
The selected material was TPE due to material alternatives that the school offered which worked with the 3D-printer. PRIMASELECT flex was used for the samples. PRIMASELECT flex is a thermoplastic copolyester (TPC) which is a group of TPE. The shore for the material is D 45 compared to the EVA sheet which has A 45. Shore A scale is used for soft elastomers while shore D scale is used for thermoplastic.
4.3 Testing machine
To compare and evaluate the three different pieces of insoles an abrasion resistance machine constructed as a project according to the standard ASTM G133 at Jönköping School of Engineering was used. Together with this test,
9 the ASTM G133 standard was used as a
guideline. The test involves a pin that is rubbed back and forth in a straight line against the surface of the insole.
4.4 Outcome measures
To analyze the data from the test a scale, model Denver Instrument S- 114 with a capacity of measuring 110 g was used. The scale had readability and a standard deviation of 0.0001 g (Denver Instrument, n.d). With the help of the scale, it was possible to see how much material had been worn off for each session. The collected data was analyzed. These outcome measures were chosen as a compromise to the economic and timely limitations of the study. As the machines used were owned by the university no external cost was required for using them.
4.5 Test standard
The ASTM G133 standard together with pilot tests was used to determine the settings for the machine. This test is done by placing the test piece underneath the pin that will slide back and forth over the surface in a linear direction. The load is applied vertically downward through the attached pin against the horizontally mounted test piece of the insole. Friction occurs and abrades the material. The normal load, stroke length, frequency, duration and environment are selected before the process started. A cycle is defined as two strokes namely fourth and back (ASTM International, 2016).
4.6 Pilot tests
Pilot tests were executed in order to conclude whether the method of weighing the samples was a viable outcome measure, if this testing standard was applicable and if the settings were correctly made. Each sample was measured three times before and after the test, a mean value was then included. When the tests were done the samples were placed in a container and transported from the laboratory to the weighing room to reduce the risk of harming or contaminating the samples.
4.6.1 First test
To decide what load needed to be applied to the test piece, a calculation of plantar pressure distribution was made. Knowing the pressure level beneath the forefoot during the gait and the diameter of the pin attached to the test machine, the machine load could be calculated. The diameter of the pin was set to 8.5 mm. The area of a half sphere is:
A = 4πr2 / 2
A = 4 × π × 4.252 / 2 = 1.135 cm2.
The forefoot was divided into five different regions: the medial/MTP1, the central/MTP2, the lateral MTPs, the hallux and the lesser toes. According to the article the forefoot pressure underneath these areas was estimated to be the following values in percentage of total weight (TW) per cm2 (Castro et al., 2012):
Lateral MTPs = 5 % TW/cm2.
Central/MTP2 = 5.1 % TW/cm2.
Medial/MTP1 = 4.2 % TW/cm2.
Lesser toes = 2.4 % TW/cm2.
Hallux = 4.6 % TW/cm2.
Following formula was used to calculate the forefoot mean pressure which resulted in 4.26 % TW/cm2.
X̅ = (X1 + … + Xn) / n
According to a report from Statistiska Centrabyrån, the mean weight of a Swedish 35-44 year old person was 77.2 kilogram (Statistiska centralbyrån, 2018).
m = 77.2 × 9.81 = 757.332 N To calculate the machine load needed:
F = P × A = (0.0426 × 757.332) × 1.135 = 36.617759532 N
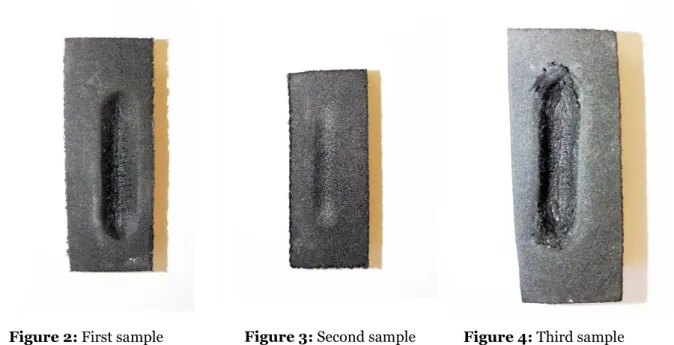
Six samples (approximately 20×50×10 mm) were cut out from a slab of unheated flat EVA. The same abrasion testing machine as described below was used. The samples that were tested were weighed before and after the test using a scale. After the test, the samples were blown dust free using compressed air
10 before weighing. As the outcome measure had
been confirmed and deformation of the sample had been identified in previous tests, the effect of test time on polymer behavior was of interest. Therefore, the third sample was not weighted before testing due to a difference in weight was not sought after. Samples were also photo documented (see appendix 10.3).
4.6.1.1 First sample
The first sample was tested at 2 Hz, with a load of 3.4 kg and a stroke length of 25 mm at 60 min.
4.6.1.2 Second sample
The second sample was tested at 2 Hz, with a load of 1.7 kg and a stroke length of 25 mm at 90 min.
4.6.1.3 Third sample
The third sample was tested at 2 Hz, with a load of 3.4 kg and a stroke length of 25 mm at 90 min.
4.6.2 Second test
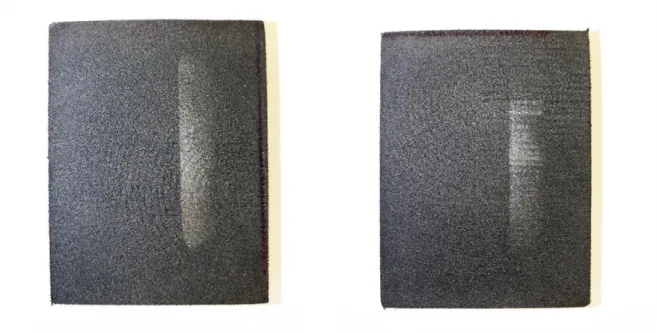
Due to the limited setting of the machine the ideal pin could not be used (see section 6.6). A compromise to this was to use a pin of the same dimension as before (see section 4.6.1) but changing the interfacing area from hemispherical to flat circular with rounded edges. The minimum load that could be applied for the machine was measured by a load cell to 2.9 N. Since the load was lower than before (see section 4.6.1) the material would not deform as much. For this reason, a flat circular surface would result in a bigger interfacing area compared to a hemispherical pin head.
The roughness of the pin was approximately 23.67 µm. As this was right between the two grit sizes a grit size of 240 was used to roughen the pin in a linear fashion to assimilate the plain weave type of a sock.
Before each test was performed, the pin was roughened with the sandpaper mentioned before (see section 2.9.2). Samples were also photo documented (see appendix 10.4).
4.6.2.1 First sample
For the first sample of the second test a load of 2.9 N, a testing time of 1h, a stroke length of 35 mm and a frequency of 2 Hz was set.
4.6.2.2 Second sample
For the second sample of the second test a load of 2.9 N, a testing time of 2h, a stroke length of 35 mm and a frequency of 2 Hz was set.
4.7 Main test
After the pilot tests were completed the settings were established. Samples were produced with the dimensions (62.4 × 47.8 × 10 mm). Two test samples were constructed of each manufacturing type (VF, SM and AM). To get the right thickness of the SM samples, polypropylene (PP) was used as a base plate. All the samples were blown dust free and weighted before and after the test. The samples were weighted three times and their mean was included. The difference in weight before and after the test and also the proportion were calculated with the following formulas:
Δweight = X̅weight-after - X̅weight-before
Δproportion = (Δweight / X̅weight-before ) × 100
For the machine settings, a load of 2.9 N was applied, a stroke length of 35 mm, a frequency of 2 Hz and with an attached pin of 8.5 mm in diameter with a roughness of approximately 23.67 µm (roughened manually with sandpaper with a grit size of 240). Time was set to first one hour and then two hours for respective sample in specific manufacturing group. Samples were also photo documented (see appendix 10.5 – 10.7).
4.8 Ethical considerations
Ethical issues regarding the study may be that the participant feeling discomfort during casting whether plaster or a foam box is used but the procedure will not expose the participant to any physically or mentally harmful risks. The patient shall not feel obliged to take part in the study. Regardless if the patient will take part of the study or not, their healthcare should not be affected. From a social and global perspective, there is a chance that
11 -0,2 -0,18 -0,16 -0,14 -0,12-0,1 -0,08 -0,06 -0,04 -0,020 0,02 0,04 1 2 3
Δ
proportion[% / TW] per hour
Serie1 Serie2 Serie3
Table 1: Results from the abrasion resistance test.
X̅weight-before – Mean sample weight before test.
X̅weight-after – Mean sample weight after test.
Δweight – Mean sample difference in weight before and after test.
Δproportion – Mean sample difference in percentage for the total weight per hour.
µ̅ – Mean measured coefficient of friction during the tests.
Figure 1: Graph representing the mean sample wear loss in percentage for the total weight per hour.
AM could streamline the production of insoles within the O&P business. (see Appendix 10.2).
5. Results
Test X̅weight-before (g) X̅weight-after (g) Δweight (g) Δproportion (% / TW) µ̅
Pilot test 1, sample 1 2.7903 2.7718 - 0.0185 - 0.6630 n.a
Pilot test 1, sample 2 3.1274 3.1276 + 0.0002 + 0.0064 n.a
Pilot test 1, sample 3 n.a n.a n.a n.a n.a
Pilot test 2, sample 1 9.6149 9.6179 + 0.0030 + 0.4879 n.a
Pilot test 2, sample 2 9.5569 9.5524 - 0.0045 - 0.0471 n.a
VF test, sample 1 8.5749 8.5750 + 0.0001 + 0.0012 0.9298
VF test, sample 2 8.6517 8.6527 + 0.0010 + 0.0116 1.6982
SM test, sample 1 18.4011 18.3659 - 0.0352 - 0.1913 1.0446
SM test, sample 2 17.2117 17.1946 - 0.0171 - 0.0994 n.a
AM test, sample 1 20.0114 20.0122 + 0.0008 + 0.0040 1.2588
12
6. Discussion
6.1 Main result
The population inclusion criteria for this study is described in section 4.1 and appendix 10.2. The reasoning behind this inclusion was in order to be able to generalize the results to a larger population. Because vascular diseases and other illnesses can affect the human body in a variety of different ways it could affect the results to include this group of candidates.
For the main findings, a possible explanation for the weight increase could be derived from metal particles generated when abrading the pin contaminating the samples and thereby invalidating the results. This was regarded by cleaning the pin with a wet piece of cotton before applying it to the machine. For further studies, the machine should be cleaned with acetone or other cleaning agents and a pin that cannot contaminate the sample should be used to gain more relevant results.
It is reasonable to assume that material would be worn off when abrading the surface of the samples. This contradicts the results of the main test. As some of the samples gained weight between the weightings it is difficult to conclude which of the materials from the different manufacturing methods had the best abrasion resistance.
Another common explanation for differing results is measuring errors due to human or machine. In the case of the present study, this would not be the explanation as described in section 4.4 due to the standard deviation of the scale not exceeding the difference identified between the weightings.
It was noticed that the mean weight of the AM sample was a lot higher than those of the VF samples (SM is not applicable for comparison as they were modified with a PP base). When calculating the mean density of the AM sample (see appendix 10.11) it was also noticed that AM had a higher mean density than the VF samples as follows:
ρAM = 1.1305 g/cm3
ρVF = 0.31 g/cm3 (appendix 10.1)
If an insole was created according to the principles described herein the weight of it might be a problem for users with muscle imbalances. Thereby further studies about other materials or internal, weight saving structures should be conducted.
6.2 Structural optimization
In the O&P business two of the three categories mentioned in section 2.7 about structural optimization are frequently worked with. Size and shape of orthotics are fitted to match the goals of the orthotist and to the patient. The third category, topology optimization is not currently worked with due to nowadays manufacturing methods. This could be solved by AM and a well-developed Application Programming Interface (API) for the O&P business.
For EVA, internal structures are not necessarily due to the low weight of the material and the high shock absorbing properties. AM can produce insoles with similar properties but at a very high cost of the machine and material. Using this type of machine with these types of materials would result in very expensive insoles, something that is not viable for the O&P business or the healthcare system. SM and VF are unable to adjust internal structure, a property AM possesses. The optimal settings of the internal structure can be decided using topology optimization if the correct parameters are included and determined. Such parameters could for example be the patterns mentioned by Davia-Aracil et al. (2018) and others. The linear rectangular pattern was chosen out of a few different ones. Which one of these gives the best shock absorbing property is unknown and there was no motivation behind the choice. As it is unknown, this area still needs further studies for how different patterns relate to properties such as shock absorption, mass and fatigue resistance to constant load pounding.
Materials for AM is a large market where multiple manufacturers produce a lot of different filaments in various properties. This results in a lot of options for potential insole materials which all would need to be tested for quality in respect to for example abrasion and
13 fatigue resistance in further studies. Another
topic not tested for in this study is shore. The shore is related to the internal structure as was mentioned in section 2.6. However, it is unknown exactly how the internal structure affects the shore. This could be tested using a shore durometer or using simulation based on topology optimization as mentioned before.
From instructions of Davia-Aracil et al. (2018) a pattern of rectangular cuboids was created inside the samples, this would theoretically increase the shock absorption. This internal structure was chosen due to there not being enough empirical data describing the optimal internal structure and due to the limitations of manufacturing.
There are infinite amounts of possible internal structures that can be used (see section 2.6). To decide the internal structure of a closed cell design the desired shock absorption, mass, impact strength, cell pattern and the limitations of the printer must be known. When the optimal settings are found, and the optimal internal structure created it can be used as a cheaper complement to the otherwise highly expensive MMAM technique (see section 2.5) for providing different properties for the same insole.
To make a reality of using AM in the O&P business a user-friendly API needs to be developed. When developing the API, it should be combined with topology optimization that was discussed earlier in this section. When using AM there are plenty of variables such as printing speed, heat and material softness that can affect the results. These need to be correctly established in order to get a good result.
6.3 Pilot test
The first pilot test was based on inaccurate calculations due to a misinterpretation of the stress/strain formula mentioned in section 2.9.3. This led to faulty settings of the machine which resulted in plasticity in combination with abrasion. Thereby an independent uncontrolled variable affected the results and invalidated them. Through this, the method for pilot test two was adjusted.
From the second pilot test, the main test settings were established. The optimal pin as described in Appendix 10.10 could not be used due to the spatial limitations of the testing machine. Using a smaller, flat pin head with according to the literature described in section 2.9.2 a correctly abraded surface did not deform the samples visually which lead to the main test being proceeded.
6.4 Samples
The samples were manufactured by the authors themselves through recommended dimensions from supervisors and in relation to the testing machine. The dimensions for the main test was set in order to stabilize the sample underneath the pin and thereby eliminate movement. As the samples were handmade there may have been slight variations in dimensions but as they were strapped tightly into the testing machine this was not seen as a problem.
The samples of AM were designed following instructions from Davia-Aracil et al. (2018). This article did not give sufficient detail to construct an identical pattern. This led to the samples being designed by a compromise. The effect of the compromise on the results should be minuscule.
It is important to note that different manufacturers use different blends of vinyl acetate in their EVA. As mentioned in section 2.8 different levels of vinyl acetate gives variations in flexibility for the EVA. It is not known how the proportion of vinyl acetate in EVA relates to the abrasion resistance and this requires further research.
The samples of SM were lower in height than the samples made by AM and VF. To eliminate this potential problem a stable base of PP was glued using Renia Ortec beneath the SM sample. If the contact cement or the PP would have affected the test and the materials are not known.
6.5 Machine
The machine used for this test was a sliding wear testing machine as described in section 4.3. According to literature, there are several different testing standards and machines that
14 could have been used. However, many of these
are used to test the material properties of the mid- and outsole of a shoe and are not applicable when trying to replicate the in-shoe environment and wearing. For this they use unidirectional rotary drum abrasion testers contrary to the pin used in this study.
As mentioned before in this section another way of testing the general abrasion resistance properties of different materials would be to use unidirectional rotary drum abrasion tester. The method used in this study introduces certain biases as for example the abrasion of the pin. The study performed was an attempt to simulate the environment of the sock-insole interface. This other described concept would be generalizable for the material properties as unidirectional rotary drum tester is commonly used for simulating the outsole-ground interface. It is not known how well this method could be applied for the insole area but it is another way to test for wear loss. This should be considered for further studies in order to only include abrasion resistance and make more correct conclusions.
A third way of testing the abrasion resistance of differently manufactured insoles would be to include test subjects.
6.6 The pin
In this study, the main cause of abrasion was the pin. The optimal pin could not be used for the main test due to spatial limitations of the testing machine. Using data from the main test, the stress induced into the EVA could be calculated (see appendix 10.9). Compared to reference data for the maximum load before reaching the highest stress for linear elasticity of EVA one can assume that some degree of plasticity of the material occurred during the test. It is difficult to identify exactly which level of deformation that occurred due to the shape of the stress/strain-curve (Verdejo, 2003). This results in the creation of an independent uncontrolled variable and a limitation of the study. A potential hypothesis is that the deformation occurred at the level of the material cells due to fatigue as mentioned in section 2.9.5. This can further be motivated as the deformations were not visible to the human eye (see appendix 10.5-10.7).
As was mentioned in this section, the material was exposed to a high load which may have resulted in plasticity. This was regarded but due to the spatial limitations of the machine, the optimal pin could not be used. In appendix 10.9 the interval (37.4241 mm ≤ d ≤ 38.4312 mm) for the diameter of the pin which was needed not to induce plasticizing loads into the EVA and introducing an independent uncontrolled variable to the study.
As mentioned in section 2.9.2 the desired roughness was 23.67 µm. This would roughly translate into sandpaper for roughening the pin of a grit size between 180 and 320.
Limitations derived from this could be that the proper roughness was not achieved when choosing the sandpaper. Another could be that the roughness of a sock was wrongly estimated. A third could be that as the pin was roughened by hand and there could have been a slight variation among the trials.
The two first limitations described could have caused a false wear value that did not equate to the accurate wear of a sock. This would make the results difficult to apply on patients, but the material abrasion resistance properties could still be evaluated.
The third limitation could cause a slight variation in the results which could invalidate the data. As the samples had not been tested during the same circumstances, they could not be analyzed thereafter either and conclusions would be difficult to reach. Altogether the differences in the roughness of the pin would probably not cause a tremendous flaw in the results as variations in were ocularly compared before the start of the test and the same person performed the abrasion, but it is still worth mentioning.
6.7 Method
There was an attempt to find literature for other dry sliding wear tests to validate the method. As the number of studies of this topic was relatively low and those that were found were not suitable for comparison (due to for example load or procedure differences) no validation of the method could be made. Therefore, this study could be seen as a pilot test for validating a
15 method of testing abrasion resistance for
insoles.
It’s is difficult to biofidelically simulate the shoe-sock interface and the conditions therein without test candidates. Therefore one must translate these results with caution onto the population. On the contrary, using test candidates introduces other limitations such as compliance, activity level, structural deformity and gait deviations or other external factors like gravel in the shoe. The consequence of this is that it is difficult to pick the most applicable method that best assimilates the desired environment.
6.8 Outcome measurement
There is a multitude off different ways to measure the wear of materials. The one chosen for this study was mass loss by weight as mentioned in section 4.4. The reason why the mass was analyzed as the outcome and not the volume or surface condition was because of the deformation that could occur during the test.
An additional reason was the financial and timely limitations of the study not allowing for more advanced forms of other outcome measurements. Another outcome measure could have been the height of the removed material (ASTM G133). This was considered and would have been performed using a digital Vernier scale. As the abrasion was very small (see Appendix 10.5-10.7) and the surface area might not be equal in depth it was deemed a to inaccurate outcome measure in comparison to the four-decimal scale.
It is possible to measure the outcome by using a scanning electronic microscope (Thavamani & Khastgir, 1997). This allows for analysis of the abraded surfaces and the formation of ridges on a microscopic level. The topology of the ridges and the worn area would add another level of evidence that would not be as vulnerable to measuring errors as using a four-decimal scale.
The optimal outcome measure would probably be a combination of four-decimal scale and scanning electronic microscope if a correct pin is used and no plasticity can occur.
As not enough data had been collected for either the wear loss or for the coefficient of friction, descriptive or inferential statistical analysis would not yield a more generalizable result for the population. According to literature, more samples should be used to better draw further statistical conclusions as the study was unable to do so (Razali & Yap, 2011). A power analysis should be conducted in order to determine the optimal amount of samples (Cohen, 1988).
6.9 Manufacturing of insoles
Things to consider might be how to accomplish a good representation of the subject’s feet. The inter and intra reproducibility was not acceptable for any of the manufacturing techniques used in the study according to the literature mentioned in section 2.3. This would indicate that the representation created would not be similar each time. For a subject related material study, this would be a highly affecting variable but as the samples in this study were taken from the forefoot this would not affect the results in a great fashion. It is noteworthy as mentioned in section 2.4 that scanning and effective use of CAD/CAM is cost advantageous.
A possible limitation for a subject related material study is the fact that the cast used for creating insoles might not accurately represent the foot of the subject. This might limit the use of the results presented in this thesis when implementing AM to the O&P business and might already be affecting it. As presented in section 2.3 the subject’s feet are used for creating a positive representation from which the insole is made. A limitation of this technique is that the cast is taken in a static, often sitting position.
As described by Bojsen-Møller, Dyhr-Poulsen, Fleckenstein, Simonsen and Tranum-Jensen (2000) the foot is made up of smaller bones called tarsal bones. These have the ability to slide relative to each other and deform the foot according to the irregularities of the ground beneath (Bojsen-Møller et al., 2000). Multiple scanning systems are available but the systems cannot themselves vogue for how well the practitioner handles them (Telfer et al., 2012). This results in multiple risk factors, one that could affect the quality of the cast taken. If this is avoided the cast may not reflect the shape of
16 the foot when standing or walking as the tarsal
joints may move in relation to each other and the ground.
The aim of this study was to evaluate if additively manufactured insoles were an appropriate manufacturing method for insoles in regard to material properties like abrasion resistance. To be able to make this evaluation fairly one has to ensure that the insoles tested actually fit the feet testing them in order to exclude or control other affecting variables. An example to explain this more clearly follows: if a patient has a plantar bone that is prominent during dynamic walking but not in static conditions this would affect the fit of the insole. The patient could feel discomfort and would likely rate the insoles lower on a visual analogue scale outcome measure which could affect the evaluation of the insoles.
If outcome measures like the one in this study or electronic microscopy of the worn surface were used, it is a reasonable hypothesis that the insole would be more worn at the area of the bone prominence if it is not corrected for. The solution to this problem would be to take cast in a way that ensures fit in the way the insole is meant to be used. To clarify in relation to the previously used example, a cast taken in a dynamic position would be more appropriate both to ensure comfort but also to be able to fairly evaluate the insole properties during the study. The problem arising from this is that traditional casting methods are not meant to be used dynamically. To develop and validate a casting method for dynamic purpose would benefit studies like this one and the O&P business as a whole.
6.10 Ethical consideration
This study involves some ethical issues. Firstly Skaraborgs Ortopedservice in Skövde has the full responsibility for choosing the candidate and the authors cannot control how well they proceed with this task. Another problem is that sensitive personal information gets passed around to different actors and it is not controllable how these handles this information. Skaraborgs Ortopedservice in Skövde is an organization that treats patients and has legal obligations in accordance with “Offentlighets- och sekretesslagen” and GDPR
(European Parliament. Council of the European Union, 2016; SFS 2009:400). The candidate was informed about the study and a consent form was gathered and signed before the start of the study (see appendix 10.2).
It was hypothesized that the candidate may feel mild discomfort during the casting procedure. From experience, this could occur but due to the fact that it was an external actor who met the participant, the authors were not able to control for this potential problem. This was handled by Skaraborgs Ortopedservice in Skövde as they are professionals in this area and are familiar with the process of handling patients.
A more far-fetched ethical problem that was identified is the social and global perspective. There is a chance that AM will streamline the production of insoles within the O&P business. This is advantageous for patients from a rehabilitation perspective. Seen from a work perspective, the number of jobs, for example orthopedic technicians in the future may be decreased when orthopedic technology is industrialized. This could create an ethical problem. Industrialization and technical development are inevitable and need to be considered. Therefore, the patient’s interests should primarily be regarded before the thought of how the workers will be affected. By finding out if the technology is favorable or not, it can be determined if it should be applied. The workers' conditions can then be modified and adapted based on the technology so that their situation remains unaffected.
6.11 Friction
In section 2.8 the material properties of EVA were described. It was mentioned that the material has relatively low heat resistance. Since as mentioned in section 2.9.2 friction generates heat it may affect the material properties of the EVA. This is a limitation of the study. The problem occurring when trying to control for it is that one may affect the abrasion results as the dry sliding test use the abraded material as a cause for friction. Applying water or cold air to chill the sample would result in the removal of the particles and thereby affecting the abrasion results. Another problem arising from this would be that as mentioned in section 2.9.2 the coefficient of friction varies with the
17 wetness of the surface. To control for this water
would need to be applied in a controlled fashion to keep the coefficient of friction constant in order to not affect the results.
Another problem arising from the application of water would be if the water is absorbed to the EVA. If the water is absorbed the samples would get heavier and thereby invalidate the outcome measure of weighing. The weight of absorbed water would need to be controlled and calculated to accurately be subtracted from the second weighing or another outcome measure should be regarded. This leads to the heat generated from the friction is difficult to control without affecting the results or causing secondary problems.
The coefficient of friction µs was measured for
the different samples. As friction is related to abrasion resistance and depends on the µs of the
material, the wear loss is related to µs. Therefore
µs could give valuable information about which
material that should have the highest wear loss. To what degree these variables are related is unknown.
6.12 Further research
From the start, this project was intended to test insoles for fatigue resistance to constant load pounding as this was hypothesized to be one of the main causes of insole failure. As a machine appropriate for testing this was difficult to come by and due to the timely and economic limitations of the study this was not able to be conducted. Still, not enough research has been done on the area of material fatigue for insoles. Due to the limited time, this study has limited numbers of samples and limited sample size. Another limitation was the pin, the pin used through this test was a compensation due to the spatial parameters for the machine. To avoid deformation of the material one should use the dimensions for the optimal pin as mentioned in section 6.6 and Appendix 10.10. This needs to be considered for further studies in the same area. The O&P business could gain a lot from this knowledge and it should be a topic for further studies.
7. Conclusion
This study could be seen as a pilot test to contribute to the implementation of AM into O&P health care. Based on the results and the discussion one can conclude that this method for testing the abrasion resistance of materials for insoles manufactured in different ways has some flaws. If these were to be corrected for appropriately, as described above it would have the potential to give relevant results that could be applied to the O&P business. AM is an applicable manufacturing method though further research about properties for usable materials and structural optimization needs to be accomplished before implementation into practice.
8. Acknowledgements
We thank our collaborators for their contributions and inputted time.Christina Zong-Hao Ma, supervisor at Jönköping, School of Health and Welfare.
Sara Kallin, supervisor at Jönköping, School of Health and Welfare.
Rohollah Ghasemi, supervisor at Jönköping, School of Engineering.
Esbjörn Ollas, technician at Jönköping, School of Engineering.