Deliverable D3.6
Monitoring and Analytics (Release B)
Editor
Ö. Alay, G. Caso (SRL)
Contributors
SRL ( Simula Metropolitan Center For Digital Engineering),
KAU (Karlstads Universitet), NCSRD ( National Center For
Scientific Research “DEMOKRITOS”), LMI (L.M. Ericsson
Limited), FON (FON Technology SL), ATOS (Atos Spain SA),
UMA (Universidad De Malaga), HU (Humboldt
University), INF (INFOLYSiS P.C.), FhG ( Fraunhofer
Gesellschaft Zur Foerderung Der Angewandten
Forschung E.V.), SHC (Space Hellas (Cyprus) Ltd), INT
(Intel)
Version 1.0
Date April 05 2021
Distribution PUBLIC (PU)
List of Authors
SRL SIMULA METROPOLITAN CENTER FOR DIGITAL ENGINEERING Ö. Alay, G. Caso
KAU KARLSTADS UNIVERSITET
A. Brunstrom, A. Rabitsch, M. Rajiullah, K.-J. Grinnemo, J. Karlsson
NCSRD NATIONAL CENTER FOR SCIENTIFIC RESEARCH “DEMOKRITOS” T. Anagnostopolous, G. Xilouris, H. Koumaras
LMI L.M. ERICSSON LIMITED E. Aumayr, A-M Bosneag, J. McNamara FON FON TECHNOLOGY SL I. Pretel, I. Etxebarria
ATOS ATOS SPAIN SA E. Jimeno
UMA UNIVERSIDAD DE MALAGA A. Diaz-Zayas, B. Garcia
HU HUMBOLDT UNIVERSITY L. Reichert
INF INFOLYSIS P.C.
C. Sakkas, A. Papaioannou, V. Koumaras
FhG FRAUNHOFER GESELLSCHAFT ZUR FOERDERUNG DER ANGEWANDTEN FORSCHUNG E.V. S. K. Rajaguru, A. Prakash, F. Eichhorn, M. Emmelmann, O. Keil
SHC SPACE HELLAS (CYPRUS) LTD D. Lioprasitis, G. Gardikis
INT INTEL V. Frascolla
Disclaimer
The information, documentation and figures available in this deliverable are written by the 5GENESIS Consortium partners under EC co-financing (project H2020-ICT-815178) and do not necessarily reflect the view of the European Commission.
The information in this document is provided “as is”, and no guarantee or warranty is given that the information is fit for any particular purpose. The reader uses the information at his/her sole risk and liability.
Copyright
Copyright © 2021 the 5GENESIS Consortium. All rights reserved. The 5GENESIS Consortium consists of:
NATIONAL CENTER FOR SCIENTIFIC RESEARCH “DEMOKRITOS” Greece
AIRBUS DS SLC France
ATHONET SRL Italy
ATOS SPAIN SA Spain
AVANTI HYLAS 2 CYPRUS LIMITED Cyprus
AYUNTAMIENTO DE MALAGA Spain
COSMOTE KINITES TILEPIKOINONIES AE Greece
EURECOM France
FOGUS INNOVATIONS & SERVICES P.C. Greece
FON TECHNOLOGY SL Spain
FRAUNHOFER GESELLSCHAFT ZUR FOERDERUNG DER ANGEWANDTEN FORSCHUNG
E.V. Germany
IHP GMBH – INNOVATIONS FOR HIGH PERFORMANCE
MICROELECTRONICS/LEIBNIZ-INSTITUT FUER INNOVATIVE MIKROELEKTRONIK Germany
INFOLYSIS P.C. Greece
INSTITUTO DE TELECOMUNICACOES Portugal
INTEL DEUTSCHLAND GMBH Germany
KARLSTADS UNIVERSITET Sweden
L.M. ERICSSON LIMITED Ireland
MARAN (UK) LIMITED UK
MUNICIPALITY OF EGALEO Greece
NEMERGENT SOLUTIONS S.L. Spain
ONEACCESS France
PRIMETEL PLC Cyprus
RUNEL NGMT LTD Israel
SIMULA RESEARCH LABORATORY AS Norway
SPACE HELLAS (CYPRUS) LTD Cyprus
TELEFONICA INVESTIGACION Y DESARROLLO SA Spain
UNIVERSIDAD DE MALAGA Spain
UNIVERSITAT POLITECNICA DE VALENCIA Spain
UNIVERSITY OF SURREY UK
This document may not be copied, reproduced or modified in whole or in part for any purpose without written permission from the 5GENESIS Consortium. In addition to such written permission to copy, reproduce or modify this document in whole or part, an acknowledgement of the authors of the document and all applicable portions of the copyright notice must be clearly referenced.
Version History
Rev. N Description Author Date
L
IST OF
A
CRONYMS
Acronym Meaning(R)MSE (ROOT) MEAN SQUARE ERROR AI ARTIFICIAL INTELLIGENCE
AP ACCESS POINT
API APPLICATION PROGRAMMING INTERFACE
BE BACKWARD ELIMINATION
BLER BLOCK ERROR RATE
CA CONSORTIUM AGREEMENT
CIB CHARACTERISTICSC INFORMATION BASE CPE CUSTOMER PREMISES EQUIPMENT CPU CENTRAL PROCESSING UNIT CQI CHANNEL QUALITY INDICATOR
DC DATA CENTER
e/gNB EVOLVED / NEXT-GENERATION NODE B
E2E END-TO-END
ELCM EXPERIMENTAL LIFE CYCLE MANAGER FTP FILE TRANSFER PROTOCOL
GA GRANT AGREEMENT
GUI GRAPHICAL USER INTERFACE HCI HYBRID CLOUD INFRASTRUCTURE
HTTP(S) HYPERTEXT TRANSFER PROTOCOL (SECURE) IM INFRASTRUCTURE MONITORING
IoT INTERNET OF THINGS
IP INTERNET PROTOCOL
JSON JAVASCRIPT OBJECT NOTATION KPI KEY PERFORMANCE INDICATOR LSTM LONG SHORT-TERM MEMORY M&A MONITORING AND ANALYTICS MAC MEDIUM ACCESS CONTROL MAD MEDIAN ABSOLUTE DEVIATION MAE MEAN ABSOLUTE ERROR
MBB MOBILE BROAD BAND
MCS MODULATION AND CODING SCHEME
ML MACHINE LEARNING
MONROE VN MONROE VIRTUAL NODE
NFV(O) NETWORK FUNCTION VIRTUALIZATION (ORCHESTRATOR) NSI NETWORK SLICE INSTANCE
O5GC OPEN5GCORE
OLS ORDINARY LEAST SQUARE
OSM OPEN SOURCE MANO
PDCP PACKET DATA CONVERGENCE PROTOCOL PDSCH PHYSICAL DOWNLINK SHARED CHANNEL PIB POLICY INFORMATION BASE
PM PERFORMANCE MONITORING
QoS / QoE QUALITY OF SERVICE / EXPERIENCE RAM RANDOM ACCESS MEMORY RAN RADIO ACCESS NETWORK ReLu RECTIFIED LINEAR UNIT
REST REPRESENTATIONAL STATE TRANSFER RFE RECURSIVE FEATURE ELIMINATION RLC RADIO LINK CONTROL
RSRP / RSRQ REFERENCE SIGNAL RECEIVED POWER / QUALITY
S-NSSAI SINGLE-NETWORK SLICE SELECTION ASSISTANCE INFORMATION SDN SOFTWARE DEFINED NETWORK
SGD STOCHASTIC GRADIENT DESCENT SLA SERVICE LEVEL AGREEMENT
SNMP SIMPLE NETWORK MANAGEMENT PROTOCOL SNR SIGNAL TO NOISE RATIO
SVM SUPPORT VECTOR MACHINE TAP TEST AUTOMATION PLATFORM
UE USER EQUIPMENT
VIM VIRTUAL INFRASTRUCTURE MANAGER
VM VIRTUAL MACHINE
VNF VIRTUAL NETWORK FUNCTION
WIM WAN INFRASTRUCTURE MANAGER Xvfb X VIRTUAL FRAME-BUFFER
Executive Summary
This document describes the design and implementation of the 5GENESIS Monitoring & Analytics (M&A) framework in its Release B, developed within Task T3.3 of the project work plan. M&A Release B leverages and extends M&A Release A, which has been documented in the previous Deliverable D3.5 [1]. In particular, we present new features and enhancements introduced in this new Release compared to the Release A. We also report some examples of usage of the M&A framework, in order to showcase its integrated in the 5GENESIS Reference Architecture.
The instantiation of a M&A framework is crucial for 5G. In particular, this is due to the fact that the services provided by 5G systems have to comply with Service Level Agreements (SLAs), which state the end-to-end (E2E) performance that have to be guaranteed to end-users and verticals, leading to the need for careful management and monitoring of the instantiated resources. Therefore, a 5G M&A framework should consider both end-users’ and operators’ perspectives, aiming at satisfying and improving user’s Quality of Service and Experience (QoS/QoE) and operator’s management and operational costs [2][3].
The 5GENESIS M&A framework includes advanced Monitoring tools and both statistical and Machine Learning (ML)-based Analytics, and it is devoted to the collection and analysis of the heterogeneous data produced during the usage of the 5GENESIS Facility. Its main goal, within the project scope, is to verify the status of the infrastructure components during the execution of experiments for the validation of 5G Key Performance Indicators (KPIs), including the ones related to vertical use cases.
Following the design choices of Release A, the 5GENESIS M&A Release B is also designed and implemented in three main interoperable functional blocks:
• Infrastructure Monitoring (IM), which focuses on the collection of data that synthesize the status of architectural components, e.g., end-user devices, radio access and networking systems, core network, and cloud and edge units;
• Performance Monitoring (PM), which enables the active measure of E2E QoS/QoE KPIs; • Storage and Analytics, which enables the management of large sets of heterogeneous data, and drives the discovery of hidden values, correlation, and causality among them. The parallel use of IM/PM tools and Analytics functionalities enables a reliable assessment of KPIs, while also pinpointing possible issues that lead to performance losses, and ultimately triggering the use of improved policies and configurations in next experiment executions. Both the design and implementation of the M&A framework have been carried out by considering the 5GENESIS Reference Architecture [4][5], as well as commonalities and peculiarities of the 5GENESIS platforms.
Table of Contents
LIST OF ACRONYMS ... 6
1.INTRODUCTION ... 13
Purpose of the Document ... 13
Document Dependencies ... 13
Structure of the document ... 13
Target audience ... 14
2.RELEASE ASUMMARY AND RELEASE BINTRODUCTION ... 15
The 5GENESIS M&A Framework ... 15
From Release A to Release B ... 17
3.MONITORING ... 20
Prometheus for Infrastructure Monitoring ... 20
3.1.1. Main configuration and setup ... 20
3.1.2. Exporters for RAN and Core Network Monitoring ... 21
3.1.2.1. Amarisoft RAN Exporter ... 21
3.1.2.2. Open5GCore Exporter ... 22
3.1.3. Slice Monitoring ... 23
MONROE VN enhancements for Performance Monitoring ... 24
3.2.1. Browsertime5g ... 25
3.2.2. 360dash ... 26
Other Probes for Performance Monitoring ... 27
3.3.1. Remote Agents ... 27
3.3.2. PM Agents for Android devices ... 27
3.3.3. IxChariot ... 28
4.STORAGE AND ANALYTICS ... 29
InfluxDB... 29
Analytics ... 29
4.2.1. Visualization Service ... 30
4.2.2. Data Handler Service ... 34
4.2.2.1. Time Series Synchronization ... 34
4.2.2.2. Anomaly Detection ... 35
4.2.3. Statistical Analysis Service ... 35
4.2.5. Feature Selection Service ... 36
4.2.6. KPI Prediction Service ... 37
APIs for result retrieving ... 37
4.3.1. Analytics service APIs ... 38
4.3.1.1. Data Handler Service ... 38
4.3.1.2. Correlation Service ... 39
4.3.1.3. Prediction Service ... 40
4.3.1.4. Statistical Analysis Service ... 41
4.3.1.5. Feature Selection Service ... 44
5.M&AINTEGRATION WITH OTHER COMPONENTS ... 45
Integration with 5GENESIS Portal ... 45
Integration with 5GENESIS Slice Manager and Policy Engines ... 45
5.2.1. NEAT ... 45
5.2.2. APEX ... 47
Integration with 5GENESIS Security Analytics ... 47
5.3.1. Edge Cloud ... 48
5.3.1.1. Prometheus server, Node Exporter, Amarisoft Exporter ... 48
5.3.2. Core DC ... 48
5.3.2.1. InfluxDB ... 48
5.3.2.2. Grafana ... 49
5.3.2.3. Autoencoder ... 50
6.TESTING AND VALIDATION... 53
Testing and Validation of the Analytics Services ... 53
6.1.1. Time Series Overview ... 53
6.1.2. Outlier Removal ... 53 6.1.3. Statistical Analysis ... 54 6.1.4. Correlation ... 55 6.1.5. Feature Selection ... 55 6.1.6. KPI Prediction ... 56 7.CONCLUSION ... 58 REFERENCES ... 59
ANNEX 1–ADDITIONAL INFRASTRUCTURE MONITORING TOOLS ... 61
ANNEX 2–WIFI MANAGEMENT AND MONITORING ... 63
ANNEX 4–DATA ANONYMIZATION ... 76
1. I
NTRODUCTION
Purpose of the Document
In this document, we summarize the main activities carried out within Task T3.3 towards the design and implementation of the 5GENESIS Monitoring & Analytics (M&A) framework in its Release B. We aim at presenting new features and enhancements introduced in this new Release, compared to the Release A described in Deliverable D3.5 [1]. We further report some examples of usage of the framework, in order to showcase how it is integrated in the 5GENESIS Reference Architecture and used across the 5GENESIS platforms.
Document Dependencies
The table below summarizes the relevance of other 5GENESIS deliverables against the content of the present document.
id Document title Relevance
D3.5 [1] 5GENESIS Monitoring and Analytics (Release A)
The document describes M&A Release A.
D2.1 [4] Requirements of the Facility The document defines the requirements
related to the features supported by the 5GENESIS Facility. M&A main features are also discussed.
D2.4 [5] Final report on facility design and experimentation planning
The document defines the 5GENESIS Reference Architecture and lists its functional components. The integration of the M&A framework in the Reference Architecture is made explicit and discussed.
D6.1 [6] Trials and Experimentations (Cycle 1) The document reports the results of the 1st Experimentation Cycle. The procedure for the KPI statistical validation, implemented as part of the Analytics functionalities, is defined and described in detail.
Structure of the document
Section 2 provides a summary on M&A Release A and introduces M&A Release B on a high level. Sections 3 and 4 describe the advances of M&A Release B in terms of Infrastructure and
Performance Monitoring functionalities, respectively. Storage and Analytics components are described in Section 5, while Section 6 describes M&A integration with other components of the 5GENESIS Reference Architecture. Section 7 reports M&A testing and validation examples, as well as some use cases of the framework. Conclusions are drawn in Section 8, while further details on specific M&A components and functionalities are given in the Annexes.
Target audience
The document targets the 5GENESIS Consortium, in order to provide a common overview of the M&A Release B architecture, components, and functionalities.
The document is also turned to external users and experimenters of the 5GENESIS Facility, in order to give them an overview on how to use the M&A framework and which functionalities can be expected within the 5GENESIS Facility.
2. R
ELEASE
A
S
UMMARY AND
R
ELEASE
B
I
NTRODUCTION
The 5GENESIS M&A Framework
5GENESIS targets the realization of a full-chain M&A framework for a reliable validation of 5G KPIs [1]. The framework enables the analysis of experimental data collected by dedicated monitoring probes during the usage of the 5GENESIS Facility. This in turn allows to pinpoint the interdependencies between network configurations, scenarios and environmental conditions, and QoS and QoE KPIs, ultimately leading to the derivation of optimized management policies for further improvement of users’, verticals’, and operators’ performance.
The 5GENESIS M&A framework includes several Monitoring tools and both statistical and ML-based Analytics. It is formed by three main blocks:
• Infrastructure Monitoring (IM), which focuses on the collection of data on the status of
infrastructure components, e.g., User Equipment (UE), radio access and core networks, Software Defined Network / Network Function Virtualization (SDN/NFV) environments, and distributed edge units;
• Performance Monitoring (PM), which is devoted to the active measure of E2E QoS/QoE
KPIs. These include traditional indicators, such as throughput and latency, but also other indicators tailored on specific use cases and applications (e.g., mission critical services and massive communications);
• Storage and Analytics, which enables the efficient management of large amounts of
heterogeneous data, and drives the discovery of hidden values, correlation, and causality among them.
Among others, the 5GENESIS M&A framework aims at providing the following Analytics functionalities:
1) KPI Validation, i.e., the execution of the KPI statistical analysis defined in 5GENESIS for validating a KPI [6];
2) Time series management, which allows to coherently merge the data coming from different probes, in order to perform further analyses. In a M&A system, this task is needed for several reasons. First, different sampling rates might be used by different probes. For example, QoS/QoE KPIs might be collected at higher sampling rates as compared to infrastructure data. Second, the probes might be not perfectly synchronized. Hence, time synchronization can be applied when the time series collected from different probes present similar sampling rates, while interpolation better suits situations where the probes use different sampling rates;
3) Outlier detection, in order to eliminate data obtained under incorrect functioning of the probes, which may negatively affect the analyses;
4) Feature selection, which allows to simplify the analyses by eliminating some of the collected parameters. As a matter of fact, 5G networks include a huge number of components. Hence, using ML and Artificial Intelligence (AI) approaches for network management and optimization could be challenged by the large amount of data that
can be potentially collected; some of these data might be not useful and could negatively affect the analyses. Hence, feature selection algorithms can be used to remove redundant features, making the next analyses computationally simpler and faster. In general, feature selection allows to train ML algorithms faster, reduce model complexity and overfitting, and improve model accuracy;
5) Correlation analysis, which allows to highlight how system configurations and network conditions, collected via IM probes, are correlated and affect QoS/QoE KPIs, collected via PM tools. Revealing the correlation between IM and PM parameters allows to improve network management and derive better configuration policies for assuring SLAs. Lack of correlation between parameters which are known to have dependencies is also a key indicator for pinpointing system malfunctioning and can help trigger needed fixes;
6) KPI prediction, which allows to build a model and estimate QoS/QoE KPIs by looking at other parameters, collected under different circumstances and scenarios. Being able to accurately predict a KPI would enable better network planning and management. The M&A framework spans across all layers of the 5GENESIS Reference Architecture, from Infrastructure to Coordination, via Management and Orchestration (MANO). In particular, IM and PM probes mainly lie at the Infrastructure layer, in order to fulfill the requirement of tracking the status of components and functions, thus collecting large amounts of heterogeneous parameters. Then, a management instance of the Monitoring is placed at the MANO layer, so that the parameters scraped from the infrastructure components (i.e., physical and virtual hosts) are redirected to a centralized collector, e.g., a Prometheus1 server. The Coordination layer hosts the storage utilities and the Analytics functionalities. The Analytics results are shown in a dedicated visualization utility.
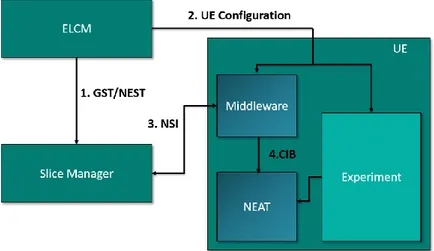
As anticipated above and depicted in Figure 1, the M&A framework comprises of IM, PM, Storage, and Analytics. The main connection point with the 5GENESIS Reference Architecture is the Experimental Life Cycle Manager (ELCM), developed in Task T3.8, whose main functionalities are the scheduling, composition, and supervision of experiments in the platforms, as detailed in Deliverable D3.15 [7].
In each 5GENESIS platform, the ELCM activates on-demand IM/PM probes via the Activation
Plugins, in order to start monitoring the components involved in a specific experiment, e.g., the
components of a network slice, while actively running the experiment. The ELCM also automatizes both formatting and long-term storage of the data collected during the experiment execution, via so-called Results Collectors. Within 5GENESIS, the Keysight Test Automation Platform (TAP) software2 deals with most of the ELCM operations. Therefore, the 5GENESIS Activation Plugins are TAP Plugins, while the Result Collectors are TAP Result
Listeners.
1 https://prometheus.io, Accessed on: March 2021.
Figure 1. 5GENESIS M&A Framework.
From Release A to Release B
This Section summarizes the main components developed and integrated in M&A Release A, and introduces the add-ons and upgrades included in M&A Release B. These latter will be described in detail in the following dedicated sections.
IM. With regards to the IM functionality, the 5GENESIS platforms use Prometheus as the main IM tool, adopting the configurations already described in [1] and also summarized in Section 3.1.1. Prometheus covers the monitoring of physical hosts, physical/virtual network functions, SDN/NFV instances, as well as RAN, Core network, and edge units.
In Release A, the Node Exporter has been used in order to collect low-layer metrics on the status of physical units involved in the experiments, e.g., in terms of memory load, Central Processing Unit (CPU) and disk utilization, and traffic sent/received on the available network interfaces, among others. In M&A Release B, dedicated Simple Network Management Protocol (SNMP)
Exporters have been also developed and flanked to the Node Exporter, in order to monitor the
status of vendor-specific components used in the 5GENESIS Facility, e.g., the Amarisoft RAN and Open5GCore3 (O5GC) components used in some of the platforms (see Section 3.1.2). Moreover, Prometheus is also used for enabling the so-called Slice Monitoring, as detailed in Section 3.1.3.
Considering the monitoring of UEs, specific tools are required for the collection of radio parameters experienced upon connection to the e/gNBs, such as, Reference Signal Received Power (RSRP), Reference Signal Received Quality (RSRQ), Signal to Noise Ratio (SNR), and Channel Quality Indicator (CQI). The same tools can be also used for collecting information on transmission settings, such as, the adopted Modulation and Coding Scheme (MCS). The monitoring of Android-based 4G and 5G UEs used in the 5GENESIS Facility is executed via a dedicated application, referred to as Android Resource Agent, which has been developed during the first Project cycle for 4G UEs (Release A), and being upgraded in the second Project cycle for 5G UEs (Release B).
PM. With regards to the PM probes, several platform-agnostic instruments have been designed and developed in both Release A and Release B. These are the MONROE Virtual Node (VN) and the so-called Remote Agents and Android Agents. In their Release A, these probes have been developed aiming at their use in experiments for the validation of latency and throughput KPIs, as also reported in Deliverables D6.1 [6] and D6.2 [8]. In M&A Release B, MONROE VN has been enhanced, improving its integration in the M&A framework but also upgrading its functionalities aiming at enabling the measurement of application-layer KPIs, e.g., web browsing and video streaming performance (Section 3.2). The Remote and Android Agents have maintained their primary functionalities but are configured more efficiently (Section 3.3). Storage and Analytics. For both M&A Release A and Release B, the 5GENESIS Consortium has agreed on the use of InfluxDB4 as the common tool for the creation of platform-specific instances of a long-term storage utility. InfluxDB is the open-source storage engine provided within the InfluxData framework, and handles in particular time series data (Section 4.1). With regards to the Analytics component, it went through a significant enhancement from Release A to Release B. In the first Release, the Analytics functionalities have been provided as interconnected Python scripts, covering all the analysis steps, i.e., a) data retrieval from an InfluxDB database (executed via the InfluxDB-Python client [9]), b) data preprocessing and management (e.g., time series synchronization and outlier detection/removal), and c) specific statistical and ML functions (e.g., KPI statistical validation and prediction).
In Release B, the Analytics component has been reconfigured to simplify both its integration in the 5GENESIS platforms and its usage by the experimenters. In particular, Analytics is now provided as a collection of micro-services developed as Docker5 containers. As detailed in Section 4.2, each container is dedicated to a specific functionality (e.g., data retrieval and management, KPI statistical validation, correlation analysis, and so on), and they can be used
3https://www.open5gcore.org, Accessed on: March 2021.
4 https://www.influxdata.com/products/influxdb-overview/, Accessed on: March 2021. 5https://www.docker.com/, Accessed on: March 2021.
standalone via Representational State Transfer (REST) Application Programming Interfaces (APIs) or by means of a visualization container that gives parallel access to all the other containers through a Graphical User Interface (GUI). One the one hand, the REST APIs have been developed via Flask6, so that the code running inside each container is a web application easily accessed from remote (e.g., via a web browser). On the other hand, the GUI is built by using the DASH7 visualization library. Finally, as for Release A, Pandas8, NumPy9, and SciKit-Learn10 libraries are used for data processing and ML functionalities. The source code of implemented Analytics algorithms is part of the Open5GENESIS Suite. 11
Besides the above developments, in this document we also provide a description of some of the most relevant integrations of M&A with other components of the 5GENESIS Reference Architecture, which target both platform-agnostic and platform-specific use cases. In particular, we document the activities towards:
• The access to Analytics via the 5GENESIS Portal, described in Section 5.1;
• The development of M&A solutions for automatic network configuration and optimization, i.e., prescriptive analytics methods. These developments aim at showcasing possible solutions for ML/AI-driven configuration and optimization of 5G systems. Under investigation in Athens and Surrey platforms, such solutions leverage the combination of M&A and Slice Manager [10] functionalities with so-called policy
engines, i.e., NEAT and APEX. More details are provided in Section 5.2;
• The integration of M&A with the Security Analytics framework, realized in the Limassol platform and enabling deep learning-based anomaly detection (Section 5.3);
• The instantiation of M&A components for the collection of network logs, and for management and monitoring of non-3GPP access components, such as WiFi Access Points (APs). These activities have been performed in Berlin and Surrey platforms. More details are provided in Annexes 1 and 2;
• The instantiation of M&A solutions for management and monitoring of Internet of Things (IoT) access components and devices. This activity is related to the Surrey platform, and aims at demonstrating 5G massive connectivity scenarios. More details are provided in Annex 3;
• The introduction of methodologies for data anonymization. Although the M&A framework aims at specifically supporting dedicated experimentation for KPIs measurement, analysis, and validation, its usage can be also envisioned in experiments involving real users, e.g., the showcasing of 5G functionalities during large-scale events. In this case, data anonymization may be needed in order to comply with European and national privacy regulations. Therefore, data anonymization techniques have been studied and tested, towards their adoption in 5GENESIS large-scale demonstrations, e.g., the Festival of Lights 2021 targeted by the Berlin platform. More details are provided in Annex 4.
6https://flask.palletsprojects.com/en/1.1.x/, Accessed on: March 2021. 7https://plotly.com/dash/, Accessed on: March 2021.
8https://pandas.pydata.org/, Accessed on: March 2021. 9https://numpy.org/, Accessed on: March 2021. 10https://scikit-learn.org/, Accessed on: March 2021. 11https://github.com/5genesis, Accessed on: March 2021.
3. M
ONITORING
Prometheus for Infrastructure Monitoring
3.1.1. Main configuration and setup
The main IM functionalities in the 5GENESIS platforms are based on Prometheus, and include four components: a) a main server, where both monitoring system and time series database are deployed; b) the alert manager, for creating and managing monitoring alarms; c) the Node Exporter12, for retrieving low-layer metrics from the monitored network components (also,
targets); d) a Grafana13 server, which makes it possible to visualize the monitored data at runtime. Apart from these main components, several extensions such as libraries, language client, and the Pushgateway can be used, leveraging the developments in the Prometheus repository. 14 Software extensions supporting the implementation of more agents that monitor heterogeneous network components and resources using available Prometheus exporters is also available online. 15
With regards to the monitoring sever, a global yaml16 configuration file allows to modify the default configuration context and enables the monitoring of multiple targets via the exporters deployed in the infrastructure. The alert manager is configured during runtime when the target endpoints are registered. General alarm rules can be set up during the configuration phase and/or reloaded at runtime.
The Prometheus server provides an endpoint to interact and configure the monitoring of several parameters and the management of targets. After the server has been deployed and is running in the infrastructure, several configurations can be executed:
• Add monitoring targets: multiple exporters can be added to the monitoring system by configuring the targets in the Prometheus server. The exposed metrics will be labelled with the parameters configured in the registration process, for being later able to filter metrics and operations, based on those parameters;
• Delete monitoring targets: after the finalization of the monitoring process, a target can be deleted from the system. When a target is deleted, the system stops providing the metrics related to that target to the server.
• Add defined rules: the system is able to create alarms based on predefined rules. Such rules are configured based on the monitored metrics and associated to the parameters defined in the targets. A rule can include an internal logic, based on one or more elements that at a given point will trigger a message of the active rule by the alert manager instance.
12https://github.com/prometheus/node_exporter, Accessed on: March 2021. 13 https://grafana.com, Accessed on: March 2021.
14https://github.com/prometheus/, Accessed on: March 2021.
15https://prometheus.io/docs/instrumenting/exporters/, Accessed on: March 2021. 16 https://yaml.org, Accessed on: March 2021.
Once installation and configuration are performed, the system answers to the requests made by registered targets and defined alerts. Within the 5GENESIS Reference Architecture, the ELCM supports possible on-demand activation of exporters on specific targets, and redirects the collected data towards the InfluxDB database.
3.1.2. Exporters for RAN and Core Network Monitoring
Besides the usage of the general-purpose Node Exporter, dedicated Prometheus exporters have been also developed by 5GENESIS for monitoring specific components used across 5GENESIS platforms. In the following, we document the development and usage of the Amarisoft Exporter, dedicated to the monitoring of Amarisoft RAN nodes, and of the Open5GCore (O5GC) Exporter, that collects metrics from the O5GC used in the Berlin platform. 3.1.2.1. Amarisoft RAN Exporter
The Amarisoft Exporter is a Prometheus exporter for Amarisoft RAN metrics written in Go. It gathers RAN metrics using the Amarisoft API and makes them accessible under a dedicated Hypertext Transfer Protocol (HTTP) endpoint. As depicted in Figure 2, the Prometheus server scrapes metrics from the Amarisoft Exporter through the exposed endpoint.
Figure 2. Integration and usage of the Amarisoft Exporter (in parallel to the Node Exporter). The Amarisoft Exporter functions by opening a socket connection to the Amarisoft API. Then, it sends a “stats” message, parses the replies into metric fields, and exposes them under a “/metrics” endpoint in Prometheus format. The exported metrics are reported in Table 1.
Table 1. Metrics collected by the Amarisoft Exporter.
Metric name Description
dl_bitrate Downlink bitrate in bits per second
ul_bitrate Uplink bitrate in bits per second
dl_txok Number of successfully transmitted transport blocks
ul_rxok Number of received uplink transport blocks without CRC error
rx_sample_rate CPU consumption for reception chain (RX) in Million samples per sec tx_sample_rate CPU consumption for transmission chain (TX) in Million samples per sec
rx_cpu_time CPU consumption (percentage) for RX
tx_cpu_time CPU consumption (percentage) for TX
rxtx_delay_min TX-RX delay min * rxtx_delay_max TX-RX delay max * rxtx_delay_avg TX-RX delay average *
* RX/TX delay is the remaining time before data are processed and the time they must be sent in downlink.
3.1.2.2. Open5GCore (O5GC) Exporter
The Fraunhofer FOKUS’s O5GC implements a monitoring mechanism for its Virtual Network Functions (VNFs) to expose relevant metrics. In addition to the Zabbix17 support presented in Deliverable D3.5, O5GC monitoring component was also extended to support the Prometheus system, in order to align the Berlin platform with the other 5GENESIS platforms. It supports the scraping of gathered metrics via HTTP in a compatible format. As is common practice, the metrics can be found on the given host on a preconfigured port at the “/metrics” url.
Currently, the O5GC Exporter exposes metrics regarding the memory usage of the VNFs, e.g., allocated bytes and memory pool usage, but more metrics are planned and can be easily added. Figure 3 shows an example of Grafana dashboard with some of the memory-related metrics monitored across O5GC’s VNFs.
Figure 3. Excerpts of Grafana dashboard showing O5GC metrics.
3.1.3. Slice Monitoring
The Release B of the 5GENESIS Slice Manager includes a monitoring, visualization, and alerting toolkit, which is responsible for tracking the status of components and services that are part of the instantiated slices. In order to achieve this, the 5GENESIS Slice Manager is capitalizing on Prometheus and Grafana for creating the slice monitoring module, which is packaged and delivered as part of the micro-service architecture.
Prometheus is used for scraping, storing, and organizing metrics from both physical and virtual components and services of the underlying infrastructure that have been instantiated and/or configured to be part of a deployed slice. Prometheus collects data from the following sources: • The Node Exporter, which collects health-related metrics of the VNFs that have been created as part of a slice. In addition, it tracks generic slice information, such as the number and the status of the slices;
• Monitoring tools or exporters that are implemented from various components of the underlying infrastructure. In the current implementation, the Slice Manager collects and exposes metrics from the Virtual Infrastructure Manager (VIM), the Network Function Virtualization Orchestrator (NFVO) and the Wide Area Network (WAN) Infrastructure Manager (WIM), such as the network traffic, bandwidth utilization, VNF health and performance, CPU, memory and disk usage, etc.
Figure 4. Excerpts of the Grafana dashboard showing an example of Slice Monitoring.
Figure 4 provides a snapshot of the Grafana Dashboard that visualizes metrics collected for a deployed slice. The Slice Manager exploits the Prometheus functionalities in order to expose the collected metrics through a specific API. This information is available to be collected by any other monitoring tool, including another higher-level Prometheus server in a hierarchical federation. This allows the slice monitoring module to be integrated with the IM tools of each 5GENESIS platform. Full description of this functionality and its implementation are included in Deliverable D3.4, which focuses on Slice Management (Release B).
MONROE Virtual Node (VN) enhancements for
Performance Monitoring
To carry out the experiments defined in 5GENESIS, we have designed a number of MONROE probes. The ping and throughput containers have already been described in D3.5. These two containers first came out as a part of Release A. In the Release A version of the throughput container, the output contains nested JavaScript Object Notation (json18), which is problematic to automatically store at the InfluxDB in the ELCM backend. Therefore, in support of the generalized support for MONROE VN in 5GENESIS Release B, we have updated the throughput container such that it flattens the json at the output. An example of the updated throughput container output is included in Annex 5, where the integration and usage of MONROE VN in the Berlin platform is also reported as a reference example.
Furthermore, two new containers called browsertime5g19 and 360dash20 have been designed for measuring web browsing and 360-degree video streaming performance from 5GENESIS platforms. These new containers are further described below.
18https://www.json.org/, Accessed on: March 2021.
19https://github.com/5genesis/monroe-experiments/tree/ReleaseB/browsertime5g, Accessed on: March 2021. 20https://github.com/5genesis/monroe-experiments/tree/ReleaseB/360dash, Accessed on: March 2021.
3.2.1. Browsertime5g
Browserime5g is based on browsertime21 but specifically engineered to run from a Monroe probe. We configured Browsertime5g to mimic a mobile device browser (by setting both the screen resolution and the user-agent accordingly) to retrieve the mobile versions of the visited pages. With it, we direct the browser to load a page and, at the end of page rendering, it executes a custom JavaScript script to collect a large number of metrics. X virtual frame-buffer22 (Xvfb) emulates a display to let the browsers actually render the web pages.
Browsertime5g provides a configurable experiment template to enable web measurements. We can configure each measurement by controlling (i) the network to test (Ethernet, or a Mobile Broad Band (MBB) interface), (ii) the browser (Firefox 83 or Chrome 85.0.4183.83), and (iii) the web protocol (HTTPS [11], HTTP/2.0 [12], or HTTP3 [13]). A combination of these parameters builds an experiment setup. Browsertime5g can be configured to visit any number of pages. Given a network to test, Browsertime5g shuffles the order of pages to visit. It visits each page with every browser and protocol combination, in a random order. Every visit is independent.
For each page visit Browsertime5g uses Selenium23 to start a browser (Firefox/Chrome). It also starts FFMPEG24 to record a video session to record the page download. Once the page is loaded in the browser, Browsertime5g executes a custom java script to collect a large number of metrics such as pageloadtime [14], Rum SpeedIndex25, first paint etc. It also collects a HTTP Archive26 file that saves all request/response on that page. Next, the FFMpeg is stopped and the video is analyzed to determine several visual metrics, such as Speed Index27.
The default input values are: {
"guid": "no.guid.in.config.file", # Should be overridden by scheduler "url": "http://193.10.227.25/test/1000M.zip",
"size": 3*1024, # The maximum size in Kbytes to download "time": 3600, # The maximum time in seconds for a download "zmqport": "tcp://172.17.0.1:5556",
"modem_metadata_topic": "MONROE.META.DEVICE.MODEM", "dataversion": 1,
"dataid": "5GENESIS.EXP.HEADLESS.BROWSERTIME", "nodeid": "fake.nodeid",
"meta_grace": 120, # Grace period to wait for interface metadata "exp_grace": 120, # Grace period before killing experiment
21 https://github.com/sitespeedio/browsertime, Accessed on: March 2021.
22 https://www.x.org/releases/X11R7.6/doc/man/man1/Xvfb.1.xhtml, Accessed on: March 2021. 23 https://www.selenium.dev/selenium/docs/api/javascript/index.html, Accessed on: March 2021. 24https://www.ffmpeg.org, Accessed on: March 2021.
25 https://github.com/WPO-Foundation/RUM-SpeedIndex, Accessed on: March 2021. 26 http://www.softwareishard.com/blog/har-12-spec/, Accessed on: March 2021. 27 https://www.keycdn.com/blog/speed-index, Accessed on: March 2021.
"ifup_interval_check": 6, # Interval to check if interface is up "time_between_experiments": 5,
"verbosity": 2, # 0 = "Mute", 1=error, 2=Information, 3=verbose "resultdir": "/monroe/results/", "modeminterfacename": "InternalInterface", "urls": ['www.instagram.com'], "http_protocols":["h1s","h2","http3"], "browsers":["chrome","firefox"], "iterations": 1,
"allowed_interfaces": ["eth0"], # Interface to run the experiment on "interfaces_without_metadata": ["eth0"] # Manual metadata on these IF }
Using the above inputs (default), the browsertime5g will download the Instagram page over the selected source interface with different combinations of three different http protocols each time. Browsertime5g outputs a single json file combining all the metrics and a http archive information. All fields in the output are flattened to be compatible with InfluxDB. An example of produced output that corresponds to visiting Instagram using google-chrome with HTTP3 is provided in Annex 5.
3.2.2. 360dash
360dash28 is based on dashc and the work done in [15], but specifically engineered to run from a Monroe probe. We configured 360dash to stream a dash video/url for a specified amount of time (or until the video is finished).
360dash provides a configurable experiment template to enable dash video measurements. We can configure each measurement by controlling (i) the network to test (Ethernet, or an MBB interface), (ii) the video stream to use and optionally (iii) the duration of the experiment. A combination of these parameters builds an experiment setup.
While streaming, 360dash records multiple metrics related to the video stream such as current buffer level, number of stalls etc.
The default input values are: {
"zmqport": "tcp://172.17.0.1:5556", "guid": "fake.guid", # Need to be overriden "nodeid": "virtual",
"metadata_topic": "MONROE.META", "dataid": "5GENESIS.EXP.DASHC", "dataversion": 1,
"verbosity": 2, # 0 = "Mute", 1=error, 2=Information, 3=verbose "resultdir": "/monroe/results/",
"flatten_delimiter": '.',
"allowed_interfaces": ["ens160", "ens192", "eth0"], "url": "http://panoplay.duckdns.org/abs/stream/out.mpd", "duration": 900 # If 0 or less wait until video is done }
Using the above inputs (default), the 360dash will download an example 360 video over each allowed interface in sequence (if the interface is available). All fields in the output are flattened to be compatible with InfluxDB. An example of produced output with duration set to 10 seconds, all other values set to the default, is provided in Annex 5.
Other Probes for Performance Monitoring
3.3.1. Remote Agents
The iPerf and Ping remote agents presented in Deliverable D3.5 are also available as part of Release B. Their functionalities have not changed; however, several bugs have been fixed and, in the case of the Ping agent, the exposed REST API has been modified in order to improve usability. Table 2 shows the updated endpoints on the Ping Agents.
Table 2. Ping Agent endpoints.
Endpoint Method Description
/Ping/<address> GET Starts a Ping instance using the address specified. Accepts the following URL parameters: interval, size, ttl.
/Close GET Stops the running Ping instance.
/LastJsonResult GET Retrieves the results from the previous execution.
/StartDateTime GET Returns the time and date when the previous instance of Ping was started.
/IsRunning GET Returns a message indicating if there is an active Ping instance.
3.3.2. PM Agents for Android devices
As for the Remote Agents, the Android applications presented in Deliverable D3.5 have received continued support, fixing bugs detected during the previous experimentation cycle and further refining their functionalities.
In order to support testing outside of the lab environment, all agents are now able to write the recorded measurements to text files that are saved in the device. These files can later be
analyzed offline in the 5GENESIS facilities, uploading these results in the main database and making them available to the Analytics module.
3.3.3. IxChariot
IxChariot is a traffic generator tool that focuses on network performance assessment and application simulation.
To run the networking tests, IxChariot uses software agents called endpoints, that can be installed in various platforms (Linux, Windows, Android and iOS), to allow for the evaluation of the network between them. The platform offers a variety of traffic patterns ranging from basic TCP or UDP flow groups, to complex application mixes derived from real world traffic scenarios such as video streaming services (YouTube, Netflix) or voice call services (Skype).
Each testing session aims to benchmark network performance by measuring specific KPIs such as RTT, One Way Delay, Jitter, Packet Loss and Throughput based on the traffic patterns defined between the user groups. Additional options include the use of QoS policies per endpoint, along with the simulation of multiple user groups. Testing sessions are defined, configured and ran by the web application that runs as part of the IxChariot server, where the experimenter can register the endpoints, test options and traffic patterns, as shown below on Figure 5.
Figure 5. IxChariot interface for experiment composition and execution.
Results can be exported either on csv format or as part of a detailed report with custom graphs that visualise target KPIs for each test execution.
4. S
TORAGE AND
A
NALYTICS
InfluxDB
In M&A Release B, we have maintained InfluxDB for long-term storage of experimental data. The InfluxDB Result Listener allows the ELCM to retrieve IM/PM metrics in the form of time series, and automatically redirect them towards dedicated InfluxDB measurement tables within a platform-specific database instance.
Analytics can query and read the data needed for the analyses via the Data Handler service described in Section 4.2.2, which adopts the APIs provided by the open-source InfluxDB-Python client for accessing a platform-specific InfluxDB instance.
Analytics
In order to tackle the analysis of health and performance of the 5GENESIS platforms during the experiment executions, we have implemented a variety of Analytics methods. In M&A Release B, such methods have been developed as micro-services, using Docker containers for the encapsulation of functionalities into services, and Flask for REST inter-service communication. Figure 6 gives an overview of the implemented containers and their functions. These include anomaly detection and correlation analysis for health monitoring purposes (i.e., is the experiment running as expected?), and KPI prediction for performance analysis (e.g., to support potential performance improvement of certain network elements).
Figure 6. Overview of the containerised analytics micro-services and their functions. A GUI provides easy access to the different functionalities (see next figures for GUI examples).
4.2.1. Visualization Service
The visualization service allows for visual representation of the results from the other services in an interactive fashion. The user can access this visualization through a GUI that runs in the browser. The interactive analytics dashboard is implemented using Plotly DASH. 29
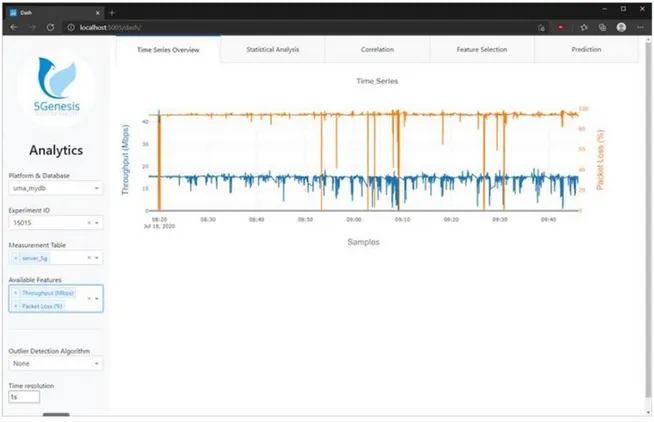
After an experiment is run and its data is stored in the InfluxDB database, the user can browse and analyze the experiment results through the GUI. The user can select which experiment results to display on the left-hand side of the GUI, using the parameters of the experiment query. The main part of the interface is a tabbed environment, where the user can switch between the different Analytics services. From left to right, the tabs contain (1) a time series overview window, (2) a statistical analysis window, (3) a correlation window, (4) a feature selection window and (5) a KPI prediction window as described below.
Figure 7. Time series overview window.
After selecting the desired experiment and KPI(s), the time series overview window (Figure 7) displays a graph with the selected KPI(s). When multiple KPIs are selected for comparison, they are added to the plot with different colours and y-axis scales, as exemplified in Figure 7. Any number of KPIs can be added to this plot and each one will have its own colour and y-axis, however, for best visual comparison, not more than four or five KPIs should be plotted together.
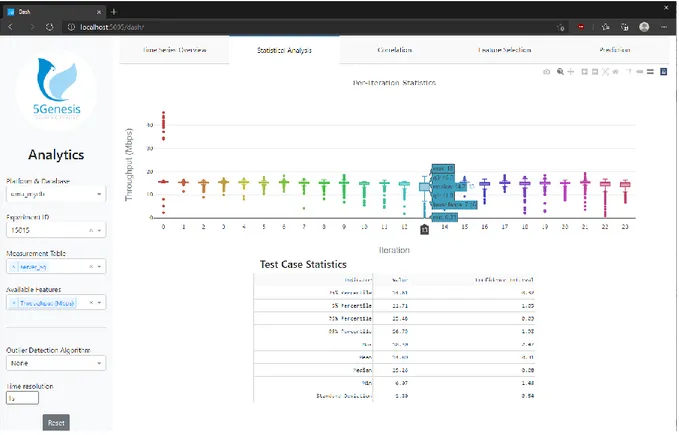
Figure 8. Statistical analysis window.
The statistical analysis window (Figure 8) displays the results of the KPI statistical validation procedure, as defined by 5GENESIS, i.e., per iteration statistics and test case statistics (obtained by averaging over iterations) with a confidence interval [6]. On mouse-over, the graph will show details for each box plot representing each iteration.
In the correlation window, the user can select between two types of correlation. The
intra-experiment cross-correlation (Figure 9) offers a correlation matrix of all numerical fields in the
selected experiment.
Figure 10. Correlation window showing the inter-experiment field correlation.
The inter-experiment field correlation (Figure 10) lets the user select a second experiment from a dropdown menu. The correlation between experiments, for all numerical fields available in both experiments (originally selected one and added one), are then displayed in a table format.
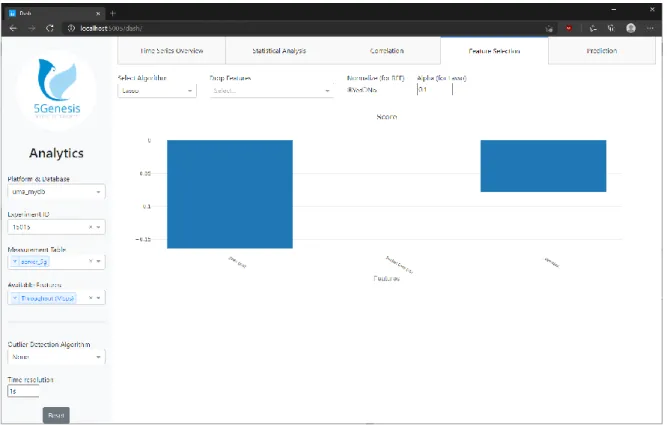
Figure 11. Feature selection window.
The feature selection window (Figure 11) shows the result of the chosen feature selection algorithm, for which additional parameters can be specified and some features may be excluded from the feature selection. The feature selection allows the experimenter to filter out unnecessary parameters for the prediction of a selected target KPI for the current experiment.
The last window displays the KPI model training for the selected target KPI in the current experiment (Figure 12). The user can select the ML algorithm to be used for the training and exclude features from the training. A button allows for automatic feature selection by calling the Feature Selection service in the background. After the “Train model” button is clicked and the training concluded, the training results are displayed. The results include a table with several error rate metrics, a scatter plot that contrasts actual vs predicted values, and a table that shows the model coefficients (in the case of the linear regression) or the feature importance values (in the case of the Random Forest or SVR algorithms).
4.2.2. Data Handler Service
The data handler service provides a unified access to data that is stored in various InfluxDB instances. It also provides data preprocessing functionality, including time series synchronization, as well as outlier detection and removal as outlined below. The data handler converts InfluxDB data into Pandas dataframes that can be directly used by the various analytics algorithms. For transferring data between services, a Pandas dataframe is converted to json format.
4.2.2.1. Time Series Synchronization
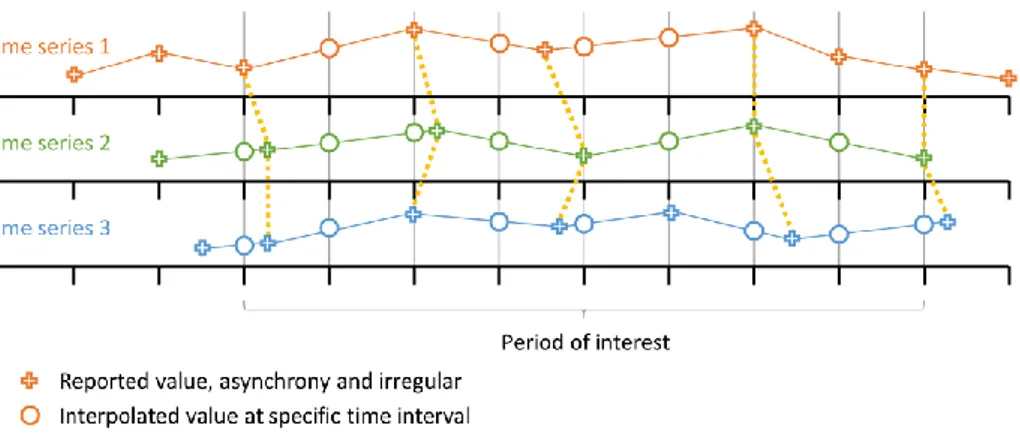
Before running advanced analyses on the data collected during the execution of experiments, the data coming from different monitoring probes needs to be merged. The measurements may be recorded at slightly different times, often with a few milliseconds difference, or with a different granularity, as exemplified in Figure 13.
Figure 13. Time series synchronisation: Individual measurement points (pluses) can be linked by interpolation (circles) or synchronisation approaches (yellow lines).
As an example in the scope of the 5GENESIS M&A framework, IM and PM probes may be nearly but not perfectly synchronized, since they are activated by the ELCM in successive steps. Moreover, they may collect data with different sampling periods, e.g., targeting the framework scalability, IM probes collecting the CPU consumption of computing units may work at reduced rates when compared with PM counterparts, which are instead tracking a QoS/QoE KPI, e.g., the user throughput. Within the current version of the Analytics component, we handle the alignment of measurements from different monitoring sources by means of time series synchronization.
Synchronization is a way to align the data points that are closest together in time, irrespective of the exact time when they were recorded. In Figure 13, the synchronization is demonstrated with the yellow dotted lines that connect real data points from the red, green and blue measurements. The synchronization approach is feasible because the time difference between data points across measurements is usually much smaller (often in the order of milliseconds) than the time difference to the neighboring data points in the same measurement (often in the order of seconds), which allows for accurate matching of data points across measurements. In the current implementation, a time granularity can be specified, on which the data points from all measurements will be synchronized. For example, if the granularity of one second is specified, the timestamp of each data point will be truncated to the full second. If there are multiple data points per second in one measurement, the average is calculated.
4.2.2.2. Anomaly Detection
Another challenge that must be addressed before diving into analytics is the occurrence of drastic anomalies that may skew analytical results. Anomalies are values that were recorded but do not lie in the typical range of a variable, for example a 16-digit Kbps figure where the normal range is in the 3-digit area. A recorded number that is that far off the expected values suggests an error in the measurement or reporting, which is relevant for the health monitoring of the experiment components, such as measurement probes. Two anomaly detection methods are currently integrated in the Analytics component:
• Z-Score uses the standard deviation of the given distribution of recorded data points (per variable) to determine whether a data point does not belong to the expected value range. Any value that is at least three standard deviations away from the mean is considered an outlier and will be removed before proceeding to apply analytical methods;
• Median Absolute Deviation (MAD), also known as Robust Z-Score, is a method that uses the so-called MAD score to detect outliers. The score is defined, for each population sample 𝑥𝑖, as follows:
𝑀𝑖 =
0.6745(𝑥𝑖−𝑥̃)
𝘔𝘈𝘋 ,
where 𝘔𝘈𝘋 = median{|𝑥𝑖 − 𝑥̃|}, 𝑥̃ represents the median of the sampled population, and the value of 0.6745 comes out under the assumption of normally distributed data, being in fact the 75% percentile of the standard normal distribution. The samples for which |𝑀𝑖| > 3.5 are considered outliers.
Both methods are implemented using Pandas and NumPy vectorization methods with a focus on performance and near real time application, and present comparable computational costs.
4.2.3. Statistical Analysis Service
The statistical analysis service provides a statistical overview of the recorded data, following the 5GENESIS guidelines on how a KPI should be validated [6]. The provided statistics include per iteration average, minimum, maximum and quartiles. Box plots also show the quartiles (25%, median, 75%) and outliers to get a quick overview of how stable the experiment has
performed over all iterations. These indicators are then averaged over iterations to produce a test case overall indicator, that is also accompanied by a confidence interval.
4.2.4. Linear Correlation Analysis Service
The correlation service provides state of the art correlation algorithms to find linear relationships between variables.
The experimenter may be interested in the similarity of temporal behavior between recorded variables. A correlation approach is a fast and computationally efficient way to gain insight into the similarity between variables or KPIs. In the current implementation, the experimenter can specify the type of correlation one wants to perform, choosing from state-of-the-art correlations, such as Pearson, Spearman and Kendall. These algorithms are provided by the Pandas package for the programming language Python.
The correlation module currently provides two types of correlation use cases: • Cross-correlation of fields in the same experiment;
• Correlation of fields across different experiments.
The first correlation analysis use case allows the experimenter to compare variables in the same experiment. For example, the experimenter can investigate the correlation between several recorded throughput and power consumption variables for an Urban Pedestrian iPerf experiment. The second correlation use case offers correlation of targeted measurement fields across different experiments. For example, the experimenter may wish to compare the average throughput measurement of an Urban Pedestrian iPerf experiment with that of an Ideal iPerf experiment.
The correlation service utilizes the corr() function that is provided by Pandas and can be applied directly on dataframes.
4.2.5. Feature Selection Service
The feature selection service uses algorithms, such as Backward Elimination (BE), Recursive Feature Elimination (RFE) and Lasso to identify the most relevant variables for a target KPI. Feature selection is an important step in data analysis, and hence this functionality has been also included in the 5GENESIS Analytics component. Given a dataset related to a particular experiment, the feature selection utility can be primarily applied in quest of dimensionality reduction, e.g., to discard parameters collected from the monitoring probes that are not directly correlated or too much correlated with the KPI under test and hence superfluous. The presence of these parameters may in fact hinder following analyses, e.g., the prediction, as they may negatively impact the fitted model. The algorithms for numeric feature selection are traditionally divided in three main categories, that is, filter, wrapper, and embedded methods. In the second and last version of Analytics, we focus on numeric feature selection, that is, all categorical variables are not considered. Moreover, as discussed in the following, we implement two wrapper methods, namely BE and RFE, and one embedded method based on Lasso-regularized regression.
As part of the wrapper category, BE adopts an ML algorithm to fit a specific model using the available features. It starts with the entire set, and iteratively removes features based on the model accuracy. More precisely, the same model is built at each iteration using the remaining features, and the p-value for each of them is evaluated. The features resulting in a p-value larger than 0.05 are removed. In its current implementation, an Ordinary Least Squares (OLS) model is adopted, being this latter largely used to perform linear regression.
Similar to BE, RFE works by recursively removing features while building a model. It initially fits a model, e.g., linear regression, based on all features. Then, at each iteration, it evaluates feature coefficients and importance, ranks them on the basis of the linear regression accuracy, and finally removes low ranking features.
Across embedded methods, the ones based on regularization are quite popular. Lasso regularization lies in the 𝘓𝟣 function space and deals with possible linear regression overfitting by penalizing unimportant features, assigning them coefficients up to zero. It then follows that this approach can be directly used for feature selection tasks.
The feature selection functionalities included in our Analytics components build on top of Pandas, NumPy, and SciKit-Learn libraries.
4.2.6. KPI Prediction Service
The KPI prediction service provides classic state-of-the-art ML algorithms to train prediction models on a given target KPI for predictive analysis. The trained models can be used further down the line for live predictions.
One of the performance analysis use cases we investigate is KPI prediction. With that the experimenter can attempt to identify how the various network elements impact the targeted measurement KPIs in order to understand how the network can be manipulated to achieve a desired increase or decrease of a KPI. A typical application is to predict the resource requirements that are needed to achieve a desired throughput.
We implement a number of prediction algorithms towards that goal. In the current release of the analytics module, we focus on Linear Regression, Random Forest and Support Vector Machine (SVM)-based regression algorithms, utilizing freely available SciKit-Learn modules. The selection does not include deep learning algorithms at this point as we focus on faster trainable models that are served to the visualization service in near real-time (linear regression) or with an acceptable waiting time (random forest and SVM), for small and medium-sized data. For these experiments, we obtained good results for prediction with the current methods.
APIs for result retrieving
Once the execution of the experiment is finalized, the experimenter retrieves the result information to get insights of the observed performance. The Analytics containers have all the information related to the experiment, and can thus provide the evaluated KPIs that have been defined during the experiment setup, but also information on other metrics collected by the probes in different infrastructure components.
The experimenter can request the desired KPIs through the Dispatcher, by means of command line interface and the 5GENESIS Open APIs, or by using the 5GENESIS Portal. Before the
requested information is provided, the Dispatcher verifies and validate that the user is the owner of the experiment, securing the platform and making available the results of the owner executed experiment.
To offer this information two main endpoints have been provided to the dispatcher environment
• Raw data info, to get better insight of specific metrics in the infrastructure;
• Statistical analysis of a given experiment, with the required measurements and KPI parameters.
4.3.1. Analytics service APIs
In addition to the GUI described in Section 4.2.1, each of the Analytics services can be consumed through a REST API. The descriptions in this section refer to a locally deployed analytics platform which can be accessed on http://localhost. For remote connections, the “localhost” must be replaced with the remote IP address. Note that the term “measurement” used throughout this section refers to one of the measurement tables composing an InfluxdB database. For example, a measurement may comprise parameters and KPIs related to throughput performance, while another measurement may contain parameters related to network configurations and other information (e.g., location information if available).
4.3.1.1. Data Handler Service
The Data Handler container is the access point for the analytics algorithm containers to retrieve the data from different sources.
The Data Handler can be accessed at http://localhost:5000.
A brief API description is available at http://localhost:5000/api (or alternatively http://localhost:5000/help) and includes the following commands:
• List all available datasources: http://localhost:5000/get_datasources
• List all available experiments: http://localhost:5000/get_all_experimentIds/datasource • List available experiments for given measurement:
http://localhost:5000/get_experimentIds_for_measurement/datasource/measureme ntId
• List available measurements for a given experiment:
http://localhost:5000/get_measurements_for_experimentId/datasource/experimentI d
• Retrieve data from a given experiment:
http://localhost:5000/get_data/datasource/experimentId o Parameters:
▪ measurement: e.g. Throughput_Measures (default all available measurements)
▪ remove_outliers: zscore or mad (default none)
▪ match_series: to synchronize data from multiple measurements (default false)
▪ limit: any integer to indicate a limit on the returned rows (default none) ▪ offset: any integer to indicate the offset for the row limit (default none) ▪ additional_clause: any InfluxDB clause (default none)
▪ chunked: whether the results are retrieved from the server in chunks (default false)
▪ chunk_size: any integer to define the chunk size (default 10000 if chunked is enabled)
• Retrieve data from two experiments (e.g. for correlation):
http://localhost:5000/get_data/datasource/experimentId1/experimentId2
o Parameters same as above
• Clear the data handler's cache: http://localhost:5000/purge_cache Example output for /get_data/:
4.3.1.2. Correlation Service
The Correlation container enables the user to perform:
• a cross-correlation on the fields within the same experiment (resulting in a correlation matrix)
• a correlation of the fields across different experiments (resulting in a list of correlation values)
Access the Correlation module at http://localhost:5001.
An API description is available at http://localhost:5001/api and includes the following commands: { "ADB_Resource_Agent": { "Available RAM (MB)": { "0": 845, "1": 803, "2": 808, ... }, ... }, "Throughput_Measures": { "DL - AverageThput (Kbps)": { "0": 3617.0005, "1": 4436.538269, "2": 3900.982222, ... }, ... } }
• Cross-correlation of fields within the same experiment:
http://localhost:5001/correlate/fields/datasource/experimentId
o Parameters:
▪ measurement: e.g. Throughput_Measures (default all available measurements)
▪ method: any Pandas correlation method (default pearson) ▪ remove_outliers: zscore or mad (default none)
▪ field: filter for fields, e.g. Throughput (default none, all fields are included)
• Correlation of fields between different experiments:
http://localhost:5001/correlate/experiments/datasource/experimentId1/experimentI d2
o Parameters same as above
Example output for /correlate/fields/:
Example output for /correlate/experiments/:
4.3.1.3. Prediction Service
The Prediction container enables the user to train and download a KPI prediction model on a specified target KPI.
Access the Prediction module at http://localhost:5002.
An API description is available at http://localhost:5002/api and includes the following commands:
• KPI Prediction using different algorithms:
http://localhost:5002/train/datasource/algorithm/target
o Algorithm (mandatory selection):
{ "correlation_matrix": { "DL - AverageThput (Kbps)": { "SNR": 0.21373483, "RSSI": 0.1842762049, ... }, ... } } { "correlation_list": { "Available RAM (MB)": 0.190006483, "DL - AverageThput (Kbps)": -0.0301038513, ... } }