Master thesis in food science 15 hp
Ht 2018
FOOD CHOICES AND FACTORS THAT
AFFECTS FOOD CHOICES AMONG
IMMIGRANTS FROM IRAQ RESIDENT IN
SWEDEN.
A quantitative study
Sheima Al-AdiliAbstract
Background Previous studies have shown that diabetes type two and obesity are
overrepresented among immigrants with Iraqi background that are resident in Sweden.
Objective The study aims at investigating food choices and factors of significance that
influence on food choices among Iraqi immigrants in Sweden. How are the food choices regarding vegetables and fruits, fat, wholegrain/fiber and sugar in relation to Nordic Nutritional Recommendations? How significant are the following factors: Gender, Age, Years living in Sweden and educational level?
Method The study is a self-reported, questionnaire-based research about food choices
among Iraqi immigrants resident in Sweden. Online-questionnaire where created and published through social media and included 304 respondents.
Results The result from the study shows that most Iraqi immigrants do not meet the
recommendations regarding the frequency of eating fish, choosing keyhole-marked products and choosing wholegrain products. The majority eats vegetables, include
vegetables to all meals, use oil for cooking, do not eat sweets daily and do not add sugar to hot drinks. The only significant difference discovered when comparing variables
regarding gender, age, years living in Sweden and education level where that people living over ten years in Sweden include vegetables to all meals as opposed to people living less than 10 years in Sweden.
Conclusions In general, there were no differences in food choices in relation to sex, age,
educational level and years living in Sweden. There is room for improvement regarding food choices among the studied group.
Sammanfattning
Bakgrund Tidigare studier har visat att diabetes typ två samt fetma är
överrepresenterade hos invandrare med Irakisk bakgrund bosatta i Sverige.
Syfte Syftet med denna studie är att undersöka matvalen hos invandrare med Irakisk
bakgrund beträffande; grönsaker, frukt, fett samt socker, i förhållande till Nordiska Närings Rekommendationer samt undersöka huruvida faktorer som kön, ålder, antal år i Sverige samt utbildningsnivå har betydelse för matvanorna.
Metod En online-enkät framställdes och publicerades via sociala medier. I studien
inkluderades 304 deltagare.
Resultat Resultatet från undersökningen visar att de flesta inte uppnår
rekommendationerna gällande intag av fisk, val av nyckelhålsmärkta livsmedel, samt fullkornsprodukter. De flesta äter grönsaker, använder olja till matlagningen, äter inte sötsaker dagligen samt tillsätter inte socker till varma drycker. Den enda signifikanta skillnaden som upptäcktes vid analys av variabler angående kön, ålder, antal år i Sverige samt utbildningsnivå var att personer som levt över tio år i Sveriges inkluderade
grönsaker till alla mål till skillnad från de som levt under tio år i Sverige.
Slutsats Generellt, fanns det ingen skillnad i matval beträffande kön, ålder,
utbildningsnivå samt antal år man levt i Sverige. Det finns utrymme för förbättring beträffande matvalen hos personer med Irakisk bakgrund.
TABLE OF CONTENTS
1. INTRODUCTION ... 5
3. METHODS ... 6
3.1 CHOICE OF METHOD ... 6
3.2 STUDY POPULATION, SELECTION AND QUESTIONNAIRE ... 6
3.3 Statistical loss ... 6
3.4 DATA COLLECTION ... 7
3.5 DATA PROCESSING AND ANALYSIS ... 7
3.5.1 Numeric analysis ... 7
3.5.2 Statistical analyses ... 7
3.6 ETHICAL CONSIDERATION ... 8
4. RESULTS ... 8
4.1 CHARACTERISTICS OF THE PARTICIPANTS ... 8
4.2 Vegetables and fruits ... 9
4.3 Fat ... 11 4. 4 Wholegrain ... 12 4.5 Sugar ... 13 5. DISCUSSION ... 15 5.1 METHOD DISCUSSION ... 15 5.1.1 Choice of method ... 15
5.1.2 Internal and external omission... 15
5.1.3 Generalizability, validity and reliability ... 16
5.2 RESULT DISCUSSION ... 17
5.2.1 Vegetables and fruit ... 17
5.2.2 Fat ... 17
5.2.3 Wholegrain ... 18
5.2.4 Sugar ... 18
5.2.5 Differences within the group ... 18
5.4 SOCIAL RELEVANCE ... 19
5.3 CONCLUSIONS ... 20
6. REFERENCES ... 21
Appendix 1. Creating the questionnaire Appendix 2. Questionnaire
5 1. INTRODUCTION
The current diet advices that are targeting the Swedish population are based on the Nordic Nutrition Recommendations (NNR) (1). The guidelines for the diet composite and
recommended nutritional intakes have been generated after a long-lasting cooperation between Nordic countries where experts have examined scientific publications and
evidence-based diet proposals have emerged. NNR comprise the foundation for planning a diet that satisfies the nutritional need for normal body functioning and growth.
Furthermore, encouraging good health for the population by reducing the risk of developing diet related diseases. In Sweden, the recommendations are converted into nutritional advices by the National Food Agency targeting the Swedish population (2). People are advised to eat more vegetables and fish. Solid fat such as butter and dairy products should be substituted with fluent fats and low-fat alternatives. A higher intake of whole-grain food is also emphasized, and the intake of sugar should be limited.
Because of increased global migration, Sweden has experienced a dramatic demographic change and has become a multicultural society (3). It is estimated that 20 percent of the Swedish population are first- or second-generation immigrants (4). The largest and fastest growing non-European migration in Sweden is coming from the Middle East (5). A survey of living conditions (ULF) from 2000-2005 shows that people with a foreign background reported a poorer health compared to people born in Sweden. Women report moreover more instances of ill health than men (3). A Swedish study suggests that thirty-one percent of the children living in suburbs with a high proportion of immigrants and lower
socioeconomic status in Sweden, where obese or overweight (5). Another study suggests that migration and lack of integration increase the risk of developing obesity and diet related diseases such as cardiovascular diseases (6). The prevalence of diabetes type 2 is for instance more common among Turkish immigrants in Sweden compared to Turks resident in Turkey (7). A review of the literature suggests that level of education, income, age and immigrant’s generation status are factors of significance accounting for changes in dietary habits (8). Low socio-economic status, male gender, higher age and rural or provincial settlement relate to inferior food habits (9). It is evident that lifestyle-related diseases are overrepresented among immigrants and there is a prerequisite for intervention targeting this group (10, 3). The prevalence of diabetes type 2 among Iraqi-immigrants is more than twice as much as the rest of the Swedish population (11). Obesity (BMI over 30 kg/m2) is also more common among Iraqi immigrant compared to the rest of the Swedish population. Changes in food habits occur shortly after migration (12). Intervention to increase knowledge about healthy food is thus of great value to reach out to this group at an early stage (13, 14). By understanding the significance of different factors affecting food choices among Iraqi immigrants, adjusted intervention can be shaped.
2. OBJECTIVES
The study aimed at investigating food choices and factors of significance that influence on food choices among Iraqi immigrants in Sweden according to following research
questions:
- How are the food choices regarding vegetables and fruits, fat, wholegrain/fiber and sugar in relation to the Nordic Nutrition Recommendations?
- Does factors such as; gender, age, years living in Sweden and educational level influence on food choices?
6 3. METHODS
3.1 Choice of Method
Quantitate approach was assessed as an adequate method to conform the study purpose. A qualitative method would have generated a deeper understanding of food choices and factors that affect food choices among the studied group. However, the aim of the study was to obtain a general description, which is possible by using a quantitative method. In addition to that, to investigate differences in food choices between groups a quantitative method where considered more appropriate.
Likert scales with ten points were used to evaluate food choices (Appendix 1). A Likert scale measures attitudes and behaviour by determining the extend which people agree or disagree with a particular statement (15). Questions about the respondent background where based on previous literature regarding factors that may affects food choices. Questions about food choices and attitudes where based on Nordic Nutrition
Recommendations and the author’s own knowledge and experience of Iraqi food culture. Results from previous studies indicate inferior food habits among immigrants (12,13,14). The authors preunderstanding may have shaped the questions included in the study. It was expected that the current study would confirm that Iraqi immigrants have inferior food habits. The questionnaire however was constructed with neutral statements, enabling the participants to answer according to the likert-scale, minimizing biases.
3.2 Study population, selection and questionnaire
The study is a self-reported, questionnaire-based research of food choices among Iraqi immigrant resident in Sweden. An online-questionnaire where created with Google Forms in Arabic. The age where restricted to 15 years and above. Four variables related to factors that affect food choices where highlighted; gender, age, years living in Sweden and
education level. The questionnaire was published via social media through Facebook groups: “Irakiska tjejer i Sverige”, “Irakiska akademiker i Sverige” and “Irak i fokus”. It was also forwarded through WhatsApp to acquaintances with Iraqi origin. The data-collection was done with a snowball sampling. Snowball sampling is a non-probability sampling method where participants recruit other participants for a study (16). It is commonly used when studying minorities, namely when the sample for the study is limited to a small group of the population that are otherwise difficult to reach.
3.3 Statistical loss
Internal statistical- loss occurs when participant responses to a questionnaire but omits question without answering it. Almost all questions in the questionnaire where mandatory expect for some few that concerned specific food and tabs where comments where
requested. In that way, this type of statistical-loss was avoided. A clear and easy
questionnaire may furthermore decrease that risk (24). The questionnaire in Google Forms was done with that in mind. Online-questionnaires have higher internal-loss when
requiring cognitive challenging questions (24), Likert scales where considered appropriate to facilitate for respondents.
Some questions may be interpreted differently and therefore processed as loss (25). Eleven respondents answered the question about fruit intake choosing more than one alternative. These answers for this particular question where therefore excluded. In addition to that, the questions about fruit intake did not contain a zero alternative and could thus be viewed as indirect data-loss.
7 People who could have responded to the questionnaire but for some reasons did not imply an external statistical loss. Individuals who did not have access to Internet nor WhatsApp where thus unintentionally excluded from the study.
3.4 Data collection
The questionnaire where originally written in English and translated afterwards to Arabic. It was initially tested through a pilot-study, involving seven respondents. Some questions where consequently changed after the pilot-study to facilitate for respondent and avoid misconceptions. All responses from the pilot study where deleted before initiating the research. When the responses reached over 300, the questionnaire where withdrawn because the amount of data where considered sufficient. The data was subsequently converted to Excel from Google Sheet. In Microsoft Excel 2016, the data where once again translated to English. Data where analyzed by using SPSS Statistical software (version 24.0 for windows, SPSS, Chicago, Illinois, USA) and different variables where recoded.
3.5 Data processing and analysis 3.5.1 Numeric analysis
Data where processed through SPSS and divided into four categories: vegetables and fruits, wholegrain, fat and sugar. Descriptive statistics where made for each category. Tables where created in Microsoft Word 2007.
3.5.2 Statistical analyses
SPSS where used to investigate significant statistical differences between food choices in gender, age, years living in Sweden and educational level. For normal distributed data parametric test are usually used to explore differences in mean and for non-normal distributed data nonparametric test are used comparing the median (17). The normality was tested using Q-Q plots and calculating skewness and kurtosis for the examined variables. The variables where not normally distributed and therefore non-parametric test where used. Chi-squared test where consequently used to compare food choices in relation to the mentioned factors. The data range where sufficient to conduct a Chi-squared test because n >30 and all expected cell frequencies ≥5 (17). The median, 25 and 75
percentiles where calculated and illustrated in box-plots. Chi-squared test where considered when the median differed between the investigated variables. Differences where considered statistically significant at or under the level of 0,05. An example of collected data is shown in Table 1.
8 Table 1. Description of statements included in the internet-based questionnaire 2018 regarding each food category and definition of score points from a 10-point Likert scale.
Variable
Statements: a score of
1-4 = do not agree, 5-6= not sure, 7-10= agree Vegetables I eat vegetables
I include vegetables to all meals I eat legumes several times a week
Fruit Low fruit intake: 1 fruit a day
Moderate/recommended fruit intake: 2-3 fruits a day High fruit intake: over 3 fruits a day
Fat I use oil when I cook food I choose light dairy products I eat fish 2-3 times a week
Wholegrain I choose whole-grain products I choose wholegrain bread with seeds I choose key-hole marked food
Sugar I eat sweets daily I add sugar to hot drinks
I drink more than one cup juice a day
The Likert scale where divided into three categories after data collection. To facilitate interpretation of data, answers where decoded as: 1-4= do not agree, 5-6= not sure and 7-10= agree. The question regarding fruit-intake constitutes of a multi-choice question (not a Likert scale) that ranges from one fruit to six fruits and above per day. To investigate fruit intake within the group, the median where calculated. Low intake was classified to one fruit per day, recommended intake two to three fruits per day, high intake more than four fruits per day.
3.6 Ethical consideration
Ethical aspects where considered in this study based on the Declaration of Helsinki (DoH) (18). Only respondents over 15 years where approved for the study. The questionnaire was voluntary, and participants could drop out the study whenever they wanted and without explaining the reason. The information about the respondents being anonymous and that all answers where treated with confidentiality where emphasized in the beginning of the questionnaire (Appendix 2).
4. RESULTS
In this section, the results are presented for each food category with its related statements. Differences in gender, age, years living in Sweden and education level are illustrated for each category respectively.
4.1 Characteristics of the participants
Variables concerning the background (Table 2) of the studied population where conducted.
9 Table 2. Description of number of participants and percentage for each variable
regarding gender, age, years living in Sweden and education level according an Internet-based questionnaire 2018.
Variable Definition Study sample, n Percent, %
Sex Male Female 132 172 43 57
Age Young: under 40 years Old: over 40 years
154 150
51 49
Years living in Sweden Living in Sweden more than 10 years Living in Sweden less than 10 years
81 223
27 73
Level of education High education: University studies Low education: Elementary school
205 99
67 33
The survey was based on data from 304 respondents (Table 2). More females participated in the study and most of them where younger than 40 years (66 %) while most of the males where older that 40 years (70 %). The range of age was wide, from 15 to 65 years. The age was divided into two groups along the distribution of the data that displayed a mean and median age of 40 years. Amount of years living in Sweden where divided to less than ten years or more than ten years. Most of the participants had been living for a longer time in Sweden. Only 27 % of the participants had been living less than ten years and 73 % had been living in Sweden longer. The majority 67 % had University degree and 33 % had lower education. Respondents living over ten years in Sweden where older (60 %) and had higher education (66 %).
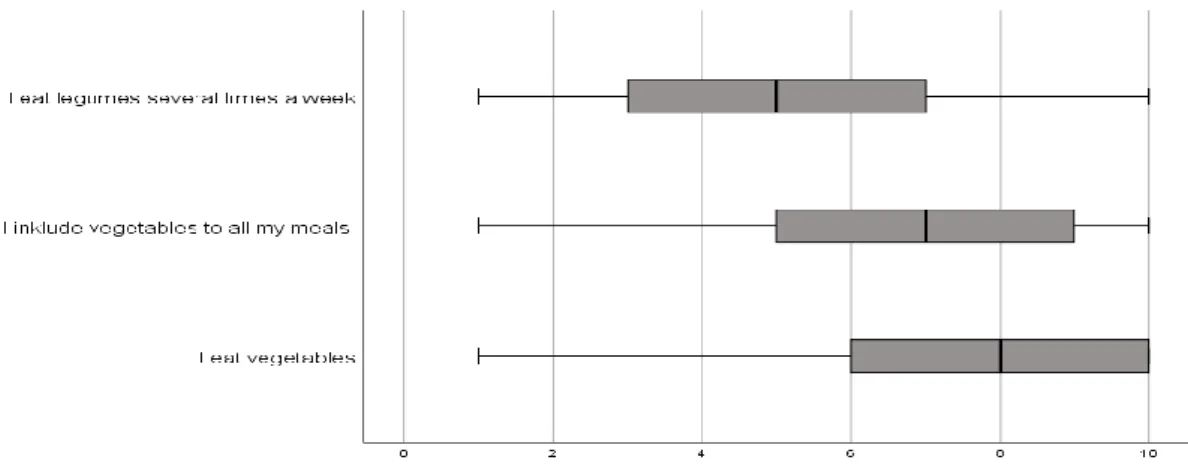
4.2 Vegetables and fruits
The majority strongly agreed that they eat vegetables (Figure 1). The majority agreed that they included vegetables to all meals. Some of the respondents disagreed with the
statement of eating legumes several times a week and some agreed with the statement. The mean intake of fruits was two fruits per day.
Figure 1. Description of responses from Internet-based questionnaire 2018 regarding statements about vegetables through a ten point-scale with 1 representing “do not agree” and 10 “agree”. Box-plots illustrating the median, 25th and 75th percentile and min-max.
10 4.2.1 Differences within the group
The results showed no differences between the groups regarding eating vegetables
(Table3). However, a higher proportion of people that had been living more than 10 years in Sweden, reported including vegetables to all their meals (p=0,031). No differences were detected regarding eating legumes several times a week.
Table 3. Description of grouped variables regarding vegetables from Internet-based questionnaire 2018, based on a 10-point likert-scale. Illustrating numbers, percent and P-value for the compared variables.
n.s = non significant
No differences among the groups regarding fruit intake was shown (Table 4). The median was two fruits per day for each background variable. Table 4 displays missing variables from 11 responses concerning fruit intake.
Don not agree =
1-4 N (%) Not sure = 5-6 N (%) Agree = 7-10 N (%) P-value I eat vegetables Men Women 12 (9) 8 (5) 30 (19) 32 (23) 90 (68) 132 (77) n.s Young Old 7 (4.5) 13 (9) 37 (24) 25 (17) 110 (71) 112 (75) n.s Under ten years living in Sweden
Above ten years living in Sweden
4 (5) 16 (7) 25 (31) 37 (17) 52 (64) 170 (76) n.s Low education Higher education 7 (7) 13 (6) 26 (26) 36 (18) 66 (67) 156 (76) n.s
I include vegetables to all meals
Men Women 30 (23) 30 (17) 35 (26.5) 48 (28) 67 (51) 94 (55) n.s Young Old 24 (16) 26 (24) 52 (34) 31 (21) 78 (51) 83 (55) n.s
Under ten years living in Sweden Above ten years living in Sweden
15 (18.5) 45 (20) 31(38) 52 (23) 35 (43) 126 (56) 0.031 Low education Higher education 25 (25) 35 (17) 22 (22) 61 (30) 52 (52) 109 (53) n.s
I eat legumes several times a week
Men Women 59 (44.5) 66 (38) 29 (22) 43 (25) 44 (33) 63 (37) n.s Young Old 65 (40) 60 (40) 38 (25) 34 (23) 51 (33) 56 (37) n.s
Under ten years living in Sweden Above ten years living in Sweden
33 (41) 92 (41) 18 (22) 54 (24.2) 30 (37) 77 (34.5) n.s Low education Higher education 29 (29) 47 (23) 35 (35) 67 (33) 35 (35) 91(44) n.s
11 Table 4. Description of responses from Internet-based questionnaire 2018 regarding fruit intake, based on a 10-point likert-scale. Illustrated in quantity and percent and including missing values.
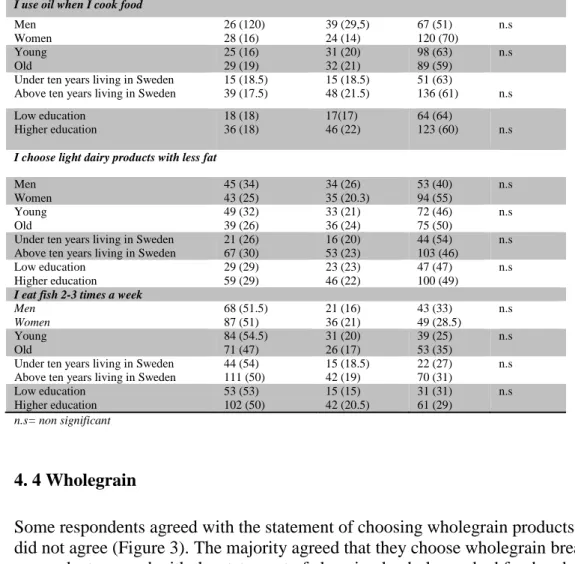
4.3 Fat
Some respondents agreed with the statement of choosing low fat dairy products and some did not agree (Figure 2). The majority did not agree with the statement of eating fish 2 to 3 times a week. Most of the respondents agreed that they use oil for cooking.
Figure 2. Description of responses from an Internet-based questionnaire 2018 regarding fat through a ten point-scale with 1 representing “do not agree” and 10 “agree”. Box-Plot illustrating the median, 25th and 75th percentile and min-max.
4.3.1 Differences within the group
The results showed no significant differences among the groups regarding the use of oil when cooking, choosing low fat dairy products and eating fish (Table 5).
Low intake= Less than one fruit/day N (%)
Recommended intake = 2-3 fruits/day
N (%)
High intake= More than 3 fruits/day N (%) Missing N Men Women 49 (3) 56 (32) 61 (46) 84 (49) 20 (15) 23 (13) 2 9 Young Old 61 (40) 44 (29) 68 (44) 77 (51) 18 (12) 25 (17) 7 4
Under ten years living in Sweden Above ten years living in Sweden
30 (37) 75 (34) 39 (48) 106 (47.5) 8 (10) 35 (16) 4 7 Low education Higher education 32 (32) 73 (36) 51 (51) 94 (46) 13 (13) 30 (15) 3 8
12 Table 5. Description of grouped variables regarding fat from an Internet-based
questionnaire 2018, based on a 10-point likert-scale. Illustrating numbers, percent and P-value for the compared variables.
Don’t agree =1-4 N (%) Not sure = 5-6 N (%) Agree = 7-10 N (%) P-value
I use oil when I cook food
Men Women 26 (120) 28 (16) 39 (29,5) 24 (14) 67 (51) 120 (70) n.s Young Old 25 (16) 29 (19) 31 (20) 32 (21) 98 (63) 89 (59) n.s
Under ten years living in Sweden Above ten years living in Sweden
15 (18.5) 39 (17.5) 15 (18.5) 48 (21.5) 51 (63) 136 (61) n.s Low education Higher education 18 (18) 36 (18) 17(17) 46 (22) 64 (64) 123 (60) n.s
I choose light dairy products with less fat
Men Women 45 (34) 43 (25) 34 (26) 35 (20.3) 53 (40) 94 (55) n.s Young Old 49 (32) 39 (26) 33 (21) 36 (24) 72 (46) 75 (50) n.s
Under ten years living in Sweden Above ten years living in Sweden
21 (26) 67 (30) 16 (20) 53 (23) 44 (54) 103 (46) n.s Low education Higher education 29 (29) 59 (29) 23 (23) 46 (22) 47 (47) 100 (49) n.s
I eat fish 2-3 times a week
Men Women 68 (51.5) 87 (51) 21 (16) 36 (21) 43 (33) 49 (28.5) n.s Young Old 84 (54.5) 71 (47) 31 (20) 26 (17) 39 (25) 53 (35) n.s
Under ten years living in Sweden Above ten years living in Sweden
44 (54) 111 (50) 15 (18.5) 42 (19) 22 (27) 70 (31) n.s Low education Higher education 53 (53) 102 (50) 15 (15) 42 (20.5) 31 (31) 61 (29) n.s n.s= non significant 4. 4 Wholegrain
Some respondents agreed with the statement of choosing wholegrain products and some did not agree (Figure 3). The majority agreed that they choose wholegrain bread. Some respondents agreed with the statement of choosing keyhole-marked food and some did not agree.
Figure 3. Description of responses from internet-based questionnaire 2018 regarding wholegrain through a ten point-scale with 1 representing “do not agree” and 10 “agree”. Box-Plot illustrating the median, 25th and 75th percentile and min-max.
13 4.4.1 Differences within the group
The results showed no significant differences among the group regarding choosing wholegrain products, wholegrain bread with seeds and keyhole-marked products (Table 6).
Table 6. Description of grouped variables regarding wholegrain from an Internet-based questionnaire 2018, based on a 10-point likert-scale. Illustrating numbers, percent and P-value for the compared variables.
n.s= non significant
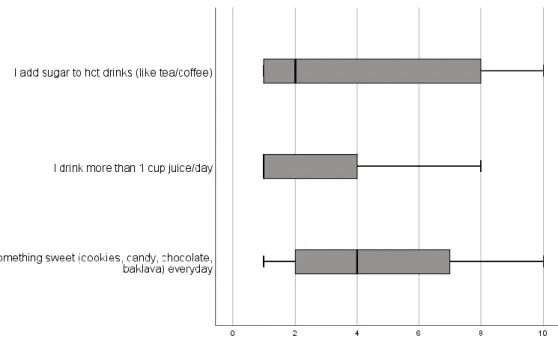
4.5 Sugar
The majority disagreed with the statement regarding eating sweets daily (Figure 4). The majority strongly disagreed that they drank more than one cup of juice per day. The majority disagreed with the statement of adding sugar to drinks.
Do not agree = 1-4 N (%) Not sure = 5-6 N (%) Agree = 7-10 N (%) P-value
I choose wholegrain products
Men Women 37 (28) 55 (32) 33 (25) 35 (20) 62 (47) 82 (48) n.s Young Old 54 (35) 38 (25) 32 (22) 36 (24) 68 (44) 76 (51) n.s Under ten years
living in Sweden Above ten years living in Sweden 27 (33) 65 (29) 15 (18.5) 53 (24) 39 (48) 105 (47) n.s Low education Higher education 27 (27) 65 (32) 22 (22) 46 (22) 50 (50) 94 (46) n.s
I choose wholegrain bread with seeds
Men Women 38 (29) 48 (28) 19 (14) 26 (15) 75 (57) 98 (57) n.s Young Old 47 (30.5) 39 (26) 24 (16) 21 (14) 83 (54) 90 (60) n.s
Under ten years living in Sweden Above ten years living in Sweden 27 (33) 59 (26.5) 9 (11) 36 (16) 45 (56) 128 (57) n.s
I choose products that are marked with a keyhole Low education Higher education 36 (36) 50 (24) 13 (13) 32 (16) 50 (50) 123 (60) n.s Men Women 54 (41) 53 (31) 26 (20) 39 (23) 52 (39) 80 (46.5) n.s Young Old 64 (42) 43 (29) 32 (21) 33 (22) 58 (38) 74 (49) n.s
Under ten years living in Sweden Above ten years living in Sweden 27 (33) 80 (36) 17 (21) 48 (21.5) 37 (46) 95 (43) n.s Low education Higher education 33 (33) 74 (36) 21 (21) 44 (21) 45 (45) 87 (42) n.s
14 Figure 4. Description of responses from an Internet-based questionnaire 2018
regarding sugar through a ten point-scale with 1 representing “do not agree” and 10 “agree”. Illustrating the median, 25th and 75th percentile and min-max.
4.5.1 Differences within the group
The results showed no significant differences within the groups regarding eating sweets daily, adding sugar to drinks and drinking more than one cup juice per day (Table 7).
Table 7. Description of grouped variables regarding sugar from an Internet-based questionnaire 2018 based on a 10-point likert-scale. Illustrating numbers, percent and P-value for the compared variables.
Don do not agree = 1-4
N (%) Not sure = 5-6 N (%) Agree = 7-10 N (%) P-value
I eat something sweet daily
Men Women 76 (58) 86 (50) 23 (17) 31 (18) 33 (25) 55 (32) n.s Young Old 76 (50) 86 (57) 28 (18) 26 (17) 50 (32.5) 38 (25) n.s
Under ten years living in Sweden Above ten years living in Sweden
42 (52) 120 (54) 15 (18.5) 39 (17.5) 24 (30) 64 (29) n.s Low education Higher education 52 (52) 110 (54) 22 (22) 32 (15) 25 (25) 63 (31) n.s
I add sugar to hot drinks
Men Women 82 (62) 102 (59) 13 (10) 19 (11) 37 (28) 51 (30) n.s Young Old 85 (55) 99 (66) 20 (13) 12 (8) 49 (32) 39 (26) n.s Under ten years living in Sweden
Above ten years living in Sweden
50 (62) 134 (60) 11 (14) 21 (10) 20 (25) 68 (30.5) n.s Low education Higher education 53 (53) 131 (64) 11 (11) 21 (10) 35 (35) 53 (26) n.s
I drink more than 1 cup of juice a day
Men Women 102 (77) 143 (83) 22 (17) 16 (9) 8 (6) 13 (8) n.s Young Old 116 (75) 129 (86) 23 (15) 15 (10) 15 (10) 6 (4) n.s
Under ten years living in Sweden Above ten years living in Sweden
65 (80) 180 (80) 12 (15) 26 (12) 4 (45) 17 (8) n.s Low education Higher education 80 (80) 165 (80.5) 13 (13) 25 (12) 6 (6) 15 (7) n.s n.s = non significant
15 5. DISCUSSION
5.1 Method discussion 5.1.1 Choice of method
To gather empirical data, online-questionnaires where used. The advantage of using questionnaires is that all participants get the same exact questions. Furthermore, it is more likely to convey honest answers when not being judged or observed by others.
Questionnaires is considered to be more neutral and minimize the risk of “interviewer effect” that is when the interviewer unconsciously affect the answers of the respondent (19). One of the main ethical advantages to using online-questionnaires is that there is no way to trace the respondents (if not IP numbers are collected) or verify identity (20). A disadvantage of online-questionnaires is that Internet-users may not be representative to the studied population (21). According to a research, social desirability biases are common in measurements using self-report such as dietary intake (22). Individuals may respond according to the impression they want to make and that is socially acceptable.
Furthermore, behaviours that occur in high frequency are not specific in memory, for example food choices in the last months. For that reason, the questionnaire where formed with general statements and not recall of food choices in the past time to simplify for the respondents. However, the scales used in the study can be comprehended differently among the respondents, which may affect the legitimacy of the study. On the other hand, using open-ended questions would have not showed the variety of responses and the “grey zones” from the answers. The questionnaire constituted of ten points Likert scale with 1 representing “do not agree” and 10 “agree”. A larger scale offers more variance, a higher degree of measurement accuracy, easier to detect changes and higher validity than shorter scales (23).
To facilitate for the participants and to increase the chance of attaining more responses, simplicity and transparency where prioritized when forming the questionnaire. A side effect of that is that the results generated from this study only shows tendencies and not actual intake or frequency. Aspects of importance such as portion size, regularity of meals, energy intake and frequency would have generated a better understanding of food choices among the studied group. However, the time-aspect was a hindrance and delimitation were therefore required.
5.1.2 Internal and external omission
Statistical-loss occurs in all studies (24). A big statistical-loss may lead to systematic deviation. It is essential to reach a high response rate to decrease the risk of bias. Internet surveys are limited to new technology and to respondent’s knowledge of using computers and Internet (25). Respondents with lack of experience of using computers have more difficulties answering Internet surveys. Higher statistical- loss may occur among groups with inferior computer skills (26). According to Statistics Sweden (SCB) most Internet users are young, single, student and people with higher educational level (27). That could partly explain why the sample entailed mainly high-educated people. The selection from Facebook groups may furthermore have contributed to that. However, it is expected that statistical-loss that are related to lack of knowledge and old technology are declining by time because of increasing availability of computers and Internet.
16 Beside publication through social media, the questionnaire was published via WhatsApp to the researcher’s acquaintances and family. WhatsApp is an app that is commonly used to keep in touch with relatives and friends in other countries. It has been previously suggested that respondents tend to answer more frequently when studies seem reliable and are conveyed from trustworthy sources (28). In this case, doing a survey in native
language may explain the high response rate. The questionnaire was published in one week and resulted in 304 replies.
5.1.3 Generalizability, validity and reliability
Generalizability, validity and reliability are applied in scientific researches to evaluate the quality of the results (22, 29). Quantitative researches with a large sample-size contribute to a greater confidence in the generalizability of the results. The study was intended to offer a general understanding of food habits among immigrants with Iraqi background. In this study, 304 respondents comprised a reasonable amount of data to state general
conclusions. The choice of method however attracted mainly academics, which affects the generalizability in the present study. The results are thus more characteristic to Iraqi academics rather than all immigrants with Iraqi background. A combination of paper surveys offered in different Iraqi compounds and online questionnaires would have generated a greater generalizability. Lack of time was the reason why only online questionaries’ where included.
Reliability assesses the trustworthiness, consistency of results and evaluates to which extend studies yields the same results on repeated trials (22). The researcher must identify the basis of measurement error and design a study that permits errors. Performing a pilot-study enables the identification of such sources.
Studies should be replicated for greater generalizability and reliability (29). However, lack of time and resources compose an obstacle, which is the case in this study. Consequently, it is essential to take four factors into consideration before starting a survey, that is:
congruency, precision, objectivity and constancy (30). Congruency entails the equivalence between questions intended to measure the same thing. Asking several questions regarding each food category gives a better view on food choices for respective category and enables the research to fulfil congruency. How the participants respond to or fill in the
questionnaires is referred to as precision. With Google Forms, easy and typographical questionnaire where conducted, taking precision into consideration. To obtain objectivity, the collected data was interpreted with consistency for all anonymous responses. In addition to that, the questionnaire where designed so that the responses would not differ over time to attain constancy.
Validity is defined as the degree to which a research measures what it is intended to measure. According to a research discussing validity and reliability in research: “validity evidence is built over time” (22). Using questionnaires that has previously been used in other studies increases the validity of the study. Nevertheless, as far as the author of this study knows, no other questionnaires where available targeting Iraqi immigrants. The questionnaires where therefore created by the author to go on with the food traditions of the studied group and it was examined and accepted by the supervisor.
17 5.2 Result discussion
The results from this study showed that most Iraqi immigrants did not meet the recommendations regarding the frequency of eating fish, choosing keyhole-marked products and choosing wholegrain products. Nevertheless, the majority eats vegetables, include vegetables to all meals, use oil for cooking, do not eat sweets daily and do not add sugar to hot drinks. People living over ten years in Sweden included vegetables to all meals as opposed to people living less than 10 years in Sweden. The result does not reveal the actual intake of food. Still, it reveals tendencies for eating habits among Iraqi
immigrants in relation to NNR. The interpretation of the result is represented below for each food category and concludes with a discussion about differences among the group.
5.2.1 Vegetables and fruit
According to the current nutrition advice, vegetables should preferably be included to each meal to fulfil the recommendation of 500 g fruits and vegetables per day (2). Legumes are also reckoned as vegetables. The amount of vegetables is not exposed, yet overall the result shows that the studied group tend to match the diet recommendations regarding intake of vegetables. Two to three fruits are estimated as moderate daily fruit intake. The median intake of two fruits per day is hence satisfying. However, one fruit a day
represented the lowest score. Including a zero alternative would have generated a different result. Therefore, it is difficult to draw a conclusion concerning fruit intake among this sample. According to a survey (Riksmaten 2010-11), which investigated food habits among the Swedish population, only 17 percent of the population fulfilled the
recommendations of 500 g vegetables and fruits per day (2). Some researchers suggest that immigrants tend to preserve healthy eating habits such as consumption of fruit and vegetables (31). Children with non-boreal background have a higher intake of fruits and vegetables but also a high intake of sweets (32). Moreover, a higher intake of fibres, vitamin C, pyridoxine, vitamin E, folic acid and unsaturated fats compared to their peers.
5.2.2 Fat
The current nutritional advice recommends liquid fats rather than solid fats (2). The majority of responders in the present study strongly agreed that they used oil when cooking. A higher intake of unsaturated fats has been detected among children with non-boreal background (32). This present study confirms that there is a tendency of having good fat quality in the diet among Iraqi immigrants. Still, it does not reveal the amount of fat intake.Fat is energy dense and a high consumption can lead to obesity. Energy dense food in combination with sedentary life-style may explain the high prevalence of obesity among Iraqi immigrants (11). Choosing dairy products with less fat is also advised. Previous studies show that the consumption of dairy products is low among immigrants compared to the rest of the population (32). Children with foreign background have lower intake of vitamin A and vitamin D, calcium and iron. Low intake of dairy product could explain the wide distribution of answers regarding choosing low fat dairy products. Fish intake of two to three times a week is also recommended (2). The results from this present study indicate that the group did not meet the recommendation of fish intakes. The result is in line with previous surveys revealing that only three of ten people in Sweden meet this recommendation (2).
18 5.2.3 Wholegrain
NNR recommends choosing on the first hand whole-grain products, such as bread and grain. It is also advised to choose keyhole- marked products. Food habit survey reveals that nine of ten has an insufficient intake of wholegrain and seven of ten insufficient intakes of fibres (2). Previous studies show that non-boreal immigrants have a higher intake of fibres (33). That could be explained by a higher vegetable and fruit intake but also that the traditional food contains more fibre rich alternatives, such as bulgur, wheat berry, seeds and nuts. The study reveals that the majority choose wholegrain alternatives but there are some within the sample who did not. A Swedish study (bachelor thesis) showed that there is a deficient awareness concerning the meaning of the keyhole symbol among consumers (34). Many people do not know what the symbol stands for. An
explanation to the wide distribution of answers is that people may not know what the keyhole represents. The result in the present study indicates that there is space for
improvement regarding the intake of wholegrain and choosing keyhole-marked products.
5.2.4 Sugar
NNR recommends a restriction of sugar and sugar-containing food (2). People are advised to avoid eating sweets on a daily basis and limit sweets to once a week. The results
regarding sweets and sugar consumption contradict previous studies (31, 32). Immigrants tend to have a higher intake of sugar containing food and drinks compared to the rest of the population. However, the results do not show the actual frequency of eating sweets per week. Overall, the outcome shows that the majority do not eat sweets daily. The
background of the studied sample constitutes of mainly high-educated people, which could be the reason. The majority does not add sugar to hot drinks but some people within the group strongly agreed with this statement. The maximum intake of juice should not exceed one cup per day. In the present study, very few drank more than one cup of juice per day.
5.2.5 Differences within the group
The only significant difference found among the studied group was that individuals who have lived for a longer time in Sweden tend to include vegetables to most of their meals. Otherwise, no other differences were detected. The Swedish National Board of Health and
Welfare suggest that it takes at least 10 years for people after migration to enjoy living
conditions that are equal to the rest of the population (3). The division of years living in Sweden where therefore based on that. It is worth to discuss the representativeness of the sample included in this study. Most of the participants who has been living less than ten years in Sweden had high education and were young. That could explain why no
significant differences where shown when comparing years living in Sweden. The studied group as discussed earlier consists mostly of academics. It has been proven that high educated people has better eating patterns (35). Using online-questionnaires to gather data attracted mainly this group. For that reason, the results do not show the whole truth about Iraqi immigrant’s food choices. Something that may also affect the results is age
differences between the sexes, most of the females where young and most of the males where old. The compared samples are thus different which affect the results. Nevertheless, the results may also indicate that there is an increased awareness and interest concerning healthy diet among this population. Many respondents commented in the questionnaire that they tried to avoid unhealthy food and choose healthy alternatives. It is also worth to mention that immigrants, in this case Iraqis are not a homogenic group. Education level and socioeconomic status effect on food choices has been previously discussed (5). Even
19 within minorities, there are differences that should be addressed and considered when investigating food choices.
Some studies claim that immigrants preserve good dietary habits and some claim that they embrace inferior more “westernized” dietary habits (29). Although the result from the present study shows tendencies of higher intake of mainly unsaturated fats, vegetables and fibers it does not reveal the energy intake, neither the amount nor frequency of food intake. Low physical activity in combination with huge availability of food and high-energy intake gradually lead to obesity. The most contributing risk factors for diabetes type 2 among Iraqi immigrants is obesity and heredity (11). A combination of both conduct five times more risk for earlier development of diabetes. Migration and a more stressful life-style may also explain the high prevalence of diabetes among immigrants. Questions about physical activity, lifestyle, weight, Body Mass Index are suggested for upcoming studies to highlight aspects of interest concerning food habits among Iraqis.
5.4 Social Relevance
It has been previously proposed that obesity is the main reason for the explicit insulin resistant among Iraqi immigrants (11). Heredity for diabetes has also been emphasized with a high occurrence among Iraqis compared to the rest of the population. Hence, early arrangement to catch pre-diabetics and munificence controls for HbA1c and glucose among this group is of great value to inhibit the development of the disease. Decreasing the risk for developing diabetes would also be beneficial to prevent cardiovascular diseases.
Awareness within healthcare regarding high-risk groups is essential to prevent life-style related diseases and reduce healthcare costs in future (11). Prevention arrangements should be allocated in relation to the need of healthcare, mainly in exposed areas such as immigrant dense places. The requisites of attendance should not only be observed when having a diagnosis. Adjusted programs and interventions on a political level are necessary to support health among vulnerable groups. Emphasis should be on energy intake, portion size, eating frequency and physical activity and not only food choices. Dispersal of information regarding healthy eating habits (such as NNR) in native language would increase knowledge about healthy food among this group. The high participation rate in the present study may indicate that receiving questionnaires in native language increases the chances of responding. People feel more connected and it may be easier to assimilate information. There are translated materials from the Swedish national food agency in Arabic, but the challenge is to forward the information further. Healthcare professionals have an important role to spread information and guide to proper sources of information that are in accordance to NNR. Specific traditional food and specific eating habits would preferably be considered when establishing recommendations targeting minorities. Offering easy, adjusted and pedagogical material in native language facilitate
communication with language barriers. Proposing other alternatives in primary care such as health promoting courses that are specially designed for high-risk groups would not only enable a better understanding of healthy life-style but also motivate individuals to achieve better health. Lifestyle intervention targeting high-risk groups has better
protective effect than pharmacological treatment (36).Increasing knowledge about healthy food, identifying high-risk groups and offering adjusted arrangements by healthcare professionals raises the quality of health care. Developing adjusted preventive intervention would decline inequalities in health and enable healthcare with equal terms for high-risk patients.
20 5.3 Conclusions
There is room for improvement regarding food choices among Iraqi immigrants, particularly considering the frequency of eating fish per week, choosing low fat dairy products, keyhole- marked products and wholegrain alternatives. It appears that the majority avoids eating sweets daily as well as adding sugar to hot drinks. The majority eats vegetables and includes vegetables to all meals. In general, there are no differences in food choices between female and male, different age groups, individuals living less than ten years in Sweden and individuals living over ten years in Sweden and education level among Iraqi immigrant’s resident in Sweden. The study confirms that
online-questionnaires attract mainly high-educated people. The outcomes from this study are thus more characteristic for high-educated Iraqi immigrants. It is consequently difficult to draw conclusions that are representative for all Iraqi immigrant’s resident in Sweden.
21 6. REFERENCES
1. Fogelholm, M. New Nordic Nutrition Recommendations are here. Food Nutr Res. 2013; 5
2. Nordic Council of Ministers. Nutrition Recommendations 2012 [Internet]: integrating nutrition and physical activity . Copenhagen: Nordic Council of Ministers; 2014. 5th edition.; 627 s. [Cited date: 23 april 2018]. Available from:
https://www.livsmedelsverket.se/globalassets/matvanor-halsa-miljo/naringsrekommendationer/nordic-nutrition-recommendations-2012.pdf 3. Hjerns A. Migration and public health. Health in Sweden: The national Public
Health Report 2012. Scan J Public Health, 2012; 40 (Suppl 9): 255-267.
4. Statistiska Centralbyrå. Från massutvandring till rekord invandring. Stockholm: SCB; 2017 [Cited date: 23 april 2018]. Available from: https://www.scb.se/hitta-statistik/sverige-i-siffror/manniskorna-i-sverige/in-och-utvandring/
5. Magnusson M B, Hulthén L, Kjellgren, K I. Obesity, dietary pattern and physical activity among children in a suburb with a high proportion of immigrants. Journal of Human Nutrition and Dietetics. 2005;18:187–194.
6. Gadd M., Johansson SE., Sundquist J., Wändell P. Morbidity in cardiovascular diseases in immigrants in Sweden. J Intern Med. 2003;254(3):236–243.
7. Wändell PE, Hjörleifsdóttir SK, Johansson SE. Diabetes among Turkish immigrants in Sweden: a study of prevalence and risk factors [thesis on the internet]. Stockholm: Karolinska Institutet; 2013 [Cited date: 23 april 2018]. Available from:
https://openarchive.ki.se/xmlui/bitstream/handle/10616/41592/Kappa%20Hj%c3% b6rleifsdottir%20Steiner.pdf?sequence=1&isAllowed=y
8. Gilbert PA, Khokhar S. Changing dietary habits of ethnic groups in Europe and implications for health, Nutr Rev. 2008;66(4):203–215.
9. Kohinor MJ, Stronks K, Nicolaou M, Haafkens, J A. Considerations affecting dietary behaviour of immigrants with type 2 diabetes: a qualitative study among Surinamese in the Netherlands. Ethn & Health. 2011 Jun;16(3): 245-58.
10. Terragni L, Garnweidner LM, Pettersen KS, Mosdøl A. Migration as a Turning Point in Food Habits: The Early Phase of Dietary Acculturation among Women from South Asian, African, and Middle Eastern Countries Living in Norway. Ecol Food Nutr. 2014; 53 (3): 273-91.
11. Bennet, L, Stenkula K, Cushman, S W, Brismar K. BMI and waist circumference cut-offs for corresponding levels of insulin sensitivity in a Middle Eastern
22 immigrant versus a native Swedish population – the MEDIM population based study. BMC Public Health, 2016;16(1): 1242.
12. Vallianatos H, Raine K. Consuming Food and Constructing Identities among Arabic and South Asian Immigrant Women. Food, Culture & Society. 2008; 11 (3): 355-373.
13. Lecerof SS, Westerling R, Moghaddassi M, Östergren PO. Health information for migrants: the role of educational level in prevention of overweight. Scand J Public Health. 2011; 39(2): 172-8.
14. Sundquist K, Li J. Coronary heart disease risks in first- and second-generation immigrants in Sweden: a follow-up study. Intern Med. 2006; 259(4): 418–427. 15. Allen E, Seaman C A. Likert Scales and Data Analyses. Quality Progress, 2007; 40
(7): 64-65.
16. Sadler G R. Recruiting hard-to-reach United States population sub-groups via adaptations of snowball sampling strategy. Nursing & Health Sciences. 2010: 12(3), 369–374.
17. Pallant J. SPSS survival manual: A step by step guide to data analysis using SPSS. Maidenhead: Open University Press/McGrawHill. 2010.
18. World Medical A. World Medical Association. World Medical Association Declaration of Helsinki: ethical principles for medical research involving human subjects. JAMA, 2013; 310:2191–4.
19. Brinkmann S, Kvale S. Den kvalitativa forskningsintervjun. Lund: studentlitteratur AB; 2009.
20. Sharkey S, Jones R, Smithson J, et al. Ethical practice in internet research involving vulnerable people: lessons from a self-harm discussion forum study (SharpTalk) Journal of Medical Ethics 2011;37: 752-758.
21. Kevin BW. Researching Internet-Based Populations: Advantages and Disadvantages of Online Survey Research, Online Questionnaire Authoring Software Packages, and Web Survey Services. JCMC. 2005; (10) 3,1. 22. Kimberlin CL, Winterstein AG. Validity and reliability of measurement
instruments used in research. Am J Health Syst Pharm 2008; 65:2276–2284.
23. Coelho, P and Esteves S. The choice between a five-point and a ten- point scale in the framework of customer satisfaction measurement, International Journal of Market Research. 2007;49(3): 313-339.
24. Dahmström K. Från datainsamling till rapport: Att göra en statistisk undersökning, Sverige: Studentlitteratur AB; 2005.
23 25. Dillman, Don A. Mail and Internet Surveys, second edition, New Jersey: John
Wiley & Sons, Inc. 2007.
26. Lozar Manfreda K, Vehovar V. Do mail and web surveys provide the same results? In A. Ferligov & A. Mrvar (Eds.), Development in social science methodology. Ljubljana, Slovenia: Metodoloski zvezki. 2002; 18: 149-169.
27. Statistiska centralbyrån. Privatpersoners användning av datorer och internet. Stockholm. SCB: 2016. (Cited date: 23 april 2018) Available from:
https://www.scb.se/Statistik/_Publikationer/LE0108_2016A01_BR_00_IT01BR160 1.pdf
28. Dillman DA. Internet, mail and mixed method surveys. Third edition. New York: John Wiley & Sons, Inc ; 2009.
29. Kukull WA, Ganguli M. Generalizability: The trees, the forest, and the low-hanging fruit. Neurology. 2012; 78(23), 1886–1891.
30. Trost, J. Enkät-boken. Fjärde upplaga. Lund: Studentlitteratur AB; 2012.
31. Wändell P. Population groups in dietary transition. Food Nutr Res. 2013;57:21668
32. Mattison Irene. Socioekonomiska skillnader i matvanor i Sverige.
Livsmedelsverket; 2016. Rapportserie nr 9. (Cited date: 23 april 2018); Available from: https://www.livsmedelsverket.se/globalassets/rapporter/2016/rapport-9-omslag--inlaga--bilaga.pdf
33. Folkhälsorapport. Migration och hälsa. Socialstyrelsen: 2009. 374. (Cited date: 23 april 2018); Available from: http://www.socialstyrelsen.se/publikationer2009/2009-126-71/Documents/13_Migration.pdf
34. Cedenheim A, Wessling J. [bachelor thesis from internet]. Uppsala: Uppsala University; 2013. (Cited date: 23 april 2018); Available from: https://uu.diva-portal.org/smash/get/diva2:641069/FULLTEXT01.pdf
35. Irala-Estévez JD, Groth M, Johansson L, et al. A systematic review of socio-economic differences in food. Eur J Clin Nutr. 2000 Sep; 54(9):706-14
36. Knowler WC, Barrett-Connor E, Fowler SE, et al. Diabetes Prevention Program Research Group. Reduction in the incidence of type 2 diabetes with lifestyle intervention or metformin. N Engl J Med. 2002;346(6):393-403
Appendix 1
(1/1)An online-questionnaire where created with Google Forms in Arabic. The survey where sectioned into two parts with totally 41 questions. It begins with an introduction informing about the study purpose and confidentiality. The first part contains of 8 multiple-choice questions about the respondent background such as: gender, age, and years living in Sweden and educational level. Some questions involve an alternative with a possibility to write a comment. The second part explores food choices and consists mainly of statements with a 10-point Likert scale.
The second part in the survey where divided into 5 categories: vegetables, fruits, wholegrain/fibre, fat, and sugar. Every segment comprises relevant questions for each food-category.
Questions of interest regarding traditional food, commonly used food and food habits where also included. Three multiple-choice questions where involved concerning specific food-choices such as: dates, nuts and NIDO-milk. Part two consist of 29 questions with Likert scales and conclude with an open question to enable further comments about food habits.
To decrease the risk of misconceptions in interpreting questions and for better validity, open-ended questions where avoided.
The questions about the respondent background where based on previous literature regarding factors that may affects food choices. Questions about food choices and attitudes where based on NNR and the author’s own knowledge and experience of Iraqi food culture.
(1/4)
Appendix 2
Food habits - Questionnaire
The study aims at investigating food choices and underlying factors that might influence food choices among Iraqi immigrants in Sweden. The questioner is voluntary, anonymous and takes approximately 5 minutes to answer. To participate you need to be older than 15 years of age and have an Iraqi background. The data will be used for a Master thesis performed at the University of Umeå. Your answers are valuable. Thank you for participating!
Best regards Sheima Al-Adili
For questions regarding the thesis or the questionnaire you can reach me by mail: shsa0011@umu.se
Supervisor: Elisabeth Stoltz Sjöström, PhD, Reg. Dietitian e-mail: elisabeth.stoltz.sjostrom@umu.se
Background
Gender:
1. Male 2. Female
Age (in years): How many persons
(including you) live in your household (in numbers)? How many years have you been living in Sweden (in numbers)??
Which one of these alternatives is equivalent to your highest education?
1. Elementary school 2. Secondary high school 3. Higher education/ University 4. No education
Which one of these alternatives is equivalent to your current occupation?
1. I work
2. I am a student 3. I am looking for a job 4. I am on parental leave
5. I work at home (caring for family, managing
household affairs, and doing housework) Other: ………
What kind of food do you normally eat?
1. All kinds of food (from west and east) 2. Vegetarian
3. Traditional Iraqi food
(2/4)
Appendix 2
Food choice
Mark on the scale what best matches your statement regarding vegetables (for example: root vegetables, leafy vegetables, legumes)
I eat vegetables
I always include vegetables to my meals I eat legumes
I eat legumes several times a week
Mark on the scale what best matches your statement regarding fruits. (For example: fresh fruits like banana, apple, pomegranate, and pear. Berry´s like strawberry, raspberry and blueberry, frozen or fresh).
(3/4)
Appendix 2
How many (fresh or frozen) fruits do you eat per day (2 dl
berry´s is equivalent to one fruit) -1 -2 -3 -4 -5 -6 or more
I eat dry-fruit (ex peach, raisins) several times a week I eat dates
How many dates do you eat per week?
I eat less than 10 dates a week I eat less than 20 dates a week I eat more than 20 dates a week
Mark on the scale what best matches your statement regarding fat.
I use oil (ex rapeseed oil) when I cook food
I choose dairy products with less fat (light milk, yoghurt, cheese, margarine)
I use a lot of fat (over 2 spoons) when I cook food
I add extra fat to food after cooking (ex. rise/thrid bagele) I try to remove the visible fat from red meat
I eat fish
I eat fish 2-3 times a week
I eat fried food several times a week I use NIDO-milk
I use NIDO-milk
I use NIDO-milk when preparing the food I serve NIDO-milk to other family members I serve NIDO-milk to all the children in my family
I often eat nuts
How much nuts do you eat per week in cups?
I eat less than 2 cups a week I eat more than 5 cups a week I eat more than 10 cups a week
(3/4)
Appendix 2
I add sugar to cold drinks (like juice)
I drink more than 1 cup juice/day
I drink soda
I drink soda to my meals How much soda do you drink per week?
I drink less than 2 litre I drink more than 2 litre I drink more than 5 litre
Whole grain food contains whole unprocessed grains that are rich in fibre. Mark on the scale what best matches your statement regarding fibre (For example: wholegrain pasta, bulgur, rise or bread)
I choose whole-grain products I choose wholegrain bread with seeds
I choose products that are marked with a key hole
Mark on the scale what best matches your statement regarding sugar. (Including brown, raw and white sugar and syrup)
I eat something sweet (cookies, candy, chocolate, baklava) everyday
I often use honey as an alternative to sugar I add sugar to hot drinks (like tea/coffee)