of Dilute Viscoelastic Fibre Suspensions
Yvonne Aitom¨aki and Torbj¨orn L¨ofqvist
Abstract
A model of attenuation of ultrasound in fibre suspensions is compared to a model of backscattering pressure from submersed cylinders subjected to a sound wave. This analysis is carried out in the region where the wavelength is of the same order as that of the diameter of the fibre. In addition we assume the cylinder scatterer to have no intrinsic attenuation and the longitudinal axis of the scatterer is assumed to be perpendicular to the direction of propagation of the incident wave. Peaks in the frequency response of both the backscattering pressure, expressed in the form of a form function, and the attenuation are shown to correspond. Similarities between the models are discussed. Since the peaks in the form function are due to resonance of the cylinder, we infer that the peaks in the attenuation are also due to resonance. The exact nature of the waves causing the resonance are still unclear however the first resonance peaks are related to the shear wave and hence the shear modulus of the material. The aim is to use the attenuation model for solving the inverse problem of calculating paper pulp material properties from attenuation measurements. The implications of these findings for paper pulp property estimation is that the supporting fluid could, if possible, be matched to density of that of pulp fibres and that the estimation of material properties should be improved by selecting a frequency range that in the region of the first resonance peaks.
1
Introduction
This study is part of a project aimed at the on-line characterisation of pulp fibres sus-pended in water, as used in the paper manufacturing industry. An analytical model was developed to relate ultrasound attenuation to the material properties of the fibre and the supporting fluid. This model was presented in [1]. This has then been used this to solve the inverse problem of estimating material properties from measurements of ultrasonic attenuation in dilute suspensions of viscoelastic fibres [2].
Experiments from these studies showed local peaks in the frequency response of the attenuation [1, 2]. The focus of the study is on the cause of these peaks. A large body of work exists on attenuation due to suspended spherical particles, as reviewed in [3]. However, for cylindrical scatterers, much of the work has been based on backscattering and in the regime where the ratio of the wavelength to the diameter of the scatterer is small [4–9]. One of the theories arising from these works is the Resonance Scattering Theory (RST) [5]. This study compares the backscattering from theory developed for a
submersed cylinder [10] to a model of ultrasonic attenuation in a suspension of fibres in a fluid [1]. The theory developed by [10] is essentially the same as the nuclear scattering theory introduced in the derivation of the RST theory [5]. In this study we will use the rewritten version of [10] found in [11] since this matches the propagation direction of the wave used in the attenuation model.
Once a comparison of the resonance peaks is made, the explanation for the peaks in the backscattering is investigated to see if it is valid for the peaks found in the attenuation.
2
Theory
The attenuation is calculated from the simple cylinder scattering, (SCS), model [1]. The derivation of this model follows Habeger [12] cylindrical extension of the Epstein and Carhart [13]/Allegra Hawley [14] model. The resulting expression for the attenuation, α, of a suspension of fibres in a fluid of low viscosity, such as water is
α = −2fr πR2kℜ ! " π2 0 (ϵ2nBn) cos(ψ)dψ # , (1)
where fr is the volume fraction; R is the radius of the fibre; k is the wave number of
the wave in water; ψ is the angle of the fibre to the direction of the oncoming plane ultrasound wave; ϵn = 1, if n = 0, otherwise ϵn = 2, and n is a positive integer. Bn are
the nth expansion coefficients of the wave potential of the reflected wave. The coefficients,
Bn, are a function of the fluid properties: viscosity, density and speed of the compression
wave and the fibre properties: shear modulus, density, loss tangent and speed of both the compression and the shear wave. The speed of the shear wave is a function of the shear modulus and the density and is related to the compression wave speed by Poisson’s ratio.
For the purpose of the comparison between the attenuation and backscattering we assume that the axial plane of the fibres is perpendicular to the direction of propagation of the wave. Since we are focusing on the frequency at which the peaks occur we also assume that there is no intrinsic attenuation in the cylinder. This is done by setting the loss tangent to zero.
The expression for backscattering pressure from a cylinder at a large distance from the cylinder is Ps≈ $ 2a 2re ikrf ∞(π) (2)
where Ps is the scattering pressure; a is the size of the scatterer and in this case equals
R; r is the distance to the scatterer centre, k is the wave number of the wave in the fluid and f∞(π) is the form function [5, 10].
The form function can be expressed using a phase shift expression, where the phase shift is that between the incident and reflected wave such that:
f∞(π) = 2 √ πka ∞ % n=0 (−1)nϵnsin(ηn)e −i(ηn+3π4) (3)
where ηn is the phase shift [11] and is defined as,
ηn = arctan
&
tan δn(ka)
tan αn(ka) + tan φn(kLa, kTa)
tan βn(ka) + tan φn(kLa, kTa)
'
(4) The following functions were used in the above equation:
tan αn(x) = −xJ ′ n(x) Jn(x), (5) tan βn(x) = −xN ′ n(x) Nn(x), (6) tan δn(x) = −xNJn(x) n(x), (7) tan φn(kLa, kTa) = ρ1(kTa)2 2ρ2 × tan αn(kLa) tan αn(kLa) + 1 − n2 n2− (kTa) 2 2 + tan αn(kTa) n2− (kTa)2 2 + tan αn(kLa) tan αn(kLa) + 1 − n2· (tan α n(kTa) + 1) n2− (kTa) 2 2 + tan αn(kTa) . (8) Here, ρ1 is the density of the water; ρ2 is the density of the solid, kT is the wave number
of the shear wave in the solid; kLis the wave number of the compression wave in the solid
and n is a positive integer. Jn and Nn are Bessel function of the 1st kind and 2nd kind
respectively, to the order n and J′
n and N ′
n are the derivatives of the Bessel functions of
the 1st kind and 2nd kind respectively, to the order n.
The frequency range is expressed in terms of normalised frequency Fn = ka, and we
consider the range Fn from 0.2 to 5. The series expansion is truncated after eleven terms.
3
Results
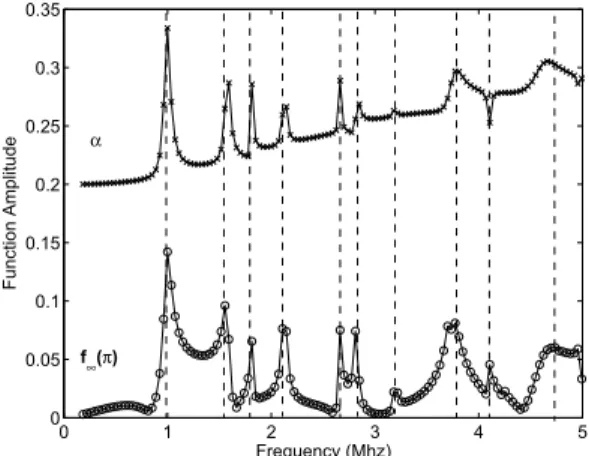
The parameters in the models are set based on the material properties of Nylon 66 and water. However, as previously stated we are focusing on the frequency at which the peaks occur, so the loss tangent of the cylinder material is set to zero. To ease the comparison between the peaks in both backscattering and the attenuation, the amplitude of the attenuation is scaled and offset by 2 units. The results are presented in Figure 1.
Under these conditions there is a good match between the backscattering form func-tion, f∞(π) and the attenuation, α. The match between these two functions has two
0 1 2 3 4 5 0 0.05 0.1 0.15 0.2 0.25 0.3 0.35 Frequency (Mhz) Function Amplitude α f∞(π)
Figure 1: Plot of the acoustic attenuation, α, and the form function, f∞(π), against normalised
frequency for nylon fibres suspended in water. To ease the comparison between the peaks in both functions, the amplitude of the attenuation is scaled and offset by 2 units.
consequences. Firstly, the solution for the expansion coefficients used by Faran [10] can be used in the calculation of attenuation -equation (2) -instead of the solution for the expansion coefficient used in the attenuation. This results in a simpler solution as that used by Faran [10] uses slip boundary conditions. We can then compare the amplitudes of the attenuation calculated using the two different solutions for the expansion coefficients and hence the effects of the different boundary conditions. Work on this continues.
The second consequence of the match between the form function and the attenuation is that the resonance peaks in the form function have been well discussed, in both [10] and [6]. Faran [10] states that the normal modes of the cylinder are found when the normal component of the stress and the tangential component of the shear stress at the solid boundary are zero gives a condition which is identical to setting the denominator of Equation (8) to zero. Using this condition the normal modes can be calculated from Equation (8). Faran [10] also discusses that a shift in the resonance frequency of an immersed cylinder due to the reactive component of the acoustic impedance acting on the scatterer by the surrounding fluid. Although in his study this shift was small as the metal cylinders that were used had much greater densities than the surrounding fluid, in our case, where the density of nylon is close to that of water, the effect will be considerable. When calculating the normal mode for nylon, the first mode occurs at a normalised frequency of 1.4 (R = 44 µm, 7.8 MHz), however, the effect of the surrounding fluid moves this peak to a normalised frequency of 1.0 (R = 44 µm, 5.3 MHz). The frequency can be found by setting the denominator in equation 4 to zero. Also discussed is the fact that the since the speed of the shear waves is much lower than the speed of the compression wave. The first modes to appear are from the shear wave. Since the n = 0 does not support shear waves, the frequency of this mode depends on the speed of the wave and hence occurs at a normalised frequency of 3.57 (R = 44 µm, 19.3 MHz). These calculations are for a cylinder with no loss.
Resonances in backscattering are explained as being caused by creeping waves in the fluid and in the solid [6]. However, the assumption used in these explanations is that the normalised frequency is much greater than 1, which is not the case here. Hence the actual wave propagation modes in this region of normalised frequency are still not clear.
4
Conclusion
From the results so far it appears that the coefficient derived by Faran [10] for backscat-tering can be used to derive attenuation. From this model, the resonance modes of a cylinder and a cylinder in water can be obtained. They confirm that the peaks in the attenuation curves are due to resonance. It appears as if the shear waves are causing first peaks in the ultrasound attenuation although the exact nature of these waves has not been established. These calculations have been done under the conditions of no loss. The implication of these findings for the use of estimating material properties of paper pulp from ultrasound attenuation are that, if possible, the density of the surrounding fluid should be as close as possible to that of the suspended fibre. This increases the phase shift in the suspension and increases the dependency of the attenuation on the material properties of the fibre. The frequency range should also be set, if possible, so that resonance peaks exists within the range. Since the frequencies of the peaks depend on the material properties of the fibre, identifying these frequencies should aid in estimating material properties.
References
[1] Y. Aitom¨aki and T. L¨ofqvist, “Estimating suspended fibre material properties by modelling ultrasound attenuation,” in Mathematical modeling of wave phenomena: 2nd Conference on Mathematical Modeling of Wave Phenomena, B. Nilsson and L. Fishman, Eds., vol. 834:1. AIP, 2006, pp. 250–259.
[2] Y. Aitom¨aki, “Towards a measurement of paper pulp quality: ultrasonic spec-troscopy of fibre suspensions,” Licentiate Thesis, Luleøa University of Technology, 2005.
[3] R. Challis, M. Povey, M. Mather, and A. Holmes, “Ultrasound techniques for charac-terizing colliodal dispersions,” Reports in Progress in Physics, vol. 68, pp. 1541–1637, 2005.
[4] H. Uberall, G. Gaunaurd, and J. Diarmuid Murphy, “Acoustic surface wave pulses and the ringing of resonances,” Journal of the Acoustical Society of America, vol. 72, no. 3, pp. 1014–1017, Sept 1982.
[5] J. Diarmuid-Murphy, J. George, A. Nagl, and H. Uberall, “Isolation of the resonant component in acoustic scattering from fluid-loaded elastic spherical shells,” Journal of the Acoustical Society of America, vol. 65, no. 2, pp. 368–373, Feb 1979.
[6] L. Flax, L. Dragonette, and H. Uberall, “Theory of elastic resonance excitation by sound scattering,” Journal of the Acoustical Society of America, vol. 63, no. 3, pp. 723–730, Mar 1978.
[7] H. Uberall, L. Dragonette, and L. Flax, “Relation between the creeping waves and the normal modes of vibration of a curved body,” Journal of the Acoustical Society of America, vol. 61, no. 3, pp. 711–715, Mar 1977.
[8] J. Dickey, G. Frisk, and H. Uberall, “Whispering gallery wave modes on elastic cylinders,” Journal of the Acoustical Society of America, vol. 59, no. 6, pp. 1339– 1346, June 1976.
[9] G. Frisk, J. Dickey, and H. Uberall, “Surface wave modes on elastic cylinders,” Journal of the Acoustical Society of America, vol. 58, no. 5, pp. 996–1008, Nov 1975. [10] J. Faran, “Sound scattering by solid cylinders and spheres,” Journal of the Acoustical
Society of America, vol. 23, no. 4, pp. 405–418, July 1951.
[11] J. Mathieu and P. Schweitzer, “Measurement of liquid density by ultrasound backscattering analysis,” Meausurement Science and Technology, vol. 15, pp. 869– 876, 2004.
[12] C. Habeger, “The attenuation of ultrsound in dilute polymeric fiber suspensions,” Journal of Acoustical Society of America, vol. 72, pp. 870–878, sep 1982.
[13] P. Epstein and R. Carhart, “The absorption of sound in suspensions and emulsions. i. water fog in air,” The Journal of the Acoustical Society of America, vol. 25, no. 3, pp. 553–565, May 1953.
[14] J. Allegra and S. Hawley, “Attenation of sound in suspension and emulsions: Theory and experiments,” The Journal of the Acoustical Society of America, vol. 51, no. 5, pp. 1545–1564, 2 1972.