1
Department of Molecular Sciences; Bioenergy
The gut microbiota and its relationship with
obese children
Isabella Aryee
Independent project in Biology • 30 credits
Molecular Sciences, 2019:25 Uppsala, 2019
2 The gut microbiota and its relationship with obese children
Isabella Aryee
Supervisor: Anna Schnürer,Swedish university of Agricultural,Department of Molecular Sciences
Assistant supervisor: Simon Isaksson, Swedish university of Agricultural, Department of Molecular Sciences
Examiner: Hans Jonsson, Swedish university of Agricultural, Department of Molecular Sciences
Credits: 30 credits
Level: A2E
Course title: Independent project in Biology
Course code: EX0895
Course coordinating department: Department of Molecular Science Place of publication: Uppsala
Year of publication: 2019
Title of series: Molecular Sciences
Part number: 2019:25
Online publication: https://stud.epsilon.slu.se
Keywords: Childhood obesity, gut microbiota, methanogens, Methanobacteriales
Swedish University of Agricultural Sciences
Faculty of Natural Resources and Agricultural Siences Department of Molecular Sciences
3
TABLE OF CONTENTS
INTRODUCTION 4 ABSTRACT 4 POPULÄRVETENSKAP 5 BACKGROUND 6 THE GUT MICROBIOTA 7 METHANOGENS 8METHANOGENS POSITIVE AND NEGATIVE HEALTH FACTORS 9
OBESITY AND METHANOGENS 10
FACTORS INFLUENCING LEVELS OF METHANOGENS 10
HYPOTHESIS 10
METHODS 11
STUDY SET-UP 11
DESIGN OF THE STUDY, CRITERIA OF THE STUDY PARTICIPANTS, ETHICAL REVIEW 11
FAECAL SAMPLES 12
ANTHROPOMETRY 12
FAECAL SAMPLES PERFORMED IN PREVIOUS STUDIES OF IMPORTANCE FOR PRESENT WORK 12
REAL-TIME QUANTITATIVE PCR 13 RESULTS 14 PARTICIPANTS 14 METHANOGENS 15 BACTERIA’S AND SCFA 16 DISCUSSION 18 GUT MICROBIOTA 18 METHANOGENS 18 SCFA 20 BACTERIA 21 SUMMERY 22
STRENGTH AND LIMITATIONS 22
CONCLUDING REMARKS 23
ACKNOWLEDGEMENT 23
4
Abstract
Background: It’s decelerated that childhood obesity is a global epidemic since 21st
century. General obesity has doubled since 1980 and comes with a distinct increase of mobility and mortality. Obesity also correlate with future consequences in form of different diseases such as metabolic syndrome, cancer and increased risk of chronic diseases and not to mention the increased cost for the society. The condition is undoubtable multifactored and the precise mechanism behind are still incomplete. Previous studies have suggested an indirect pathogenicity of methanogens,
favouring other microbes’ growth and in that way correlate in obesity. In this work the aim was to further investigate this possible correlation by analysing levels of
methanogens in obsese and lean children. The analysis was made directly in faecal samples and after incubation of feaces in a nutrient solution. The hypothesis was that a small but important difference in methanogenic levels between lean and obese children exist but might be too low to be statistically proven and that an incubation allowing growth of the methanogens would ease the detection and result in a stronger signal.
Methods: The participants in the study was assigned to lean- or obese group
depending on S-BMI, a total of 29 participants. Faecal samples and anthropometrical data were collected from the two groups. Levels of methanogens in feaces, non-incubated and after 48h anaerobic incubation in a nutrient solution, was determined by quantitative PCR targeting the 16S-ribosomal RNA. Methanogen groups included
in the analysis was Methanobacteriales (MBT), Methanosaetaceae (MST), Methanosarcinaceae (MSC) and Methanomicrobiales (MMB).
Results and conclusion: The results showed a general low abundance of methanogen quantification in the different groups, except for the MBT group. The abundance of MSC, MMB and MST were at the point for detection, making the results quite uncertain. MBT however, were well detected and specific for its selected primers. Furthermore, a correlation between BMI and MBT was significantly lower in the obese group compared to the lean group in the non-incubated samples, and an even greater significance was seen in the incubated samples. The incubation aspect is unique for this study and according to hypothesis highlighted a significant
5 correlation between levels of MBT and BMI. Further studies are needed to
understand the importance of methanogens and their activity on effects of diet and obesity in childhood.
Keywords: Childhood obesity, gut microbiota, methanogens, Methanobrevibacter (MBT)
Populärvetenskaplig sammanfattning
Mag-tarmkanalens mående speglar ofta människans hälsa i stort. Koppling mellan tarmflorans komposition och övervikt har i djur- och humana studier visat sig ha en korrelation och forskning pågår just nu avsevärt för att försöka kartlägga
sjukdomssamband, maghälsa och tarmflorans inflytande i människans liv. Övervikt är något som ökar runt om i värden och har lett till ett folkhälsoproblem. I denna studie undersöks specifikt övervikt i ung ålder då detta leder till en markant ökad risk för övervikt även i vuxen ålder. Detta indirekt ökar risken till följdsjukdomar som till exempel kroniska tillstånd och metabola syndromet (övervikt och diabetes). Det metalbolasyndromet har bland annat visat sig öka risken för hjärtinfarkt fem gånger jämfört med normalindividen, varför övervikt i unga år är av stor vikt att bekämpa. Övervikt och vem som drabbas har flera orsaker och kartläggningen till dessa mekanismer är fortfarande inte helt klart. Som tidigare nämnt fokuseras mycket forskning inom området på kopplingen mellan övervikt och tarmfloras
sammansättning och aktivitet, där bland annat metanogener, olika bakterier samt kortkedjade fettsyror (mikrobiella nedbrytningsprodukter) visat sig ha en korrelation till övervikt. Metanogener producerar metan ifrån väte som frigörs tillsammans med kortkedjade fettsyrorna när olika bakterier fermenterar (bryter ner) kolhydrater. I två tidigare associerade studier gjorda på samma deltagare fann man en ökad nivå av propionat i överviktiga jämfört med normalviktiga barn men ingen tydlig koppling till sammansättningen av olika bakterier. I denna studie kompletteras dessa studier men en analys av metanogener, för att undersöka dessa mikroorganismers potentiella korrelation till övervikt hos barn. Insamling av material i from av avföringsprover och kroppsmätningar ifrån deltagarna samlades in. Där det olika metanogena grupperna sedan mättes i avföringsproverna. En av de metanogena grupperna, som fanns i högst nivå, undersöktes också efter det att mikroorganismerna i avföringsproverna fått växa till sig i en i näringslösning, detta för att få ett mått på individuell potentiell
6 tillväxt av metanogener och för att tydligare kunna identifiera eventuella kopplingar mellan dessa, nivåer och fettsyror och övervikt. Resultaten visade en signifikant skillnad i nivåerna av en specifik metanogen grupp, Methanobacteriales (MBT) hos överviktiga jämfört med normalviktiga barn, men en lägre nivå in de förra. En positiv korrelation fanns också mellan nivåerna av fettsyror och samma metanogen. Denna studie var unik då den studerade tarmflorans sammansättning efter tillväxt i
näringslösning, som visade sig ge en större åtskillnad mellan den överviktiga och normalviktiga gruppen. Dock krävs det mer forskning för att slutgiltigt bevisa att halten av metanogener är en riskfaktor för övervikt.
Nyckelord: Övervikt hos barn, tarmflora, metanogener, Methanobrevibacter (MBT)
Background
Since the beginning of 21st century the world health organization (WHO) declared an
increase in overweight among children as a global epidemic, especially in economy developed countries around the world (Spruijt-Metz. 2011). An excess of body fat can be a general definition of obesity, but there is no clear threshold for the amount of fat that is normal and abnormal (Cole et al., 2000). Furthermore, to measure bodyfat in general are complicated and expensive why an adjustment for height are taking place and obesity are then defined as an excess of weight after this adjustment. The body mass index (BMI) is an equation of bodyweight (kg) divided to the persons height (m)2. Definition of overweight and obesity in adults are 25 kg/m2 and 30 kg/m2
respectively. However, in children due to a natural continuing changing in body mass and growing, a standard BMI (S-BMI) are being used and are corelated to the
children’s age and gender for evaluation the child’s status. BMI over 25 kg/m2 has
been linked to heath distractions, such as for example hypertension and increased cholesterol (Fredamn et al., 1999) as well as typ ll diabetes (Pinhas-Hamiel,. 1996), non-alcoholic fatty liver, the metabolic syndrome, polycystic ovarian syndrome and increased risk for lifelong chronic diseases (Cruz et al,. 2005), not to forget
colorectal-, breast- and kidney cancer (Calle et al,. 2004), just to mention a few. The reason to increased obesity worldwide are many but two key factors seems to be the most important, which is easy excess to food with high energy density and decreased activity in daily life (Prentice et al., 2003). This leads to an increase in energy storage
7 as fat tissue, due to increased energy in- and decreased energy out, leading to an energy unbalance and fat gain. Studies have also shown a distinct risk for being overweight as an adult if overweight as a youth, which conclude a lifespan treat already in a young age (Singh et al., 2008). Obesity in childhood and adolescent also comes with a cost for the society (Finkelstein et al., 2009). Compare to a normal weighted person the cost for an obese individual is a 42% higher medical spending per capita (US), which corresponds to the total health cost for problematic alcohol drinking or smoking (Strum., 2002). This in conclusion shows a very high public heath priority for preventing, treating and understanding obesity in children and adolescent (Koplan., et al 2005).
The gut microbiota
Humans are no exceptions when it comes to surrounding microbes and its
association in all multicellular organism (Neish., 2008). The microbiota is coexisting microorganisms such as bacteria’s, viruses, unicellular eukaryotes and archaea living in harmony with their host. The intestinal tract consists of up to 100 trillion microbes with an environment packed full of nutrients (Gill et al., 2006). The most dominant microbes are members belonging to the bacteria Phyla Firmicutes and Bacteroidetes (>99%) and also the methanogenic Archaea Methanobrevibacter smithii. The
different bacteria are mostly anaerobes, but aerobes reside as well in the gut (Sekirov et al,. 2010). Interestingly, different amounts of microbiome are scattered throughout the gut with a lower abundance proximally in the initial gastrointestinal (GI) tract and an increase in volume and diversity of microbes in the distal colon. The gut microbiome helps to regulate the immune system, modulate the gut motility, acquisition in nutrients and vitamins, protection of pathogen invasion and aid in digestion (Bull and Plummer, 2014). It simply works in symbiosis with the host in healthy subjects. However, it´s evident that alterations of the gut flora for some diseases is associated with a change of the function or composition of the gut microbiome. Since we are born with a sterile GI tract the microbes that populate the GI tract are colonised rapidly after birth (Bawagan,. 2019). It has previously been suggested that the gut microbiome has been stabilised and adult-like around year 1-3, but indication has shown a continuing development until adult (Hollister et al., 2015). A pilot study showed a significant separation of the microbial composition in faecal samples of the pre-adolescents children compare to the samples of adults,
8 supporting the previous hypothesises above (Paliy et al,. 2009). Dependent on infant delivery, the initial colonisation of the gut also differs (Dominguez-Bello et al,. 2010). The colonization will resemble the virginal canal or bacterial milieu related to the skin dependent on traditional vaginal delivery or caesarean delivery respectively.
Moreover, breast or formula fed infants also depend the establishment of the
microbiota (Harmsen et al,. 2000). The microbiota gradually changes in number with an increase of obligate anaerobic species and number reduction of facultative
anaerobes and aerobes in early childhood (Hopkins et al,. 2005). If no disturbance factors such as antibiotics, environmental factors or diseases comes in place, a steady state reaches during the teens and smaller changes throughout the adulthood occurs minimally if no disturbance factors as above transpire (Hollister et al,. 2015). However, differences in the gut microbiome between individuals in the same age has been shown and a core gut microbiome are thus difficult to define of the bacteria on a species level (Lozupone et al,. 2012).
Studies in mice have shown a positive correlation between the ratio of Firmicutes to Bacteroidetes and BMI (Ruth et al,. 2006). In another study the same correlation
with humans (Turnbaugh et al., 2006). Obese subjects had the same ratio as obese mice’s, which decreased after fat reduction, and a hypothesis of a correlation
between these phylum and obesity was grounded. However, studies have, after the formulation of this hypothesis, showed contradictory results and relevance of these bacteria and its correlation to obesity was questioned (Schwiertz., 2010).
Correlations between obesity and different bacterial groups such as Bifidobacterium was shown, with a lower abundance Bifidobacterium towards obesity. Also,
methanogens and Short-Chain Fatty Acids (SCFA) respectively in correlation to obesity was found. More specific, the level of methanogens and SCFA was shown to be significantly lower respectively higher in obese subjects.
Methanogens
Methanogens of the digestive system belong to the phylum Eukaryota in the archaea domain. It’s a single-cell organism of an ancient field and they are strict anaerobes (Ghavami et al,. 2018). Methanogens are found in in the gut of humans and animals but also for example in fresh water, sewage and soil (Nkamga et al., 2017). In the human body methanogens have been found in the oral cavity, intestinal mucosa, virginal mucosa and on the skin (Nkamga et al., 2017). In 1982 only two
9 methanogens were cultured in the human gastrointestinal tract and three years later six methanogens were isolated from specimens of human stool (Nkamga et al., 2017). The six groups found in the human gut microbiota are:
Methanobrevibacter smithii, Methanosphaera stadtmanae, Methanomassiliicoccus luminyensis, Methanosarcina species (sp), Methanosphaera sp and
Methanobrevibacter oralis (Enzmann et al., 2018). Methanogens enhance food fermentation via saccharolytic bacteria thorough reduction of produced hydrogen to methane (van de Pol., 2017). In addition to hydrogen, methanogens can also use other substrates, such as acetate, methylamine and formate (Enzmann et al., 2018). Methanogens are divided in different groups according to substrate use, such as hydrogenotroph that can use hydrogen and methylotroph using for example
methylamines, methanol and acetate. Of the methanogen detected in the gut most are hydrogenotrophic. However, Methanomassiliicoccus, using methylamine and Methanosarcina, using in addition to hydrogen also acetate and methanol, are methylotrophs. Acetate utilizing methanogens, such as Methanosarcina are also called acetoclastic methanogens.
Methanogens – positive and negative health factors
The upcoming science has seen associations in different levels of methanogens and its correlation to a positive and negative input of the host after found in the large intestine and mouth. Associations between methanogens, levels and composition, and various conditions, such as colon cancer, diverticulosis, (de Marcario et al., 2008) infectious diseases and chronic constipation (Nkamga et al., 2017) have been seen. Methanogens also seems to trigger specific B and T cells in the innate and adaptive immune activation in humans and animals. On a subcellular level increase in proinflammatory cytokines and modulation of antimicrobial peptides have been shown to be released (Sereme et al., 2019). The healthy conditions mentioned above were all associated with a general high quantity of methanogens (non-identified specific group in the GI tract. However, studies have also shown a positive effect, with methanogens contributing with reducing the levels of trimethylamine(used as substrate) which results in an indirect decrease of the production levels of
trimethylamine oxide (TMAO), a pro-atherogenic factor. In other words, methanogen can decrease the risk of atherosclerosis (obstruction of the coronary arteries) and
10 help in prevention of cardiovascular diseases, then called archeabiotics (Brugere et al,. 2014).
Obesity and methanogens
Furthermore, correlation of obesity and intestinal methanogens was recently proposed as well (Nkamga et al., 2017). Its specific pathogenicity seems to be
indirect, where the actual pathogenesis comes from favouring the growth of other (de Marcario et al., 2008). An establishment of weight gain, caloric harvest and metabolic diseases such as obesity has been associated with an increased level of total
methanogens (Nkamga et al., 2017). In comparison, other studies have shown the opposite where anorectic subjects had a higher methanogen level compare to normal weighted subjects (Armougom., 2009). Furthermore, two other studies based on body mass index showed a lower methanogenic abundance in obese subjects (Zhang., 2009), (Million., 2013).
Factors influencing levels of methanogens
Important to note is that methanogens are present at different abundance and is aged dependent (Peled et al., 1985). Peled and co-workers had a study with almost 400 infants, children and adolescents to investigate the percentage of methane production by measuring the level in breath. Infants and up to 3 years had no production of methane while 3-4, 7-14- and 14-18-years group had 6,4%, 14,3-18,2% and 39,4-45,9% methane production in the breath , respectively. Adults showed with 49% methane in the breath. Furthermore, it’s not only age that have am important impact on methanogen production. This study showed an increase of methane associated with diary intake, which shows that different external factors such as food intake can change the gut microbiota and its composition (van de Pol., 2017).
Hypothesis
Methanogens produce methane from hydrogen produced during fermentation of carbohydrates and a correlation between methanogenic abundance in
gastrointestinal tract and obesity have been suggested in humans. In this study methanogenic abundance was analysed in faecal samples from lean and obese
11 children before and after incubation of the samples in a nutrient solution. We
hypothesized that the obese group should have comparably lower abundance and that the incubation would enhance the difference between the two investigated groups.
Method
Study setup
In this study methanogenic abundance was analysed with qPCR as described below using DNA samples extracted in a previous master study (Ingman., 2019). In this previous study the bacterial community was analysed by illumina sequencing. The results from the analyses of methanogenic abundance in this study was correlated against various patient parameters and SCFA, data collected in another previous master work (Ehn., 2017). A short description of the previous studies is included below to or clearance and better understanding of the set-up of this study. For more information and details of the previous projects, se references.
Design of the study – criteria of study participants – ethical review
This study is included in Uppsala Longitudinal Study of Childhood Obesity
(ULSCO)/Beta JUDO-study. It’s a non-randomised study and non-blinded for the researches regarding the collection of data and samples from the participants, where the groups are based on S-BMI. We have two groups with a total of 29 participants, one control group based on S-BMI <25 (15 participants) and a patient group based on S-BMI >30 (14 participants). Age <18 years and S-BMI under- or over 25 and 30 respectively are the inclusion criteria. Medicine with gut microbiota impact (based from a physician), metformin, antibiotics or acarbose treatment three months prior to the study or gastrointestinal diseases are the exclusion criteria. Information (written and verbally) was given to all participants and commitment was given on consent to participate in the same way, including caretakers. Information about their rights to withdraw on any occasion was also given. Blood pressure, body composition, faeces and fasted blood samples was taken and was ethical approval by Swedish Ethical Review Authority registration number 2012/318/ and 2012/318.
12 The RedCap database and Uppsala Academic hospital schedule at the obesity unit was used to find candidates with help from a M.D and M.L. A request and information were given by phone and further written information about the current study and the general ULSCO study was sent with an acceptance envelope. Following was also included in the envelope; Faecal sample collecting tubes with instruction, a topical lidocaine-based anaesthetic, nitrile gloves and a general health form for whom was interested to participate in the study.
Faecal samples
The faecal samples were instructed to be taken not more than 2 days before the appointment at Uppsala Children’s Hospital and refrigerated until collected. The faecal samples were refrigerated until transported to Swedish University of
Agriculture Science laboratory for analysis, not later than 3 days after the collection at the hospital.
Anthropometry
A wall-mounted stadiometer (Busse, Ulmer stadiometer) was used to record the height of all participants. Two measurement’s without shoes was made and a
calculation of the average in 0,1cm was recorded. The digital scale (SECA 704) was used to record the body weight in the same manner as for height. Weight of clothing, 0,5 kg, was subtracted from the weight that was recorded within 0,1 kg. After these two measurements S-BMI (age adjusted BMI) could be calculated. Calculations and records of bodyweight, body fat mas and fat percentage were measured via a bioelectrical impedance analysis (MC980-MA).
Laboratory analysis performed in previous studies of importance
for present work
Levels of SCFA and composition of the bacteria community structure were measured in the previous mentioned master projects, using high performance liquid
chromatography analysis (HPLC) and Illiumina sequencing, respectively (Ehn,. 2017; Ingman,. 2019). The faecal samples used for the analyses started with non-incubated samples and further investigation after 48 hours of incubation in a sucrose containing nutrient medium. Triplicate DNA extractions were made direct from feaces for all the
13 samples, called 0-hurs samples or non-incubated samples. The bacterial culturing process for the incubating samples was made through the method described from Westerholm et al,. 2010. In brief, the feaces was mixed with a nutrient medium and 0,4 ml of sucrose, under anaerobic circumstances. The samples were then placed in a room of 37 degrees Celsius for 48 hours.
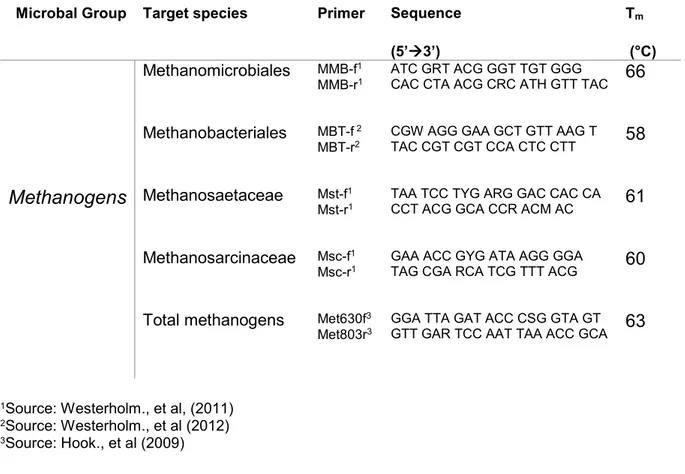
Real-Time Quantitative PCR
Different methanogen groups Methanobacteriales (MBT), Methanosaetaceae (MST), Methanosarcinaceae (MSC), Methanomicrobiales (MMB) and total methanogens was analysed by qPCR using group specific primers targeting the 16S rRNA gene (table 1). To quantify the methanogens in the samples, a standard curve was used as a baseline. Purified PCR product with a pGEM ligated into the vectors with noted copies was used. A dilution of the purified PCR product was made, creating a
standard curve with copies of 108, 107, 106 , 105 continuously down to 101 copies per
μl. Further, a dilution test of the faecal DNA samples was initially made to optimise PCR reaction. The DNA samples used in the PCR analysis were diluted 10, 100, 200 and 500 times. The samples diluted 200 times showed the best performance and further applied for all samples in the analysis.
The individual samples were mixed as below:
10 µl master mix (iQ SYBR green supermix Bio-Rad, Hercules, CA, USA) 1 µl forward primer (10pmol/µL)
1 µl reverse primer (10pmol/µL) 5 µl nuclease-free water
3 µl DNA (see table 1. below for specific details)
A well fitted 96- well plate prepared with reaction solution, primers and template DNA was then placed into the Real-Time System (BIO-RAD CFX96TM) for reaction and calculation.
The different methanogens had different sequences why the PCR machine settings were slightly different. The same number of cycles were used, but the primer melting temperature (Tm) was different (Table 1). The methanogenic abundance was
14 CA, USA). A melt curve was performed in the end of the program to detect any non-specific amplicons or primer dimers by a temperature rise from 55-95°C (ΔT=0.1°C s-1). For statistically data a T-test and/or ANOVA test was performed.
Table 1. List of primers used to quantify methanogenic groups of archea Microbal Group Target species Primer Sequence
(5’3’)
Tm
(°C)
Methanomicrobiales MMB-f1
MMB-r1 ATC GRT ACG GGT TGT GGG CAC CTA ACG CRC ATH GTT TAC 66 Methanobacteriales MBT-f 2
MBT-r2 CGW AGG GAA GCT GTT AAG T TAC CGT CGT CCA CTC CTT 58
Methanogens Methanosaetaceae Mst-f1
Mst-r1 TAA TCC TYG ARG GAC CAC CA CCT ACG GCA CCR ACM AC 61 Methanosarcinaceae Msc-f1
Msc-r1 GAA ACC GYG ATA AGG GGA TAG CGA RCA TCG TTT ACG 60 Total methanogens Met630f3
Met803r3 GGA TTA GAT ACC CSG GTA GT GTT GAR TCC AAT TAA ACC GCA 63
1Source: Westerholm., et al, (2011) 2Source: Westerholm., et al (2012) 3Source: Hook., et al (2009)
Results
Participants
A total of 29 subjects was involved in the study, aged between 8-17 years. Control- and patient group was based on S-BMI non-randomised. Control group had 15 subjects and S-BMI <25. Patient group had 14 subjects and S-BMI >30. Every subject in the patient group was patients at the obesity clinic at Uppsala Academic Children’s hospital. 3 subjects in both groups for data of 48 hours incubation samples of MBT was not included in 16s-rRNA-analysis, leaving the control group with 12 subjects and the patient group with 11 subjects (note; only for the incubation test).
15
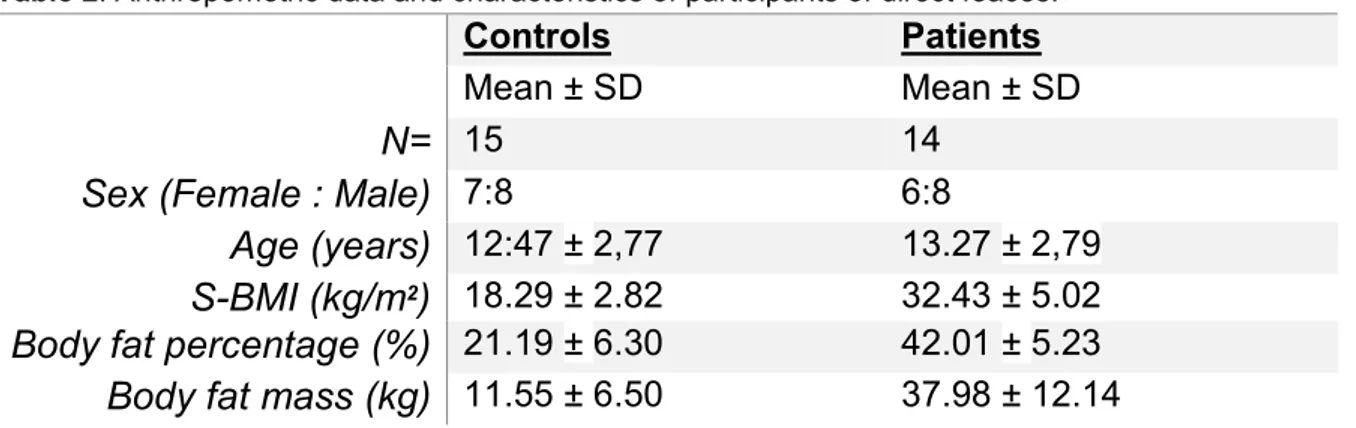
Table 2. Anthropometric data and characteristics of participants of direct feaces.
Controls Patients
Mean ± SD Mean ± SD
N= 15 14
Sex (Female : Male) 7:8 6:8
Age (years) 12:47 ± 2,77 13.27 ± 2,79
S-BMI (kg/m2) 18.29 ± 2.82 32.43 ± 5.02
Body fat percentage (%) 21.19 ± 6.30 42.01 ± 5.23
Body fat mass (kg) 11.55 ± 6.50 37.98 ± 12.14
Methanogens
Quantification of the different methanogenic groups showed in general very low abundance. The abundance of MSC, MMB and MST were at the point for detection, making the results quite uncertain. MBT and total methanogens were however
detected above 107 copies per µl. Consider the level of total methanogens a trend for
a lower level in the obese group was shown, but the difference is not significant (T-test p=0,703). However, the levels of MBT in feaces showed a significant correlation with BMI, with a decreased level of MBT in the obese group compare to the lean group for the 0h samples (ANOVA p=0,01) and 48 hours samples (ANOVA p=0,0). Two statistics analysis was made to increase the strength of this specific result, ANOVA and T-test, which both showed a significant correlation between BMI and MBT, for both incubated and non-incubated samples.
In summary, MSC, MMB and MST could not be used for statistical analyses due to the low and uncertain values. However, MBT was well detected and significantly correlated to BMI, with a significantly lower amount of MBT in the obese group (table 3). For the non-incubated samples, the level of total methanogens as well showed a correlation to BMI, with lower levels in the feaces for the obese group.
16
Table 3. List of results from methanogens in non-incubated feaces, copies per µl. Patientgrupp (mean ± SD) (copies/µl) Controll (mean ± SD) (copies/µl) N= 14 15 Tot-met 1,46^8 ± 5,80^7 1,80^8 ± 1,14^8 MBT 4,40^7 ± 1,88^7 3,97^7 ± 2,40^7 MST <10^4 <10^4 MMB 8,99^4 ± 7,18^4 1,92^5 ± 6,60^4 MSC 4,25^5 ± 1,37^5 2,12^5 ± 9,66^4
Bacteria and SCFA
To reveal connection between specific groups of bacteria and levels of SCFA, data from previously done Illumina sequencing and HPLC analyses were further
investigated in this study. Results from Illumina sequencing are given in relative abundance and data for some bacteria, before and after incubation, were included in a correlation analysis. The results showed no significant correlation between the bacterial groups Firmicutes, Bacteroidetes or Bifidobacterium to BMI, body fat, MBT, SCFA and age. However, a trend of a correlation between Firmicutes and
Bacteroidetes, when one was trending high the other one was trending low. In the samples from the 48 hours incubation a significant correlation was obtained between SCFA and MBT (p=0,01) with a higher level of SCFA in the obese group and a lower rate in the lean group. A correlation between BMI and SCFA was also seen (p=0,1).
Table 4. List of anthropometric data and results of each individual of non-incubated feaces samples.
Age (years) S-BMI (kg/m2) Body fat percentage (%) MBT 0h Bifidobacterium 0h (%) Firmicutes 0h (%) Bacteroidetes 0h (%) Total SCFA 0h (g/l) 13 18,9 15,8 2,21^7 ± 9,87^6 12,0 19,5 67,2 <0,2 9 19,5 16,8 7,35^7 ± 5,61^6 11,0 20,4 62,2 <0,2 12 19,8 15 2,31^8 ± 2,03^8 3,3 46,2 44,3 <0,2 8 20,9 21,3 1,37^7 ± 7,52^6 3,7 38,5 51,4 <0,2 11 21,2 16,9 2,16^7 ± 2,15^7 1,4 17,4 79,3 <0,2 17 21,2 24,3 1,67^7 ± 1,36^7 0,0 48,8 46,2 <0,2 14 21.4 13,4 4,55^7 ± 7,38^6 1,0 46,2 44,3 <0,2 14 22 27,7 2,51^7 ± 2,18^7 22,0 56,8 14,5 <0,2 16 22,2 27,9 1,30^8 ± 2,42^6 0,0 31,5 65,8 <0,2
17 11 22,7 25,3 1,34^7 ± 4,68^6 15,0 38,5 45,5 <0,2 16 23,6 28,8 2,14^7 ± 7,26^6 28,0 37,7 30,0 <0,2 14 24,6 33,6 3,38 ^7 ± 8,42^6 2,3 16,8 79,9 <0,2 13 31,3 37,2 5,09^7 ± 3,61^7 2,5 53,5 41,2 <0,2 17 32,2 36,1 6,82^7 ± 5,48^6 2,1 65,9 31,7 <0,2 11 32,9 43,1 6,69^7 ± 0,00 11,0 81,6 4,5 <0,2 16 33,5 33,2 4,74^7 ± 3,99^6 3,2 63,9 31,1 <0,2 11 35,3 49,9 3,51^7 ± 1,88^6 7,5 39,5 52,8 <0,2 13 37 36,1 3,66^7 ± 4,42^7 19,2 34,7 45,9 <0,2 9 38,2 42,9 3,07^7 ± 1,48^7 1,0 28,7 69,4 <0,2 17 38,5 45,7 1,22^7 ± 0,00 0,0 37,8 60,7 <0,2 16 39,2 44,7 6,02^7 ± 2,66^7 4,6 53 42,5 <0,2 10 39,7 47,6 3,63^7 ± 2,00^7 1,4 15,6 82,7 <0,2 17 42 46,7 7,08^6 ± 2,38^6 38,0 26,6 32,1 <0,2
Table 5. List of anthropometric data and results of each individual of 48 hours incubated faecal samples
Age (years) S-BMI (kg/m2) Body fat percentage (%) MBT 48h Bifidobacterium 48h (%) Firmicutes 48h (%) Bacteroidetes 48h (%) Tot SCFA 48h (g/l) 13 18,9 15,8 4,20^5 ± 1,53^5 88,5 6,8 3,6 2,19 9 19,5 16,8 6,11^5 ± 2,81^5 80,1 6,2 11,2 2,25 12 19,8 15 6,29^5 ± 8,80^4 60,0 29 7,2 2,41 8 20,9 21,3 5,83^5 ± 2,39^5 44,5 17,8 5,1 2,45 11 21,2 16,9 2,95^5 ± 1,84^5 25,4 60,5 9,2 1,85 17 21,2 24,3 2,93^5± 2,25^5 78,2 1,4 14,7 1,79 14 21.4 13,4 2,19^5 ± 1,03^5 72,0 9,5 16,1 1,66 14 22 27,7 3,18^5 ± 5,48^4 86,0 4,0 2,4 2,36 16 22,2 27,9 4,15^5 ± 1,32^5 51,0 41,1 7,1 2,78 11 22,7 25,3 1,94^5 ± 1,18^5 33,0 35,6 30,3 2,22 16 23,6 28,8 3,09^5 ± 1,95^5 44,5 51,3 3,1 2,08 14 24,6 33,6 2,01^5 ± 1,09^5 21,4 5,2 66 1,50 13 31,3 37,2 1,43^5 ± 2,27^4 59,0 24,4 8,7 2,55 17 32,2 36,1 1,27^5 ± 7,38^5 13,1 13,5 11,2 1,87 11 32,9 43,1 1,62^5 ± 2,73^4 79,0 6,4 1,6 1,73 16 33,5 33,2 1,33^5 ± 1,62^4 14,0 75,7 6,9 1,86 11 35,3 49,9 2,79^5 ± 1,68^5 50,0 46,8 3,6 2,29 13 37 36,1 1,23^5 ± 8,20^4 68,0 22,4 8,9 2,52 9 38,2 42,9 3,57^5 ± 2,08^5 78,0 17,3 4,7 3,35 17 38,5 45,7 1,03^5 ± 1,41^4 3,5 35,4 60,4 1,89 16 39,2 44,7 1,50^5 ± 3,47^4 17,0 76,3 6,0 2,17 10 39,7 47,6 2,25^5 ± 1,57^5 44,0 50,8 5,3 3,04 17 42 46,7 3,68^5 ± 2,79^5 86,0 10 3,1 2,62
18
Discussion
Gut microbiota
Obesity is undoubtedly multifactored and several studies have shown changes in the gut microbiota as one important factor correlating with obesity, where a precise mechanism of metabolic function remains unknown. Overweight and obesity is a global epidemic where an unbalance between energy intake, consumption and storage is seen to be dysregulated in these areas. The potential role of the gut microbiota is a growing interest in the pathophysiology of obesity and wellbeing to health and has been widely acknowledged recent years. Possible findings in the gut microbiota and its correlation to obesity has in several studies been shown and a new significant focus is now in process (Ley,. Et al 2006; Turnbaugh., et al 2006). Mouse models have shown fascinating correlations between weight gain and gut microbiota, for example, a relationship between different bacteria abundance with potential increased energy harvest (Turnbaugh et al., 2006). Gut microbiota has been correlated to possible contribution of weight gain through implicated mechanism, including increased lipogenic substrate thorough increased SCFA absorption and production (Samuel et al., 2008), fatty acid oxidation suppressed via AMP-activation protein kinase in the liver (Bäckhed et al,. 2004), insulin resistance due to increased lipopolysaccharide production (Cani et al., 2007) and also incretin hormone
regulation (Cani et al., 2009) just to name a few. Recently a correlation between methanogens and obesity was found in animals and humans. Previous studies have mainly have measured methanogenic levels in feaces, without incubations, which makes this study unique as in in addition also included measurements of
methanogens after incubation.
Methanogens
This study showed a significant correlation between obesity and MBT which has been shown before, as described below. However, this study is the first to
demonstrate the correlation between MBT and BMI after incubation, which showed an even greater significant potential. The significant correlation between MBT and BMI showed a lower level of this methanogenic group in the obese group. In the non-incubated samples, a similar significant correlation was found but the significance
19 increased after the 48 hours incubation. The lower abundance of MBT in obese subjects in this study is in line with the results of Schwiertz and co-worker’s, finding the same correlation in humans (Schwiertz et al., 2010). In contrast, Mbakwa and co-workers presented a study showing a correlation between higher abundance of MBT in feaces and obesity (Mbakwa et al., 2015). But it’s important to note that differences in diet, gut genome, exercise and other factors could alter the original gut microbiota and impact on the outcomes (Schwiertz et al., 2010).
Further studies have shown a correlation between increased body fat percentage and high BMI with increased methane and hydrogen levels in breath (Basseri et al., 2012). The hypothesis introduced in their study was that higher levels of methane presented as an inhibited effect on the motility of the small intestine and indirectly decreased the transition of the food, which contributed to increased nutrient availability. A consequence of this colonization of methanogens and indirect enhanced nutrient availability showed an increased correlation to weight gain. However, breath methane measurements require 108 per gram of dry weight in cell
number to be detected (Weaver et al., 1986) which could make Basseri and
co-workers result uncertain due to exclusion of potential important differences below that level of the individuals. Another interesting factor about methanogens is that they are located in the same region as the L cells, which produce glucagon-like peptide (GLP-1), which in turn regulates glucose and appetite regulation (Laverdure et al,. 2018). The study showed that methane stimulated the GLP-1 secretion and in turn
increased the intracellular cAMP content. A simultaneous significant correlation between GLP-1 secretion and methanogen abundance was shown in a mice model feed on a high-fat diet (Laverdure et al,. 2018).
The different outcome in the studies mentioned above support that a more detailed mechanism has to be revealed for methanogenic colonisation, but new prevention targets might be provided for diseases associated with the methanogenic presence.
Conclusively, the methanogenic groups MMB, MSC and MST were too low for good detection as the measured levels were close to detection limits. MST seemed initially to be highly abundant but after additional data analysis only unspecific products were found, most likely because MST levels were below detection levels. Important
20 to note and a weakening point for the investigation of methanogens is that there is an uncertain degree of growth of methanogens in the human body. The abundance has also been shown to be correlated to the age of the host, where younger children have lower levels than adults. The origin of the uncertain degree of growth of methanogens is unknown but a hypothesis that different colonic floras could play a roll, with further investigation needed to confirm the hypothesis (Peled et al., 1985). Further, a study concluded that on a western diet all their participants had presence of methanogens, with levels differing up to 10 logs between subjects (Miller T.L., and Wlin M.J., 1986). In light of this, a potential difference between the individuals and correlation to BMI in all methanogenic groups could be present, but with a lower detectable threshold then in the present analysis
SCFA
In the 48 hours incubation, the analysis showed higher SCFA values, with a significant higher value in the obese group. This indicates an increased ability of fermentation of carbohydrates to SCFA in the gut microbiota of obese children compared to the lean children. This result was in line with previous studies showing similar results of a higher level of SCFA associated with obese subjects (Schewiertz et al., 2010; de la Cuesta-Zuluaga et al., 2018). SCFA are considered as a precursor for cholesterol, for liponeogenesis, protein synthesis and for gluconeogenesis which indirect indicate weight gain (Schwiertz et al., 2010).
Furthermore, a significantly higher abundance of SCFA correlated with levels of MBT in our study. More specific, a correlation was found for higher levels of SCFA and lower levels of MBT in the obese group, which are in line with previous studies (Clifton et al., 2011; Abell et al., 2006). The physiology behind this phenomenon are likely increased food fermentation and SCFA production, mainly acetate, butyrate and propionate through reduction of hydrogen and production of methane mainly (Topping D.L., and Clifton P.M 2001). Acetate, butyrate and propionate have been shown to represent 95% of the SCFA in the gut (Ley et al., 2006). Moreover, the phylum of Firmicutes have been shown to mainly produce butyrate while acetate and propionate mainly are produced from the Bacteroidetes phylum (Ley et al., 2006). Still the actual level of SCFA is difficult to determine due to absorption in the gut, and thus the SCFA in feaces is not the true level in the GI tract (den Besten et al., 2013).
21 The degree of uptake of SCFA in the GI is mainly unknown (den Besten et al., 2013). This study, however, is unique in the incubation manner since it hasn’t been applied in this context of in vitro to in vivo method before. A hypothesis that a better reflection of the potential production of SCFA will be shown compare to measuring the SCFA direct in feaces, due to unknown absorption. A conclusion of faecal SCFA could be made for a better estimation of production and absorption when a known rate of production is set.
Bacteria
Bacteroidetes and Firmicutes in abundance to each other have through biochemical and metagenomic analyses in rats suggested to be related to obesity (Turnbaugh et al., 2006). A significant increase in body fat percentage was shown when of a germ-free mice was colonised with Bacteroidetes and Firmicutes “obese” microbiota, awakening a potential factor behind the pathophysiology of obesity. These two
bacteria in proportion to each other with an increased level of Firmicutes compared to Bacteroidetes were assumed to be associated with obesity, even in humans (Ley et al,. 2006; Ley et al,. 2005). The increase of Firmicutes has been shown to be an indirect factor for extra supply of energy for the host due to production of SCFA (Scheppach W,. 1994). A correlation between Firmicutes and Bacteroidetes was observed in this study as well, when one increases the other one decrease, but due to relative measurements, it’s difficult to conclude from this observation. A absolute quantification would be better here, especially on a more detailed level of a genus or even species level. Prevotella is, for example, an important species within the
Firmicutes group and a next step could be to target and quantify specifically this group. Further, no correlation between Bacteroidetes and BMI was found in this study, in accordance with previous studies (Duncan et al., 2008; Ducan et al., 2007; Schwiertz et al., 2010), suggesting this bacterial group not to be of centrally
importance for obesity.
No correlation between Bifidobacterium and BMI could not be seen in this study either, compare to Schwiertz and co-workers whose result showed a significant level of Bifidobacterium with a lower level in the obese subjects (Schwiertz et al., 2010). However, lifestyles-related factors haven’t been recorded which could have an impact on the gut microbiota and indirect bacteria’s, which makes it difficult to draw an absolute conclusion.
22
Summary of conclusion
In summary, this study showed a significant lower level of the specific methanogen MBT and a higher level of total SCFA in the obese compared to lean group. The increase of the SCFA production gets absorbed and subsequently serves an energy source for the human host and weight gain due to this. In this study no consideration was taken for influencing factors for obesity such as lifestyles-related factors as the participant’s diet, activity, habitation or heritage. The importance of methanogens and bacteria could therefore be difficult to draw, but the results definitely awakening potential prevention targets for obesity and further investigations since some
significant changes are seen in the induvial groups. More clinical studies are needed to be able to draw a more definite conclusion, where the subjects report a more detailed lifestyle in dieting and activity etc to further establish a consistent theory about the correlation between intestinal microbiota and obesity. An obesity biomarker or a methanogen therapeutic target is therefore not yet established, where a more consistent theory of the intestinal influence of the microbiota in obesity is in needed. However, lifestyle factors seem to be the biggest influence at the moment and where, for example, a vegetarian diet has shown to help in weight reduction greater than a normal diet which could be a helpful tool to introduce to obese people in general (Huang et al., 2016).
Strength and limitations
Limitation for the study was undetectable methanogens in most of the analysed groups, except MBT. Another limitation was the loss of 3 samples from each group due to inefficient PCR. This decreased the number of subjects further in each group. However, an increase in analytic precision was established when triplicate of each samples was made throughout our laboratory analysis. Regarding age and sex is there a potential difference in age for methanogen abundance but not for sex. A strength for this study is accordingly the similarity between the two groups regarding age and sex distribution. The number of participants in the study is a limitation where a bigger group of participants could have shown potentially small but clinically
23 relevant findings. Since all obese participants were patients at Uppsala university a slight selection bias occurred which is a further limitation for the study.
Concluding remarks
In conclusion, this study shows a new way of measuring methanogen and SCFA production in the GI tract. A significant correlation between MBT and BMI was seen. Also, a significant correlation between total SCFA and BMI and SCFA towards MBT was shown. However, no correlation towards bacteria’s and obesity at the genus and phylum levels was found. Studies with a larger study population and a bigger
selection ratio then this study would be strengthening our findings. The model of in vitro and in vivo would be a recommendation for small but important detection, since this shows a greater potential of the growth of the microbiota and could help to increase the low but important changes in the composition of the microbiome.
Acknowledgments
I would like to thank my supervisor Anna Schürer for all support, ideas and general guidance in this study. I also like to thank Simon Isaksson for his assistant support in the laboratory and valuable methodology input. I thank Marie Dahlblom and Malte Lidström for the study recruitment of the participants. Also, I thank Maria Westerholm for the ANOVA analysis and her input for presentation of the results. Eventually, I like to thank Thomas Ingman and Per Ehn for sharing their data on bacterial-levels and SCFA-levels respectively and also the collected samples Per Ehn arranged and allowed me to use for the analysis of this study.
24
References
Albell G.C.J., Conlon M.A. and McOrist A.l. (2009). Methanigenic archea in adult human faecal samples are inversely related to butyrate concetration. Microbial Ecology in Helath and Diseas. 18, 154-160, Doi: 10.1080/08910600601048969. Armougom F., Henry M., Vialettes B., Raccah D. and Raoult D. (2009). Monitoring bacterial community of human gut microbiota reveals an increase in Lactobacillus in obese patients and Methanogens in anorexic patient. PLoS One. 4, e7125. Doi: 10.1371/journal.pone.0007125.
Backhed F., Ding H., Wang T., Hooper L.V., Koh G.Y., Nagy A., Semenkovich C.F. and Gordon J.I. (2004). The gut microbiota as an environmental factor that regulates fat storage. Proc. Natl. Acad. Sci. USA. 101, 15718–23.
Doi:10.1073/pnas.0407076101
Backhed F., Manchester J.K., Semenkovich C.F. and Gordon J.I. (2007). Mechanisms underlying the resistance to diet-induced obesity in germ-free
mice. Proc. Natl. Acad. Sci. USA. 104, 979–984. Doi: 10.1073/pnas.0605374104. Basseri R.J., Basseri B., Pimentel M., Chong k., Youdim A., Low K., Hwang L., Soffer E., Chang C. and Mathur R. (2012). Intestinal methane production in obese
individuals is associated with a higher body mass index. Gastroenterol Hepatol. 8, 22-28. PMID: 22347829.
Bawagan J. (2019). Babies get critical gut becteria from their mother at birth, not from placenta, study suggests. Biology. Doi:10.1126/science.aay9546
Brugere J.F., Borrel G., Gaci N., Tottey W., O’Toole P.W. and Malpuech-Brugere C. (2014). Archaebiotics: proposed therapeutic use of archea to prevent
trimethylaminuria and cardiovascular disease. Gut Microbes. 5, 5-10. Doi: 10.4161/gmic.26749.
Bull, M.J. and Plummer N.T. (2014). The Human Gut Microbiome in Health and Disease. Integr. Med. 13, 17-22. PMID: 26770121.
Calle E.E. and Kaaks R. (2004). Overweight, obesity and cancer: epidemiological evidence and proposed mechanisms. Nat Rev. Cancer. 4, 579-91.
Doi:10.1038/nrc1408.
Cani P.D., Bibiloni R, Knauf C,. Waget A., Neyrinck A.M., Delzenne N.M. and Burcelin R. (2008). Changes in gut microbiota control metabolic
endotoxemia-induced inflammation in high-fat diet-endotoxemia-induced obesity and diabetes in mice. Diabetes. 57, 1470–148. Doi: 10.2337/db07-1403.
25 Cani P.D., Lecourt E., Dewulf E.M., Sohet F.M., Pachikian B.D., Naslain D., De
Backer F., Neyrinck A.M. and Delzenne N.M. (2009). Gut microbiota fermentation of prebiotics increases satietogenic and incretin gut peptide production with
consequences for appetite sensation and glucose response after a meal. Clin. Nutr. 90, 1236–1243. Doi: 10.3945/ajcn.
Cole T.J., Bellizzi M.C., Flegal K.M. and Dietz W.H. (2000). Establishing a Standard Definition for Child Overweight and Obesity Worldwide: International Survey. BMJ 320, 1240–43. Doi: 10.1136/bmj.320.7244.1240.
Cruz M.L., Shaibi G.Q., Weigensberg M.J., Spruijt-Metz D., Ball G.D. and Goran M.I. (2005). Pediatric obesity and insulin resistance: chronic disease risk and implications for treatment and prevention beyond body weight modification. Annu Rev. Nutr. 25, 435-68. Doi: 10.1146/annurev.nutr.25.050304.092625.
de Marcaroi E.C., and Marcario A.J.L. (2008). Methanogenic archaea in health and disease: A novel paradigm of microbial pathogenesis. Int. J. Med. Microbiol. 299, 99-108. Doi: 10.1016/j.ijmm.2008.06.011.
Dominguez-Bello M.G., Costello E.K., Contreras M., Magris M., Hidalgo G., Fierer N. and Knight R. (2010). Delivery mode shapes the acquisition and structure of the initial microbiota across multiple body habitats in newborns. Proc. Natl. Acad. Sci. USA. 107, 11971–11975. Doi: 10.1073/pnas.1002601107.
Duncan S.H., Belenguer A., Holtrop G., Johnstone A.M,. Flint H.J. and Lobley G.E. (2007). Reduced dietary intake of carbohydrates by obese subjects results in
decreased concentrations of butyrate and butyrate-producing bacteria in feces. Appl. Environ Microbiol. 7, 1073–8. Doi: 10.1128/AEM.02340-06.
Duncan S.H., Lobley G.E., Holtrop G.. Ince C., Johnstone A.M., Louis P. and Flint H.J. (2008). Human colonic microbiota associated with diet, obesity and weight loss. Int. J. Obes. 32, 1720–4. Doi: 10.1038/ijo.2008.155.
Ehn P. (2017). The production of SCFA in the gut microbiota and its correlation to obesity in children.
Enzmann F., Mayer F., Rother M. and Holtmann D. (2018). Methanogens: biochemical background and biotechnological applications. AMB express. 8, 1. Doi: 10.1186/s13568-017-0531-x.
Finkelstein E.A., Trogdon J.G., Cohen J.W. and Dietz W. (2009). Annual medical spending attributable to obesity: payer-and service-specific estimates. Health Aff. (Millwood). 28, 822-31. Doi:10.1377/hlthaff.28.5.w822.
26 Flourie B., Etanchaud F., Florent C., Pellier P., Bouhnik Y. and Rambaud J.C.
(1990). Comparative study of hydrogen and methane production in the human colon using caecal and faecal homogenates. Gut. 31, 684–685. Doi: 10.1136/gut.31.6.684. Fredamn D.S., Dietz W.H., Srinivasan S.R. and Berenson G.S. (1999). The relation of overweight to cardiovascular risk factors among children and adolescents: the Bogalusa Heart Study. Pediatrics. 103, 1175-82. Doi: 10.1542/peds.103.6.1175. Ghavami S.B., Rostami E. Sephay A.A., Shahrokh S., Balaii H., Aghdaei H.A. and Zali M.r. (2018). Alterations of the human gut Methanobrevibacter smithii as a biomarker for inflammatory bowel diseases. Microb. Pathog. 117, 285-289. Doi: https://doi.org/10.1016/j.micpath.2018.01.029.
Gill S.R., Pop M., DeBoy R.T., Eckburg P.B., Turnbaugh P.J., Samuel B.S., Gordon J.i., Relman D.A., Fraserr-Liggett C.M. and Nelson K.E. (2006). Metagenomic Analysis of the Human Distal Gut Microbiome. Science. 312, 1355–1359. Doi: 10.1126/science.1124234.
Harmsen H.J., Wildeboer-Veloo A.C., Raangs G.C., Wagendorp A.A., Klijn N., Bindels J.G. and Welling G.W. (2000). Analysis of intestinal flora development in breast-fed and formula-fed infants by using molecular identification and detection methods. Pediatr. Gastroenterol. Nutr. 30, 61–67. Doi:
10.1097/00005176-200001000-00019.
Hollister E.B., Riehle K., Luna R.A., Weidler E.M., Rubio-Gonzales M., Mistretta T.A., Raza S., Doddapaneni H.V., Metcalf G.A., Muzny D.M. et al. (2015). Structure and function of the healthy pre-adolescent pediatric gut microbiome. Microbiome. 3, 36. 26. PMID: 26306392.
Hook S. E., Northwood K. S., Wright A. D. G. and McBride B. W. (2009). Long-term monensin supplementation does not significantly affect the quantity or diversity of methanogens in the rumen of the lactating dairy cow. Appl. Environ. Microbiol. 75, 374–380. Doi: 10.1128/AEM.01672-08
Hopkins M.J., Macfarlane G.T., Furrie E., Fite A. and Macfarlane S. (2005) Characterisation of intestinal bacteria in infant stools using real-time PCR and northern hybridisation analyses. FEMS. Microbiol. Ecol. 54, 77–85. Doi: 10.1016/j.femsec.2005.03.001.
Huang Ru-Yi., Huang Chuan-Chin., Hu F.B. and Chavarro J.E. (2016). Vegiterain diets nad weight reduction: a meta-analysis of randomized controlled trials. Intern. Med. 31, 109-16. Doi: 10.1007/s11606-015-3390-7.
27 Ingman T. (2019). Gut microbiota and fecal short chain fatty acid-levels in obese children.
Kim G., Deepinder F., Morales W., Hwang L., Weitsman S., Chang C., Gunsalus R. and Pimentel M. (2012). Methanobrevibacter smithii is the predominant methanogen in patients with constipation-predominant IBS and methane on breath. Digest Dis. Sci. 57, 3213–3218. Doi: 10.1007/s10620-012-2197-1.
Koplan J.P., Liverman C.T. and Kraak V.I. (2005). Committee on Prevention of Obesity in Children and Youth. Preventing childhood obesity: health in the balance: executive summary. Diet Assoc. 105, 131-8.
Doi:10.1016/j.jada.2004.11.023.
Kuczynski, J., Lauber, C.L., Walters, W.A., Parfrey, L.W., Clemente, J.C., Gevers, D. and Knight, R. (2011). Experimental and analytical tools for studying the human microbiome. Nat. Rev. Genet. 13, 47–58. Doi: 10.1038/nrg3129.
Laverdure R., Mezouari A., Carson M.A., Basiliko N. and Gagnon J. (2018) A role for methanogens and methane in the regulation of GLP-1. Endocrinol Diabetes Metab. 1, e00006. Doi: 10.1002/edm2.6.
Ley R.E., Bäckhed F., Turnbaugh P., Lozupone C.A., Knight R.D. and Gordon J.I. Obesity alters gut microbial ecology. (2005). Proc. Natl. Acad. Sci. USA. 102, 11070-5. Doi: 10.1073/pnas.0504978102.
Ley R.E., Turnbaugh P.J., Klein. and Gordon J.I. (2006). Microbial ecology: human gut microbes associated with obesity. Nature. 444, 1022-3. Doi: 10.1038/4441022a. Mathur R., Kim G., Morales W., Sung., Rooks E., Pokkunuri V., Weitsman S., Barlow GM., Chang C. and Pimentel M.(2013). Intestinal Methanobrevibacter smithii but not total bacteria is related to diet-induced weight gain in rats. Obesity (Silver Spring). 21, 748-54. Doi: 10.1002/oby.20277.
Miller T.L., and Wlin M.J. (1986). Methanogens in human and animal intestine tracts. Systematic and applied microbiology. 7, 223-229. Doi: https://doi.org/10.1016/S0723-2020(86)80010-8.
Million M., Angelakis E., Maraninchi M., Henry M., Giorgi R., Valero R., Vialettes B. and Raoult D. (2013). Correlation between body mass index and gut concentrations of Lactobacillus reuteri, Bifidobacterium animalis, Methanobrevibacter smithii and Escherichia coli”. Int. J. Obes. 37, 1460-6. Doi: 10.1038/ijo.2013.20.
28 Mbakwa C.A., Penders J., Savelkoul P.H., Thijs C., Mommers M. and Arts I.C.
(2015). Gut colonisation with methanobrevibacter smithii is associated with childhood weight development. Obesity (Silver Spring). 23, 2508-16. Doi: 10.1002/oby.21266. Neish A.S. (2008). Microbes in Gastrointestinal Health and Disease.
Gastroenterology. 136, 65-80. Doi: 10.1053/j.gastro.2008.10.080.
Nkamga V.D., Henrissta B. and Drancourt M. (2017). Archaea: Essential inhabitants of the human digestive microbiota. Human Microbiome Journal. 3, 1-8. Doi:
https://doi.org/10.1016/j.humic.2016.11.005.
Paliy O., Kenche H., Abernathy F. and Michail S. (2009). High-throughput quantitative analysis of the human intestinal microbiota with a phylogenetic microarray. Appl. Environ. Microbiol. 75, 3572–9. Doi: 10.1128/AEM.02764-08. Peled Y., Gilat T., Liberman E. and Bujanover Y. (1985). The development of methane production in childhood and adolescence. Pediatr. Gastroenterol. Nutr. 4, 575-9. Doi: 10.1097/00005176-198508000-00013.
Pinhas-Hamiel O. and Zeitler P. (1996). Insulin resistance, obesity, and related disorders among black adolescents. J Pediatr. 129, 319-20. DOI: 10.1016/s0022-3476(96)70060-4.
Prentice, A.M. and Jebb, S.A. (2003). Fast foods, energy density and obesity: a possible mechanistic link. Obes. Rev. 4, 187–194.
Ruth E.L., Daniel A.P. and Jeffrey I.G. (2006). Ecological and evolutionary forces shaping microbial diversity in the human intestine. Cell. 124, 837-48. Doi:
10.1016/J.CELL.2006.02.017.
Scheppach W. (1994). Effects of short chain fatty acids on gut morphology and function. Gut morphology and function. Gut. 35, 35-38. Doi:
10.1136/gut.35.1_suppl.s35.
Schwiertz A., Taras D., Schäfer K., Beijer S., Bos NA., Donus C. and Hardt P.D. (2010). Microbiota and SCFA in Lean and Overweight Healthy Subjects. Obesity (Silver Spring). 18, 190–5. Doi.org/10.1038/oby.2009.167.
Sekirov I., Russell S.L., Antunes L.C.M. and Finlay B.B. (2010). Gut microbiota in health and disease. Physiol. Rev. 90, 859–904. Doi: 10.1152/physrev.00045.2009. Sereme Y., Mezouar S., Grine G., Mege J.L., Drancourt M., Corbeau P. and Vitte J. (2019). Methanogenic archea: Emerging partners in the field of allergic diseases. Clin. Rev. Allergy and immunology. Volume 1. Doi: 10.1007/s12016-019-08766-5.
29 Singh A.S., Mulder C., Twisk J.W., van Mechelen W., and Chingapaw M.J. (2008). Tracking of childhood overweight into adulthood: a systematic review of the literature. Obese Rev. 9, 474-88. Doi: 10.1111/j.1467-789X.2008.00475.x.
Spruijt-Metz D. (2011). Etiology, Treatment and Prevention of obesity in childhood and adolescence: A decade in review. J. Res. Adolesc. 21, 129-152. Doi:
10.1111/j.1532-7795.2010.00719.x
Strum R. (2002). The effects of obesity, smoking, and drinking on medical problems and costs. Health Aff. (Millwood). 21, 245-53. Doi: 10.1377/hlthaff.21.2.245.
Topping D.L. and Clifton P.M. (2001). Short-chain fatty acids and human colonic function: roles of resistant starch and nonstrach polysaccharides. Physio.l Rev. 81, 1031-64. Doi: 10.1152/physrev.2001.81.3.1031.
Turnbaugh P.J., Ley R.E., Mahowald M.A., Magrini V., Mardis E.R. and Gordon J.I. (2006). An obesity-associated gut microbiome with increased capacity for energy harvest. Nature. 444, 1027-31. Doi: 10.1038/nature05414.
van de Pol J.A.A., van Best N., Mbakwa C.A., Thijs C., Savelkoul P.H., Arts I.C.W., Hornef M.W., Mommers M. and Penders J. (2017). Gut Colonization by
Methanogenic Archaea Is Associated with Organic Dairy Consumption in Children.
Front. Microbiol. 8, 355. Doi: https://doi.org/10.3389/fmicb.2017.00355.
Weaver G.A., Krause J.A., Miller T.L. and Wolin M.J. (1986). Incidence of methanogenic bacteria in a sigmoidoscopy population: an association of methanogenic bacteria and diverticulosis. Gut. 27, 698-704. Doi:
10.1136/gut.27.6.698.
Westerholm M., Roos S. and Schnürer A. (2010). Syntrophaceticus Schinkii gen. nov., sp. nov., an anaerobic, syntrophic acetate-oxidizing bacterium isolated from a mesophilic anaerobic filter. FEMS. Microbiology Letters 309, 100-4. Doi:
10.1111/j.1574-6968.2010.02023.x.
Zhang H., DiBaise J.K., Zuccolo A., Kudrna D., Braidotti D., Yu Y., Parameswaran P., Crowell M.D., Wing R., Rittmann B.E. and Krajmalnik-Brown R. (2009). Human gut microbiota in obesity and after gastric bypass. Microbiology. 106, 2365-2370. Doi: 10.1073/pnas.0812600106.