Changes in four societal
drivers and their potential to
reduce Swedish nutrient
Swedish Agency for Marine and Water Management report 2016:11 Date: 2016-05-16
Interim Director General Ingemar Berglund is legally responsible for the publication of this report. Cover image: Maja Kristin Nylander
ISBN 978-91-87967-20-7
Swedish Agency for Marine and Water Management Box 11 930, 404 39 Göteborg
www.havochvatten.se/en
Changes in four societal drivers and their potential to
reduce Swedish nutrient inputs into the sea
Are Vallin1 Anders Grimvall1 Eva-Lotta Sundblad1
Faruk Djodjic2
1Swedish Institute for the Marine Environment 2Swedish University of Agricultural Sciences
Preface
Eutrophication is a major issue in coastal areas and seas surrounding Sweden. Reducing the flow of nutrients from land is important to reach the Swedish environmental quality objective Zero Eutrophication, and to fulfill the Swedish commitments in the Baltic Sea Action Plan.
The discussion about reducing nutrient flows is often focused on measures in different sectors, e.g. regulation of agriculture or improvement of sewage systems. This report investigates the potential to reduce the Swedish nutrient inputs to the sea by influencing underlying societal drivers. Four phenomena are investigated: protein intake, horse keeping, unnecessary food waste, and phosphorus additives in food. For each of them the potential load reductions are presented and discussed.
This report was commissioned and financed by the Swedish Agency for Marine and Water Management. The study was carried out by the Swedish Institute for the Marine Environment, HMI. The authors are responsible for the content of the report.
Gothenburg, 16 May 2016
Authors’ preface
This report, that was commissioned and financed by the Swedish Agency for Marine and Water Management (SwAM), aims to assess the potential to reduce Swedish nutrient inputs to the sea by influencing underlying societal
phenomena or drivers. Four phenomena are investigated: protein intake, unnecessary food waste, phosphorus additives in food and horse keeping. For each phenomenon, potential load reductions are presented and discussed. Three of the four abovementioned phenomena are directly related to food, and keeping horses may interfere with food production because it represents an alternative use of agricultural land. This emphasis of food and land use in the present study can be justified by existing source apportionments of the waterborne input of nitrogen and phosphorus to Swedish marine waters. Agriculture is by far the largest anthropogenic source of both nitrogen and phosphorus. Moreover, emissions from both municipal and on-site sewage systems are primarily due to the phosphorus and nitrogen content of human faeces and urine.
Assessing potential changes in the pressure on the environment due to societal changes is an insurmountable task, unless a number of simplifying
assumptions are made. In contrast, our analysis goes deeper into society than conventional source apportionments. For example, the role of protein
consumption in nutrient loads to the sea is investigated by assessing substance flows along the entire product chain from the production of animal feed and food in agriculture to the input and output from sewage systems and retention in freshwater systems.
It is important to note that the potential reductions of nutrient loads presented in this report should be regarded as estimates of maximum reductions, given a number of constraints on the systems under consideration. The actual load reduction may be lower if the potential is not fully utilized due to goal conflicts or competing interests. In addition, it has to be taken into account that some changes in the input of nutrients to the sea may appear with substantial time lags or be strongly modified due to complex interactions in the current socio-economic systems. Nevertheless, we hope that this report may clarify which of the investigated societal phenomena can play a major role and which are of minor importance for the input of nutrients to the sea.
As a help to the reader, a list of technical terms and definitions is given in Appendix 1. Moreover, some important reading instructions are given at the end of Chapter 1.
The authors are grateful for constructive discussions with Emmelie Johansson and Philip Axe (SwAM) and valuable information from Erik Diurlin (Sweden Chemicals Agency), Patrik Eklöf and Jonas Hammarstrand (Swedish Board of Agriculture), and Kinna Jonsson (Kronfågel Inc.). We are also grateful for comments from a number of anonymous reviewers as well as from colleagues. However, the authors are solely responsible for the content and the conclusions of the report.
Are Vallin, Anders Grimvall, Eva-Lotta Sundblad and Faruk Djodjic Gothenburg, 4 May 2016
SUMMARY ... 11
SAMMANFATTNING ... 13
1INTRODUCTION ... 20
1.1 Background ... 20
1.2 Objectives ... 22
1.3 How to read the report ... 23
2INTAKE OF PROTEIN ... 24
2.1 Diet scenarios and self sufficiency ... 24
2.2 Methods to assess emissions ... 27
2.2.1 Life cycle assessments ... 27
2.2.2 Land use assessments ... 29
2.2.3 Assessment of emissions from sewage treatment... 31
2.3 Calculated emissions from various diets ... 33
2.3.1 Calculations based on Life Cycle Assessments ... 33
2.3.2 Calculations based on Land Use Assessments ... 36
2.3.3 Emissions from sewage systems ...38
2.4 Potential net load reduction ... 39
2.5 Summary in bullet points ... 40
3.UNNECESSARY FOOD WASTE ... 42
3.1 Scenario regarding unnecessary food waste ... 42
3.2 Methods to assess emission changes ... 42
3.2.1 Land use assessments ... 42
3.2.2 Assessment of emissions from sewage systems ... 44
3.3 Potential emission reductions ... 44
3.4 Potential net load reduction ... 45
3.5 Summary in bullet points ... 45
4.PHOSPHORUS ADDITIVES IN FOOD ... 46
4.1 Methods to assess emissions from phosphorus additives ... 47
4.2 Potential emission reductions ...50
4.3 Potential net load reduction ... 51
4.4 Summary in bullet points ... 52
5.HORSE KEEPING ... 53
5.1 Methods to assess emissions from horse keeping ... 53
5.1.1 Method to assess emissions from grazing land, leys and cropland ... 53
5.2 Estimated emissions from horse keeping ... 56
5.3 Potential emission reductions ... 56
5.4 Potential net load reduction ... 56
5.5 Summary in bullet points... 57
6.GENERAL CONCLUSION AND DISCUSSION ... 58
6.1 Calculated reductions of nutrient inputs into the sea ... 58
6.2 Limitations and uncertainty of the study ... 59
6.3 Concluding remarks ... 61
6.4 Future studies ... 62
REFERENCES ... 64
APPENDICES ... 67
1. Appendix: Technical terms used in the report ... 67
2. Appendix: Protein intake ... 69
3. Appendix: Retention maps ... 70
4. Appendix: Phosphorus additives ... 72
5. Appendix: Horse keeping: number of horses and areas for animal feed production and grazing ... 73
Summary
Large parts of the Baltic Sea and the Kattegat and Skagerrak suffer from eutrophication. Historically, this is due to due to an excessive input of nitrogen and phosphorus to the sea. In the present report, we focus on some of the root causes of this input and how changes in society can reduce the eutrophication pressure on marine environments. Four societal phenomena were selected for a closer analysis. Three of these phenomena - protein consumption, unnecessary food waste, and phosphorus additives in food - are related to the impact of food consumption on the sea. Horse keeping was also considered to be a relevant case study, as the number of horses in Sweden is growing rapidly
Assessing how changes in societal phenomena can influence the physical flow of nutrients into the sea is a complex task. The number of factors that can modify the final result is very large, and one type of changes in society is normally accompanied by a set of other changes. For example, changes in the consumption of food will inevitably have implications for land use. Moreover, many of the actors that influence the flow of substances and products through society operate on a market where the current activities are continuously modified or substituted by others.
In this report we tried to handle the complexity of the problems addressed by making simplifying assumptions. For example, we assumed that changes in food consumption will be identical or similar for Swedish produced and imported products and that agricultural land not any longer needed for food production will obtain a leaching coefficient corresponding to a theoretically derived background level. Keeping in mind that the load reductions presented here are maximum load reductions based on a number of assumptions our study allowed the following conclusions:
o A lower intake of protein-rich food products (25% less protein) could imply that, each year, about 200 tonnes less phosphorus and nearly 9.000 tonnes less nitrogen would reach the sea. Dietary changes can reduce the land area needed to ensure an adequate food supply but also lower the households’ burden on municipal and on-site sewage
systems. Replacing some animal protein with legumes can help to reduce the input of nutrients into the sea, but it is more important to reduce the total intake of protein-rich food.
o If phosphorus compounds added to various food products are substituted or eliminated, the annual input of phosphorus to the sea could be reduced by about 60 tonnes per year. This amount is of the same order of magnitude as the effect of the already implemented ban of phosphate in dishwasher detergents.
o Reducing the amount of unnecessary food waste is both desirable and feasible, and smaller amounts of waste imply that less land is needed for food production. However, the load reductions of 6 tonnes of phosphorus and 450 tonnes of nitrogen are relatively small compared to the effect of dietary changes.
o Horse keeping is a growing sector and source of nutrient emissions. Moreover, paddocks can locally cause relatively large emissions of nutrients. However, horse keeping cannot be regarded as a major driver of eutrophication because the leaching of nutrients from this form of land use is lower than the average for all agricultural land in Sweden. The potential load reductions are substantial compared to the remaining Swedish reduction targets in the Baltic Sea Action Plan. Altogether, the results of the present study suggest an increased emphasis on what and how much protein-rich food consumers eat and on the use of phosphorus additives in the food industry.
Sammanfattning
För att minska övergödningen i Östersjön och Västerhavet ska Sverige reducera belastningen av näringsämnen på haven enligt det svenska miljökvalitetsmålet Ingen övergödning och internationella
överenskommelser, framför allt Baltic Sea Action Plan. I en tidigare rapport från Havsmiljöinstitutet1 identifierades 17 samhällsfenomen av relevans för övergödningen. Fyra av dessa analyseras vidare här med utgångspunkt från befintliga data. De är:
o Konsumtion av animaliskt och vegetabiliskt protein. Konsumtionen av
proteinrika livsmedel har ökat och det ger upphov till utsläpp av
näringsämnen både under produktion och efter konsumtion. Kväve och fosfor läcker från jordbruket och hamnar även i avloppsvattnet från hushållen så att de bidrar till utsläpp från enskilda avlopp och reningsverk.
o Matsvinn. Ätbar mat som slängs i onödan orsakar onödiga emissioner i
produktionen.
o Tillsats av fosfor i livsmedel. Fosfor tillsätts som bland annat
stabiliseringsmedel och smaksättare och hamnar i avloppsvattnet. o Hästhållning. Antalet hästar ökar och detta medför emissioner vid
foderproduktion, samt vid beten och hagar där hästarna vistas. Syftet med rapporten är att kvantifiera potentialen för att belastningar på havsmiljön reduceras om dessa fenomen förändras. Slutsatserna bygger på beräkningar och antaganden och det har varit nödvändigt att göra många förenklingar vilket gör att resultaten inte ska tolkas som en förutsägelse (prediktion) av framtiden. Avsikten är istället att nå fram till riktvärden att förhålla sig till i vidare diskussion om de reella förändringar som kan ske i samhället. Denna kunskap är värdefull för att kunna identifiera och värdera nyttan av nya åtgärdsområden för havsmiljöförvaltningen.
De tre första fenomenen avser påverkan från livsmedel på emissioner av näringsämnen. Emissioner uppstår vid livsmedlens produktion men även vid avloppsreningsverk, eftersom mängderna kväve och fosfor som tillförs avloppssystemen är direkt kopplat till konsumtionen av livsmedel.
Konsumtion av animaliskt och vegetabiliskt protein. Proteinrika livsmedel
innehåller alltid betydande mängder kväve och i allmänhet också avsevärda mängder fosfor. I Sverige konsumeras i genomsnitt 174 gram (g) rått benfritt kött per dag (data från år 2009). Griskött är vanligast (79 g) men även
1
nötkött, kyckling och lamm konsumeras i betydande mängder (50, 40 respektive 5 g). Dessutom äts i genomsnitt 39 g fisk, 28 g ägg och 840 g mejerivaror och 15 g baljväxter. Mejerivaror inkluderar mjölk och ost och är här utryckt i mjölkenheter. Med baljväxter avses inslag i en diet som förutom bönor, ärtor och linser även innehåller baljväxter i förädlad form såsom tofu. Genom att undersöka hur emissionerna av näringsämnen förändras från nuvarande genomsnittliga kost till alternativa dieter är det möjligt att värdera nyttan för havsmiljön av att människor ändrar diet. Tre alternativa dieter med olika protein-produkter används i analyserna och dieterna benämns:
Rekommenderad diet (i linje med bland annat Livsmedelsverkets kostråd), Klimatsmart diet (byte från rött kött till kyckling) samt Mer Baljväxter.
I analysen av hur en minskad konsumtion av protein påverkar emissionerna användes två olika metoder. Först gjordes en sammanställning av data om emissioner av kväve och fosfor från befintliga Livscykelanalyser (LCA) av svenska livsmedel. Denna sammanställning visar att kött från nöt och lamm skapar större emissioner än fläsk och i sin tur kyckling, om man räknar utsläppen per kg protein från dessa livsmedel. Baljväxter, kyckling, mejeriprodukter och ägg har liknande utsläppsnivåer. Viktiga faktorer i beräkningarna är bland annat effektiviteten i omvandling från foder till protein och hur mycket kraftfoder (till exempel spannmål och raps) som djuren äter utöver foder från vallar (hö och ensilage) och naturbeten. Eftersom LCA-studierna är utformade för att visa på skillnader mellan produktionssystem och underliggande data är hämtade från ett fåtal gårdar använde vi inte dessa för att räkna på belastningar från svensk produktion som helhet. För detta syfte utgick vi istället ifrån hur jordbruksmarken används. Närmare bestämt tog vi hänsyn till hur stora landarealer som krävs för att producera foder till djur och livsmedel som kan konsumeras direkt av människan, samt hur läckaget från jordbruksmarken varierar med
markanvändningen. Kalkylen avsåg den andel av den svenska konsumtionen som produceras i Sverige.
När vi beräknade läckageförändringen som följer av de tre dieterna tog vi även hänsyn till var i Sverige en förändrad konsumtion av olika köttslag kan få genomslag, d v s var jordbruksmarkens markanvändning förändras och vilket läckage som kan följa av detta. Foderproduktionen för vart och ett av de animaliska livsmedlen antogs ske i samma produktionsområde som djuren föds upp. För den friställda marken, det vill säga den mark som inte längre behövs för livsmedelsproduktion om proteinintaget minskas eller på annat sätt förändras, antogs läckaget på sikt bli detsamma som för en gräsmark som inte plöjs, sås eller gödslas.
Beräkningar av de olika dieternas emissioner utfördes för två nivåer av det sammanlagda intaget av protein genom de produkter som ingick i kalkylen. Den nuvarande proteintaget via dessa produkter är 80 g per person och dag och vi räknade på såväl detta intag som en minskning till 60 g. Om man även tar hänsyn till konsumtion av spannmålsprodukter och annan mindre
proteinrik mat så får en genomsnittlig svensk idag i sig totalt ca 108 g protein per dag. Detta kan jämföras att världshälsoorganisationen WHO
rekommenderar att en person som väger 70 kg bör konsumera 58 g för att tillgodose kroppens grundläggande behov.
Förändrade dieter innebär även att det avloppsvatten som kommer till kommunala reningsverk och enskilda avlopp får en ändrad sammansättning. För att beräkna hur dieterna påverkar utsläppen från avloppssystemen användes officiell statistik avseende reningsgrader vid kommunala reningsverk2 samt tillgängliga schablonvärden för enskilda avlopp3. Emissioner från såväl svenska som importerade produkter inkluderades i beräkningarna.
Nedanstående tabell visar att kväve- och fosforbelastningen på havet kan reduceras avsevärt till följd av dietförändringar. Det finns även skillnader mellan de tre alternativa dieterna. Den viktigaste orsaken till att de
alternativa dieterna ger mindre kväve- och fosfor belastning än nuvarande diet är dock att det totala proteinintaget från de studerade livsmedelstyperna dragits ner från 80 till 60 g per person och dag.
Beräknade förändringar av kväve- och fosforbelastningen på havet, om nuvarande diet ersätts med alternativa dieter som alla minskar det sammanlagda intaget av protein via animaliska livsmedel och baljväxter från 80 till 60 g per person och dag.
MINSKNING AV KVÄVE- OCH FOSFORBELASTNINGEN PÅ HAVET F(TON/ÅR) REKOMMEND-ERAD DIET KLIMATSMART DIET MER BALJVÄXTER TOTAL N TOTAL P TOTAL N TOTAL P TOTAL N TOTAL P JORDBRUKETS MARKANVÄND-NING 3714 64 3947 71 5148 72 ENSKILDA AVLOPP 324 67 324 68 324 67 KOMMUNALA RENINGSVERK 3350 56 3350 58 3350 57 TOTAL 7387 187 7621 196 8822 196
Matsvinnets inverkan på belastningen av havet studerades med hjälp av data
över mängden onödigt matavfall från hushållen och hur detta avfall fördelar sig mellan olika huvudtyper av livsmedel. Kalkyler gjordes såväl baserat på emissioner i jordbruket som efter konsumtion. Vi antog att med ett reducerat svinn för svenskproducerade proteinrika livsmedel kan emissionerna från motsvarande jordbruksproduktion undvikas. Vidare antog vi att matsvinnet
2
Statistics Sweden (2014)
3
minskar med 50 procent, vilket är enligt med genomförandet av FNs
hållbarhetsmål (Sustainable Development Goals). Med dessa utgångspunkter beräknades att de årliga emissionerna av näringsämnen i jordbruket skulle kunna minska med 470 ton kväve och 6 ton fosfor. Efter att även retentionen i sjöar och vattendrag beaktats uppskattades belastningen på havet kunna minska med ca 300 ton kväve och 4 ton fosfor per år. Emissioner uppstår även på grund av att hushållen häller ut flytande mat i vasken. Efter en reduktion till hälften av emissionerna, och med beaktande av retentionen, blir resultatet att kvävebelastning kan reduceras med 50 ton och
fosforbelastningen med 2 ton per år.
Fosforhaltiga tillsatser i livsmedel utnyttjas av livsmedelsindustrin för att
stabilisera produkterna eller påverka deras smak. Vår utgångspunkt är att dessa tillsatser inte behövs för människors hälsa och därmed är potentialen för belastningsminskningar lika stor som dagens belastning från sådana tillsatser. Belastningen på havet uppstår när fosfor från maten hamnar i avloppsvatten och reningsverken inte renar allt ingående fosfor. En uppskattning baserad på den totala användningen av fosfortillsatser i den svenska livsmedelsindustrin indikerade att 28 ton fosfor når haven via enskilda avlopp och att 32 ton fosfor når haven efter att ha passerat kommunala reningsverk. Beräkningar gjordes även för ett urval produkter där tillsatsen av fosfor är känd: coladrycker, smältost, importerad kyckling och charkuterier. Den samlade konsumtionen av enbart dessa produkter uppskattades leda till att den årliga belastningen av fosfor på havet ökar med omkring 15 ton.
Hästhållning. Sverige har för närvarande ca 360.000 hästar och antalet ökar.
En genomsnittlig häst antas väga ca 420 kg, och behöva ca 1,5 kg grovfoder (torrvara) per 100 kg samt 0,3 kg spannmål per 100 kg häst och dag. Emissioner av kväve och fosfor sker från betesmarker samt åkermark som används för produktion av foder. Genom att bedöma hur mycket mark som krävs för att producera tillräckligt med foder för att föda alla Sveriges hästar samt vilka läckagekoefficienter som gäller för denna mark beräknades de sammanlagda emissionerna av fosfor och kväve från hästhållningens foderproduktion (se nedanstående tabell). Läckaget beräknades även från delar av rasthagarna som kan anses vara högriskområden för fosforläckage, det vill säga de områden där hästar utfodras och vistas stora delar av dygnet. Emissionerna av fosfor från sådana områden uppgår till drygt ca 11,5 ton per år (exkl. retention).
Emissioner av fosfor och kväve (ton per år) från foderproduktion samt hästhagar. TOTAL-P TOTAL-N FODER: HÖ, ENSILAGE INKL BETE 28 800 FODER: SPANNMÅL 22 940 HÄSTHAGAR 11.5 Uppgift saknas TOTAL 61 >1.740
På grund av brist på data är det svårt att kvantifiera de
belastningsminskningar som skulle kunna uppstå vid förändrad hästhållning. Två saker är dock värda att påpeka: Räknat per ytenhet är det genomsnittliga läckaget från hästhållningen mindre än för jordbruksmark i allmänhet. Lokalt kan utsläpp från intensivt betade marker och rasthagar vara stort vilket kan påverka vattendrag, sjöar och grundvatten. Vi gör antagandet att förbättringar kan nås genom åtgärder i rasthagar.
Total reduktionspotential. Tabellen nedan sammanfattar potentialen att
minska kväve- och fosforbelastningen på haven runt Sverige (med hänsyn till retention) genom att påverka olika samhällsfenomen.
Uppskattad potential (ton/år) att minska belastningen av fosfor och kväve på havet, uppdelad på bidrag från jordbruket respektive reducerad mängd avfall i avloppssystemen.
SAMHÄLLS -FENOMEN
POTENTIELL REDUKTION AV BELASTNING PÅ HAVEN N TON/ÅR P TON/ÅR JORD- BRUKS- PRODUK-TION AVLOPPS- RENINGS-VERK TOTAL JORD- BRUKS- PRODUK-TION AVLOPPS- RENINGS-VERK TOT AL PROTEIN-INTAG 5148 3674 8822 72 124 196 MATSVINN 300 50 350 4 2 6 TILLSATT FOSFOR – – – – 60 60
HÄSTHÅLL-NING n.a* – n.a* 5 – 5 TOTAL 5348 3724 9172 81 186 267
*inte tillgänglig uppgift
För att ge perspektiv på dessa beräknade belastningsminskningar, som avser alla bassänger kring Sveriges kuster, kan de jämföras med de minskningar från 2010 som behövs i Egentliga Östersjön. Enligt Sveriges åtagande i Helcom samarbetet (Baltic Sea Action Plan, BSAP) ska belastningen minska med 2.916 ton kväve och 400 ton fosfor till 2021. Om vattenmyndigheternas
ton kväve och 194 ton fosfor. Men programmen är bara föreslagna och ännu inte beslutade. De därefter återstående minskningskraven kan delvis avräknas mot åtgärdsöverskott I andra bassänger. Det innebär att kvävebetinget kan nås 2021, medan det då fortfarande återstår ca 80-100 ton fosfor att reducera. Denna rapports beräknade potentialer av minskat proteinintag är betydligt större än Sveriges återstående åtagande år 2010.
Av de fyra analyserade samhällsfenomenen har reduktionen av proteinintaget en större potential att reducera belastningen på havet än vad den tillsatta fosforn i maten har. Hästhållning och matsvinn har betydligt mindre potential.
Eftersom de samhällsfenomen som analyserats är komplexa har det varit nödvändigt att göra ett ganska stort antal förenklande antaganden för att beräkna belastningar och potentialer. Vi har exempelvis antagit att Sveriges självförsörjningsgrad och arealen öppen mark ska vara oförändrad. Vidare har vi antagit att reningsgraden i avloppssystemen kommer att vara oförändrad.
Utan tvekan skulle stora ändringar i hushållens dieter påverka Sveriges produktion av djurfoder och människoföda. Men det är knappast möjligt att förutsäga hur och var markanvändningen skulle förändras. Vi har därför inte spekulerat i marknadstrender eller ekonomiska konsekvenser för lantbrukare utan använt teoretiskt uträknade läckage koefficienter för att räkna ut möjliga näringsemissioner. Här finns också förenklingar som att läckagekoefficienten hålls oförändrad. En annan osäkerhetsfaktor är att förändringar i
jordbruksmark inte kan förväntas leda till omedelbara ändringar i läckage utan kan dra ut på tiden.
Effekterna för dietförändringar analyserades för tre alternativa dieter. Dieten Mer Baljväxter visade störst potential även om skillnaderna är ganska små. Skillnaderna kan eventuellt vara ännu mindre beroende på att
läckagekoefficienterna är mer osäkra för baljväxter än för andra grödor. Stor osäkerhet finns även i data som gäller tillsatt fosfor, matsvinn samt hästhållning. Men det är ändå tydligt att slutsatsen kvarstår att tillsatt fosfor i livsmedelsindustrin innebär ett betydande tillskott till avloppen. Det är av samma omfattning som de tidigare emissionerna från maskindiskmedel. Myndigheternas åtgärdsprogram för mindre övergödning fokuserar på så kallade end-of-pipe-lösningar. Vi vill hävda att det finns möjligheter att arbeta med alternativ. Istället för att ytterligare reglera hur lantbrukare ska undvika emissioner av näringsämnen skulle belastningen på havet kunna minskas genom att på olika sätt påverka vilken mat som efterfrågas av konsumenterna. Såväl konsumenter som producenter, upphandlare, detaljhandlare och opinionsbildare i media kan bidra. Då det finns en tydlig trend att öka proteinintaget finns en risk för att näringsämnesbelastningen på haven ökar om inte åtgärder vidtas.
I vår tidigare rapport har vi framhållit köttkonsumtionens roll för både klimatet och övergödningen av havet. I denna rapport, påvisas att det snarare är den totalt sett höga konsumtionen av proteinrika livsmedel som bör minska. Att byta kött mot grönsaker innebär oftast en reducerad belastning på haven, men ett högt intag av vegetabiliskt protein, såsom bönor, är inte nödvändigtvis bättre än att konsumera kött från betande djur eller kyckling.
1 Introduction
1.1 Background
Large parts of the marine waters surrounding Sweden have long suffered from eutrophication. Due to massive investments in improved sewage systems and improved agricultural practices the total input of nutrients into Swedish marine waters is now decreasing4. However, the current input of nitrogen (N) and phosphorus (P) to the sea is still too large. Together with internal loading of phosphorus from sediments it causes extensive, undesirable algae blooms and widespread oxygen depletion of bottom waters. This calls for additional measures so as to achieve the national Swedish environmental objective Zero
Eutrophication and to comply with EU directives and international
conventions about inland and marine waters.
Which measures can most efficiently reduce the eutrophication effects is the subject of a continuing debate. Existing and planned programmes of measures emphasize the need for further regulations of agricultural practices and further improvement of sewage systems. Some scientists advocate that it would be more cost-effective to address the internal loading of phosphorus from
sediments, for example by oxygenating stagnant deep waters. Here, we focus on a third aspect – the potential to reduce Swedish nutrient inputs to the sea by influencing underlying the societal phenomena or drivers of the flow of nutrients.
In a recently published report, the Swedish Institute for the Marine
Environment (SIME) listed seventeen activities or behaviours of individuals, organisations and institutions that were considered to influence the input of nutrients into the sea from land-based sources5. For each phenomenon, possible measures or policy instruments were listed. But no attempt was made to quantify their effects. In the present report, we perform a more comprehensive analysis of four of the phenomena: listed: intake of protein, unnecessary food waste, phosphorus additives in food, and horse keeping. The nutrient reduction scheme of the HELCOM Baltic Sea Action Plan (BSAP) stipulates how large the input reductions that are required to effectively address the eutrophication of the Baltic Sea, including the Kattegat. The current Swedish targets imply that that the yearly input from both land and air must be reduced by 9.240 tonnes N and 530 tonnes P by 20216. In 2010, the remaining reduction targets for the Baltic Proper were about 2.916 tonnes of N and 400 tonnes of P to be reached 2021. If the currently proposed but 4 Ejhed et al. (2014) 5 Sundblad et al. (2015) 6 HELCOM (2007,2013)
not decided programme of measures will be implemented, there is still a remaining demand of 1.866 tonnes of N and
194 tonnes of P. This can partly be handled by deducting over-achievements from Sweden in other parts of the Baltic Sea that have an inflow into Baltic proper. However, there would still be a reduction target of approximately 100 tonnes of P, while the N target by 20217. Targets for the period after 2021 are not specified, but the Swedish environmental objective Zero Eutrophication is not likely to be achieved by then.
The cited targets include both airborne and borne inputs, but water-borne inputs dominate strongly over airwater-borne inputs, especially for phosphorus. Therefore, this report will focus on the water-borne flow of nutrients from Swedish land-based activities. The input along this pathway has four major sources: agriculture land, municipal and on-site sewage systems, and industry. Compilations based on data from 2011 resulted in the following estimates of their respective contribution to the net load to the sea8:
o Agriculture: 960 tonnes of P and 34 800 tonnes of N;
o Municipal sewage systems: 270 tonnes of P and 15.500 tonnes of N; o On-site sewage systems: 190 tonnes of P and 1.700 tonnes of N; o Industry: 280 tonnes of P and 4.400 tonnes of N.
In this type of conventional source apportionments, emissions from agriculture and sewage systems are presented as separate sources although they have common factor, i.e. food. Almost all nutrient emissions in
agriculture are either directly associated with the production of food, or indirectly via production of animal feed or animal keeping. Moreover, nutrient emissions from both municipal and on-site sewage systems are primarily caused by the phosphorus and nitrogen content of human faeces and urine. From a societal perspective, it thus appears logical to regard the human demand for food as the key driver of the anthropogenic nutrient flows causing undesirable eutrophication of the Baltic Sea. This justifies that three of the selected societal phenomena (protein intake, unnecessary food waste and phosphorus additives in food) were directly related to food. Horse keeping was selected because it is a growing activity in Sweden, and represents an alternative use of agricultural land.
From a methodological point of view, it is a huge challenge to assess how changes in societal phenomena can influence the physical flow of nutrients into the sea. The number of factors that can modify the final result is very large, and one type of changes in society is normally accompanied by a set of
7
Swedish Agency for Marine and Water Management (2015)
8
other changes. For example, changes in the consumption of food will inevitably have implications for land use. Moreover, many of the actors that influence the flow of substances and products through society operate on a market where the current activities are continuously modified or substituted by others.
In this report we try to handle the complexity of the problems addressed by making several simplifying assumptions. Some factors will be held constant, and factors or processes that are considered to be of minor importance will simply be ignored or omitted. This may be regarded as a weakness. On the other hand, it can be an even larger simplification not to consider societal phenomena in search of the root causes of marine eutrophication.
1.2 Objectives
The objective of this report is to assess the potential to reduce Swedish nutrient inputs to the sea by influencing underlying societal phenomena or drivers. The four phenomena that were examined are named and defined as follows:
A. Intake of protein
The human consumption of animal and plant protein has increased over recent decades. Nutrient emissions occur both when this type of food is produced and after consumption, when human faeces and urine is handled in the sewage systems. Production of animal feed and animal keeping contribute to the total nutrient emissions from the intake of animal protein.
B. Unnecessary food waste
Not all food that is brought to households is eaten although it could have been consumed. Unnecessary food waste implies unnecessary production emissions.
C. Phosphorus additives in food
The use of phosphorus additives to stabilize or preserve food products or to enhance flavour is increasing. This type of additives implies an increased phosphorus burden on domestic sewage systems.
D. Horse keeping
The number of horses in Sweden is increasing rapidly. Nutrient
emissions occur both during production of animal feed and from grazed lands and paddocks.
The potential reductions of nutrient loads presented in this report should be regarded as estimates of maximum reductions of the input of nutrients to the sea. The actual load reduction can be lower if the potential is not fully utilized due to goal conflicts or competing interests. In addition, it has to be taken into account that some changes in the input of nutrients into the sea may appear with substantial time lags or be strongly modified due to complex interactions
in the current socio-economic systems. Nevertheless, we hope that this report can clarify which of the investigated societal phenomena that could play a major role and which are of minor importance for the input of nutrients into the sea.
1.3 How to read the report
Chapters 2 to 5 are devoted to calculations of potential load reductions due to changes in the underlying societal phenomena. Each of these chapters deals with one of the selected phenomena and contains descriptions of input data, calculation methods (including system boundaries and simplifying
assumptions) and presentations of the outcomes of the calculations in tables and bullet points. Chapter 6 is devoted to a wider discussion of what
conclusions that can be drawn from the results of the calculations in Chapters 2 to 5. This discussion includes assessments of strengths and weaknesses of the calculations performed.
2 Intake of protein
During the past decades, the average diet in Sweden has changed
significantly. The consumption of meat, fish, eggs and cheese has increased, and the per capita intake of animal protein is now about 55 percent higher than in 19709. Moreover, it is generally accepted that the present total intake of animal and plant protein (108 grammes/person/day) is considerably higher than that required from a nutritional point of view10,11. Considering that the agriculture and food sectors play a major role in the pressure on marine ecosystems, the environmental consequences of dietary trends need to be thoroughly analysed.
Research on societal drivers behind the ongoing climate change has drawn attention to relationships between the emissions of greenhouse gases and the production and consumption of meat, especially beef 12. It is generally
assumed to be climate-smart to switch to diets in which the direct consumption of plant protein plays a bigger role, because only a certain fraction of the energy in the animal feed is transferred to the final food products, and cows, goats and sheep also cause methane emissions. Here, we examine whether dietary changes might also be an option to achieve a lower input of phosphorus and nitrogen to the sea.
First, we present three diet scenarios in which the total intake of high-quality protein is lowered but the protein sources differ. Then we describe how we compute potential emission reductions and present the results of these calculations in tables and bullet points. Two methods are used for the calculations. The first is based on relatively simple amendments to already published life-cycle assessments (LCA) of protein-rich foods. The second is based on the assumption that changes in demand for certain food products will result in land use changes and those different crops have different leaching coefficients.
2.1 Diet scenarios and self sufficiency
The current average diet (year 2009) in Sweden includes a daily consumption of 174 grammes (g) meat, counted as raw bone-free meat13. Pork accounts for the largest amount (79 g), followed by beef, chicken and lamb (50, 40 and 5 g, respectively). In addition, the average diet includes 39 g fish, 28 g egg, 840 g
9
Swedish Board of Agriculture (2011)
10
The recommended daily intake according to WHO (2007) is 0.83 g per kg body weight.
11
Westhoek et al. (2011)
12 SOU 2005:51, Larsson (2015) 13
Swedish Board of Agriculture statistical database, National Food Agency (2012), Hallström (2014)
dairy products and 15 g beans. Dairy products here include milk, fermented milk products, and cheese, and cheese is converted to milk using a conversion factor of 1014. Beans stand for a broad range of products (beans, peas, lentils, tofu) which are summarized as legumes in Tables 1 and 2.
To illustrate how dietary changes may influence emissions of phosphorus and nitrogen to the environment, we consider three alternative diets that will be named Recommended, Climate-smart and High legume, respectively. The first is called Recommended because it adheres to national and international dietary guidelines proposing a lower consumption of processed meat
(primarily based on pork), red meat in general, and saturated fat. The
Climate-smart diet is similar to the Recommended one, but more specifically
focused on replacing beef for chicken, and beef is produced only as a by-product of milk. The High legume diet stands for a more extensive dietary change in which a considerable part of the meat is replaced by protein-rich legumes. Moreover, it should be noted that we only consider changes in the amount and sources of high-quality protein, i.e. protein that is needed to ensure an adequate intake of all essential amino acids15. The consumption of cereals, which is an important source of complementary amino acids with approximately 25 g protein/day and capita, is assumed to be unchanged. All three alternative diets include a daily milk consumption of 500 g and provide a total of 60 g high-quality protein. This is considerably less than in the current Swedish diet, which includes a daily intake of 840 g milk and provides 80 g high-quality protein. Further details of the four diets are shown in Tables 1 and 2. The first table shows amounts of protein-rich food products and the second shows amounts of high-quality proteins. The protein content of the food products was acquired from the Food Database at the National Food Agency and is shown in Table 25, Appendix 2.
14
Berlin (2002)
15
Legumes contain most, but not all, essential amino acids. Cereals can provide complementary amino acids so that the total protein intake will be adequate.
Table 1 Amount of food products (g per capita per day) providing high-quality proteins in the current Swedish diet and three alternative diets.
PRODUCT CURRENT DIET RECOMMENDED CLIMATE-SMART HIGH LEGUME BEEF (RAW,
BONE-FREE) 50 30 13 13 PORK (RAW,
BONE-FREE) 79 30 0 0 CHICKEN (RAW,
BONE-FREE) 40 66 107 0 LAMB (RAW,
BONE-FREE) 5 2 0 0 DAIRY PRODUCTS (MILK EQUIVALENTS*) 840 500 500 500 FISH (SALMON, RAW, BONE-FREE) 39 39 39 39 EGG (RAW) 28 28 28 28 LEGUMES (DRY SUBSTANCE) 14.5 14.5 14.5 132
* All milk products, including cheese, are expressed as milk.
Table 2 Daily intake of protein (g per capita per day) through food products providing high-quality proteins in the current Swedish diet and three alternative diets. PRODUCT CURRENT DIET RECOMMENDED CLIMATE-SMART HIGH LEGUME BEEF 11 7 3 3 PORK 15 6 0 0 CHICKEN 10 16 26 0 LAMB 1 0.4 0 0 DAIRY PRODUCTS 29 18 18 18 FISH 7 7 7 7 EGG 3 3 3 3 LEGUMES 3 3 3 29 TOTAL 80 60 60 60
The Swedish self-sufficiency of the protein-rich food products was assumed to be the same in the current and Recommended diets (Table 3), i.e. the lower consumption of certain food products in the Recommended diet was assumed to influence the consumption of imported and Swedish-produced food to the same extent. In the Climate-smart and High legume diets, we assumed a higher sufficiency of beef, legumes and chicken. The complete self-sufficiency of beef in those two diets can be attributed to our assumption that beef was then assumed to be exclusively a by-product of Swedish milk
production. When emissions from the High legume diet were assessed, we assumed that all legumes required to replace animal protein sources will be
produced in Sweden, and this resulted in a self-sufficiency of 94 percent (Table 3).
Table 3 Sweden’s self-sufficiency (in percent) of selected protein-rich food products in the current diet together with our assumptions regarding the self-sufficiency in the three alternative diets. Data for the current diet were procured from the Swedish Board of Agriculture16.
PRODUCT DIET CURRENT DIET RECOMMENDED CLIMATE-SMART HIGH LEGUME BEEF 58 58 100 100 PORK 76 76 n.a.* n.a.* CHICKEN 71 71 76 n.a.* LAMB 39 39 n.a.* n.a.* DAIRY PRODUCTS 100 100 100 100 EGG 87 87 87 87 LEGUMES 50 50 50 94
*Not applicable
2.2 Methods to assess emissions
Emissions of phosphorus and nitrogen during the production of food were assessed using two different approaches: Life Cycle Assessments (LCAs) and Land Use Assessments (LUAs). LCAs were used to identify the most crucial phases of existing product chains and to compare nutrient emissions caused by different products or production systems. LUAs were used to assess possible reduction in food-related emissions caused by dietary changes that are assumed to drive large-scale changes in land use. Emissions of nutrients from municipal sewage systems and on-site sewage systems were also calculated for the diets.
2.2.1 Life cycle assessments
Table 4 summarizes emissions to air and water reported in Swedish LCA studies. All quantities are expressed as grammes (g) of nitrogen or
phosphorus per kilogramme (kg) product and include all emissions occurring at the farm stage of the food product’s life cycle. Moreover, they refer
primarily to Swedish emissions, but include emissions from imported animal feed to the extent that such import is common practice. For example, some soy beans are imported to the pork and chicken production. Ammonia (NH3 -N) emissions represent losses to air from manure, whereas emissions of nitrogen oxides (NOx-N) are due to the use of tractors or other agricultural machinery. Emissions to water are calculated losses from the root zone and
16
are expressed as nitrate (NO3-N) or total nitrogen. Phosphorus emissions to water are expressed as phosphate phosphorus (PO4-P) or total phosphorus. Table 4 Food-related emissions of nutrients to air and water expressed as g of nitrogen or phosphorus per kg product. For meat, emissions are given per kg carcass weight17, and for dairy products emissions are given per litre
energy-corrected milk (ECM).
PRODUCT NUTRIENT EMISSIONS PER AMOUNT OF PRODUCT LITERATURE SOURCE AMMONIA (NH3-N) NITROGE N OXIDES (NOX-N) NITRAT E (NO3 -N) TOTAL NITROG EN PHOSP HATE (PO4-P) TOTAL PHOSP HORUS BEEF (SUCKLER, ORGANIC) 25.0 5.0 72.3 0.087 Cederberg and Nilsson, 2004 BEEF (MILK BY-PRODUCT) 16.5 15.7 111.9 0.093 Cederberg and Darelius, 2000 PORK 6.9 6.4 56.4 0.044 Ahlmén, 2002 CHICKEN 7.0 2.7 23.1 0.036 Ahlmén, 2002 LAMB 18.2 86.9 0.220 Wallman et al., 2011 DAIRY PRODUCTS 1.4 1.3 3.8 0.010 Cederberg et al., 2007 EGG 2.7 3.9 17.1 0.041 Sonesson et al., 2008 LEGUMES (SOUTHER N SWEDEN) 0.2 0.7 22.1 0.018 SIK Animal feed database, Flysjö et al., 2008 LEGUMES (WESTERN SWEDEN) 0.2 0.5 15.8 0.019 SIK Animal feed database, Flysjö et al., 2008 LEGUMES (EASTERN SWEDEN) 0.2 0.5 12.5 0.021 SIK Animal feed database, Flysjö et al., 2008
The LCA studies cited indicate that there are substantial differences in nutrient emissions between the meat products studied. Some of these differences can be explained by the fact that chicken more efficiently than pigs, sheep and cows can convert the nitrogen in the animal feed into meat protein. However, before drawing far-reaching conclusions, one should take
17
Carcass weight (also called dressed weight) refers to the weight of an animal after removing all the internal organs and oftentimes the head as well as less desirable portions of the tail and legs.
into account that each of the LCA studies refer to a specific production system that is not necessarily representative for the current average production in Sweden. Nor do the cited LCA studies include any estimates of the retention of nitrogen and phosphorus along the pathway from farm to sea. This calls for complementary methods in order to assess emissions and load reductions for the whole of Sweden.
Closer examination of the emission estimates in Table 4 shows that the reported nitrogen emissions directly to water (expressed as NO3-N or total nitrogen) are considerably larger than emissions to air (expressed as NH3-N or NOx-N). In addition, a substantial fraction of the ammonium emitted to air from Swedish agriculture will be deposited on land and subject to a
considerable retention before it reaches aquatic environments. For
phosphorus, airborne pathways play an even smaller role in the input to the sea18. Consequently, it can be justified to focus on water-borne pathways in a study that primarily aims to distinguish between large and small potentials for reducing the input of nutrients to the sea. This motivates the land use assessment methodology described in the following section.
2.2.2 Land use assessments
Here we assume that dietary changes cause changes in land use, which in turn cause changes in production emissions. If, for example, the consumption of meat is reduced, the area needed to produce animal feed will be smaller, and the leaching of nutrients will be lower, provided that the alternative crop or land use has lower leaching coefficients. Calculations of the total change in production emissions ( ProdEmdiet ) from Swedish agriculture when an alternative diet is substituted for the current one were carried out using the formula
I) ProdEmdiet = ∑ ( Areacrop,region * Leachcrop,region) where
Areacrop, region = change in area demand per crop and production region
Leachcrop, region = area-specific leaching/emission coefficient by crop and
production region
and the sum was taken over all combinations of food products in the diets under consideration, and crops and agricultural production regions involved in the production of each food product. Emission changes in countries other than Sweden were outside the scope of the present study.
18
The estimated area demand per unit of beef, pork, lamb, chicken and milk in Sweden was derived from a publication by Cederberg and co-workers19, and the area demand for legumes was derived from hectare yields published by the Swedish Board of Agriculture. In the assessment of emissions, we assumed that land no longer used to produce animal feed is converted to a land use for which the leaching coefficients are identical to the background values published in the latest available Pollution Load Compilation (PLC) for HELCOM20. We do not specify exactly how that land is used. However, the leaching coefficients cited were derived for a grassland that is neither
ploughed nor fertilized, but kept as a monoculture. For the sake of simplicity, it will thus be called permanent grassland.
Leaching of phosphorus and nitrogen from agricultural land varies
substantially between different agricultural production regions21 in Sweden. The type of production is also unevenly distributed. Therefore, we used data regarding the number of animals and area of agricultural land in different production regions in order to select a typical region for each product22. For beef and dairy products, we selected production region 7 (essentially the counties of Kronoberg and Jönköping), for pork and chicken region 2 (essentially the counties of Blekinge and Kalmar and the eastern part of Skåne), and for lamb region 3 (Öland and Gotland). The legumes were assumed to be cultivated in production region 2, 3 and 7 in proportion to the land area freed due to changes in demand for the current crops.
Tables 5 and 6 summarize the area-specific leaching coefficients used in our calculations. More specifically, we used leaching coefficients for different crops and soil types and then computed average leaching coefficients for the regions and products selected. Production of animal feed and animal keeping was assumed to take place in the same region. Concentrate feed for cattle was modelled as a mix of autumn wheat, rye and barley. Legumes for human consumption were assumed to have an average leaching coefficient equivalent to the average for all crops23. This assumption will be commented in the discussion (Chapter 6). 19 Cederberg et al. (2009) 20 Johnsson et al. (2008) 21
In official statistics Sweden is divided into 18 production regions.
22
Data on animals and agricultural area in the 18 agricultural production regions in Sweden were obtained from Statistics Sweden (SCB). Personal communication with Rolf Selander and Ylva Olsson, respectively.
23
Leaching coefficient for legumes has not been published because of the small area presently used for such products.
Table 5 Phosphorus leaching coefficients (kilogrammes P/hectare/year) for typical Swedish production regions in 2005. Source: Johnsson et al., 2008.
PRODUCTION REGION 2 (BLEKINGE, KALMAR) 3 (ÖLAND, GOTLAND) 7 (KRONOBERG, JÖNKÖPING) LEY 0.22 0.07 0.28 PERMANENT GRASSLAND 0.10 0.05 0.12 CEREALS 0.29 0.11 0.41 LEGUMES 0.26 0.09 0.31
Table 6 Nitrogen leaching coefficients ((kilogrammes N/hectare/year) for typical Swedish agricultural production regions in 2005. Source: (Johnsson et al., 2008). PRODUCTION REGION (COUNTIES) 2 (BLEKINGE, KALMAR) 3 (ÖLAND, GOTLAND) 7 (KRONOBERG, JÖNKÖPING) LEY 14 9 13 PERMANENT GRASSLAND 5 4.4 6 CEREALS 33 29 32 LEGUMES 27 18 18
When assessing emissions related to the Recommended diet, we assumed that areas no longer needed for the production of pork, beef and milk (or animal feed for such production) are primarily used for the production of chicken feed and secondly replaced by permanent grassland. The Climate-smart diet implies further conversion of areas not needed for beef and pork production into permanent grassland or the production of chicken feed. The High
legumes diet also implies that areas used for production of chicken feed are
converted into cropland for legumes or, secondly, to permanent grassland.
2.2.3 Assessment of emissions from sewage treatment
Nutrients discharged from sewage systems originate almost exclusively from the food consumed. Phosphorus entering the human body via food
contributes to several processes in the body, but is not, to any great extent, accumulated in adults. Therefore, we assumed that, for this element, the inflow into treatment plants equalled the intake via food. For nitrogen, the inflow into treatment plants was assumed to be 15 percent lower, because substantial amounts can be released from the human body via perspiration24. The amount of nitrogen in food is directly related to the protein content (about 160 g N per kg protein according to the Food Database at the National
24
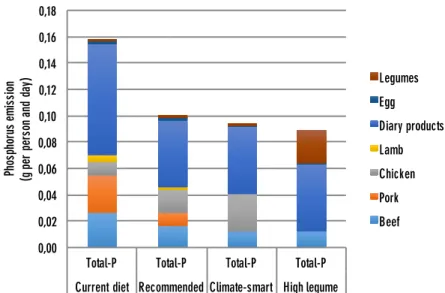
Food Agency). In contrast, the amount of phosphorus can vary strongly among food products with similar protein content (Figure 1). Milk, in particular, has a relatively high phosphorus content.
Figure 1 Phosphorus content of protein-rich food products.
On average, municipal sewage systems are far better than on-site systems at removing nutrients. Table 7 shows the removal efficiency we assumed for the two types of treatment systems. Data on municipal plants was obtained from the Swedish Environmental Protection Agency. For on-site systems, average removal efficiencies and the number of person equivalents connected to such systems, were derived using methods and data published by SMED25.
25
Table 7 Average removal efficiency of phosphorus and nitrogen for different types of sewage treatment systems in Sweden.
CATEGORY AVERAGE REMOVAL EFFICIENCY (PERCENT) PERSONS INVOLVED (PERSON-YEAR EQUIVALENTS26) SOURCE NITROGEN PHOS-PHORUS ON-SITE SEWAGE SYSTEMS 39 20 787 119 Olshammar et al. (2015) MUNICIPAL SEWAGE SYSTEMS 60 95 9 006 053 SCB (2014)
The impact of dietary changes on the total nutrient emissions from Swedish sewage systems was assessed by computing differences in emissions between the current and three alternative diets. More specifically, such changes in sewage emissions ( SEmdiet) were computed using the formula
II) SEmdiet = ∑ Consproduct * Concproduct * PEqsystem *
(100-REffsystem)/100
where the sum was taken over all food products and sewage systems, Consproduct = change in per capita consumption of the product per person
Concproduct = nutrient concentration (N or P) in the product
PEqsystem = number of person equivalents connected to the sewage system
(on-site system or municipal sewage treatment plant)
REffsystem = nutrient removal efficiency (%) in the sewage system
and the sum was taken over all products included in the investigated diet and the two types of sewage systems. In particular, it may be noted that, for each type of sewage system, the output is proportional to the input.
2.3 Calculated emissions from various diets
2.3.1 Calculations based on Life Cycle Assessments
The idea of reducing nutrient emissions by changing diets originates from scientific reports claiming that that some food products have less
environmental impact than others. In general, the evidence comes from LCAs in which emissions per amount of product are estimated. Here, we compute emissions per amount of protein in the food consumed (protein-normalized emissions).
26
We used person-year equivalents because the number of full-time users of the systems is smaller than the number of persons formally connected.
Figures 2 and 3 illustrate that nutrient emissions per kg protein can vary strongly between products. Especially high emissions are attributed to beef and lamb, whereas legumes seem to cause lower emissions than all the animal products investigated. The high emissions of phosphorus and nitrogen from lamb may be attributed to the fact that a large land area was needed for each unit of meat in the production systems analysed. In addition, the utilized leaching coefficient for phosphorus was high in comparison with coefficients used in other studies27.
Figure 2 LCA-based estimates of nitrogen emissions per kg protein in selected food products. The emission estimates refer to losses to air and water where animal feed and food are produced and do not take into account the fate of the substances emitted outside the farm.
27
In the lamb meat study, the leaching coefficient for P was 0.52 kilogrammes per hectare and year (kg/ha/yr), compared to levels around 0.3 in other studies.
Figure 3 LCA-based estimates of phosphorus emissions per kg protein in selected food products. The emission estimates refer to losses to air and water where animal feed and food are produced and do not take into account the fate of the substances emitted outside the farm.
By combining the emission data in Figures 2 and 3 with the self-sufficiency data in Chapter 2.2, emissions from Swedish food products and diets were quantified. The graphs in Figures 4 and 5 show the calculated per capita emissions for the current diet and the three alternative diets (Recommended,
Climate-smart and High legume).
Figure 4 Nitrogen emissions attributed to the current and three alternative diets. The alternative diets have a lower total intake of high-quality protein (60 g/person/day) than the current diet (80 g/person/day).
Figure 5 Phosphorus emissions attributed to the current and three alternative diets. The alternative diets have a lower total intake of high-quality protein (60 g/person/day) than the current diet (80 g/person/day).
Considering that the calculated emissions differ so much between the current and alternative diets, it would be tempting to conclude that the nutrient emissions from Swedish food production could be approximately halved if the current production were to be adapted to a different diet. However, two circumstances are worth mentioning. First, the land area freed will continue to leach. Second, a lower intake of high-quality proteins would probably imply a higher intake of other food products. The next section that follows presents the results of the land use assessments, which more specifically address the lower demand for agricultural land for food production.
2.3.2 Calculations based on Land Use Assessments
Figure 6 summarizes our estimates of the land area needed for the Swedish-produced parts of the current and alternative diets. As can be seen, all three scenarios of alternative diets imply a substantially lower demand for regularly ploughed land (crop land or ley). However, the differences between the three alternatives are comparatively small.
Figure 6 Land area demand for the Swedish-produced parts of the current and alternative diets. The regularly ploughed area consists of crop land and ley. The area freed under the alternative diets is neither ploughed nor fertilized.
Closer examination of the area demand for the different diets showed that a reduced beef and milk production (as in the Recommended diet) implies a lower demand for ley and permanent grasslands. A reduced production of pork and chicken (as in High Legume diet) implies a lower demand for crop land, but this change in land use is partly counteracted by a higher production of legumes (see Figure 7).
Figure 7 Demand for agricultural land induced by the current and alternative diets.
How large the emission reductions would be that could be achieved if the current Swedish production of protein-rich food is modified to fit alternative diets depends strongly on the assumptions made regarding emissions from land no longer used for food or animal feed production. Table 8 shows how large reductions that could be achieved in the whole of Sweden, if the freed agricultural land is assumed to have the same leaching coefficient as
permanent grassland, and the selected production areas are representative of the entire Swedish production.
Table 8 Estimated emission reductions (tonnes/year) in Sweden if the current diet is replaced by alternative diets and land no longer used for food or animal feed production is assumed to have the same leaching coefficient as permanent grassland. EMISSION REDUCTIONS RECOMMENDED DIET CLIMATE-SMART DIET HIGH LEGUME DIET TOTAL-N 5800 6300 8100 TOTAL-P 97 108 110
As can be seen, all three of the alternative diets have a considerable potential to induce lower emissions during animal keeping and production of animal feed. There are also differences between the alternative diets. However, these differences should not be exaggerated.
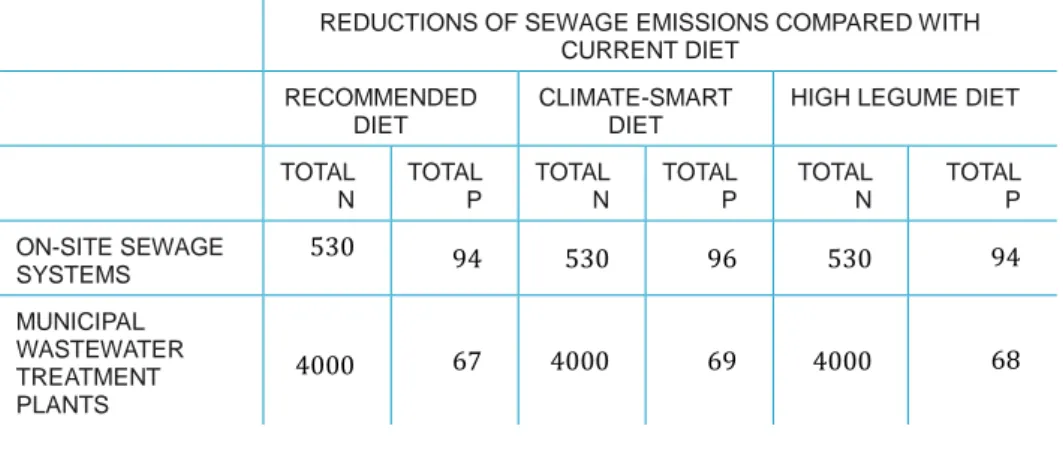
2.3.3 Emissions from sewage systems
Emissions from sewage systems were computed for the entire consumption of protein-rich food, regardless of the self-sufficiency of the products
investigated. Table 9 provides an overview of the potential emission
reductions that could be achieved by replacing the current diet with each of the alternative diets. The reduction of nitrogen emissions was the same for all three alternative diets, because they contain the same amount of protein and the nitrogen content is proportional to the protein content. The reduction of phosphorus emissions varied slightly between the three diets, because some protein-rich food products have an elevated phosphorus content.
Table 9 Estimated reductions in emissions (tonnes/year) from sewage systems due to dietary changes.
REDUCTIONS OF SEWAGE EMISSIONS COMPARED WITH CURRENT DIET
RECOMMENDED DIET
CLIMATE-SMART DIET
HIGH LEGUME DIET TOTAL N TOTAL P TOTAL N TOTAL P TOTAL N TOTAL P ON-SITE SEWAGE SYSTEMS 530 94 530 96 530 94 MUNICIPAL WASTEWATER TREATMENT PLANTS 4000 67 4000 69 4000 68
As already noted, the formula used to compute emission reductions implies that, for each type of sewage system, changes in the output are proportional to changes in the output. This was deemed to be a reasonable assumption as long as the composition of the inflow is not changed too dramatically.
2.4 Potential net load reduction
The Pollution Load Compilations for HELCOM assessments28 take into account that the net input of nutrients to the sea can be substantially smaller than the sum of all emissions measured at their respective sources. As can be seen in Figures 9 and 10 (Appendix 3) the retention of nutrients is particularly large for emissions occurring upstream of the major lakes in Sweden. In the present study, we used estimates of the gross and net loads of phosphorus and nitrogen29 to derive average retention coefficients for each of the emissions (Appendix 2, Table 26). The net reduction of the input of nutrients to the sea is summarized in Table 10.
28
Swedish Environmental Protection Agency (2008)
29
The relative difference between gross and net loads as reported in Swedish Environmental Protection Agency (2008) is used as the average retention.
Table 10 Estimated changes in net loads of phosphorus and nitrogen (tonnes/year) for alternative diets compared to the current diet.
NET REDUCTION OF NUTRIENT INPUTS TO THE SEA RECOMMENDED
DIET
CLIMATE-SMART DIET
HIGH LEGUME DIET TOTAL N TOTAL P TOTAL N TOTAL P TOTAL N TOTAL P AGRICULTURAL PRODUCTION 3714 64 3947 71 5148 72 ON-SITE SEWAGE SYSTEMS 324 67 324 68 324 67 MUNICIPAL SEWAGE SYSTEMS 3350 56 3350 58 3350 57 TOTAL 7387 187 7621 196 8822 196
Detailed analysis of the spatial variation in nutrient retention was outside the scope of the present study. However, a few facts are worth mentioning. In particular, it might be noted that the current production of chicken and pork is concentrated to areas where the retention is relatively low. In production region 2 (Eastern Skåne and the counties of Blekinge and Kalmar), which was considered representative of such production, the retention is usually less than 10 percent for phosphorus and in the range of 21–40 percent for nitrogen (Figure 9 and Figure 10 in Appendix 3). In production region 7 (the counties of Jönköping and Kronoberg), which was used as a model for beef production, the nitrogen and phosphorus retention vary substantially from low (0–10 percent) to high (60–80 percent).
2.5 Summary in bullet points
In this section, the results of the calculations performed are summarized in bullet points with brief explanations and comments. A wider discussion of what conclusions that can be drawn will follow in Chapter 6.
Dietary changes can substantially influence the input of nutrients to the sea along two major pathways: (i) leaching of nutrients from agricultural land to inland and coastal waters, and (ii) input of sewage from households to on-site and municipal sewage treatment systems.
The present study showed that both pathways play a substantial role. However, the time until the input into the sea has changed can vary strongly with the pathway. Emissions from sewage systems respond immediately to changes in the input from households, whereas changes in the leaching of nutrients from agricultural land can occur with time lags ranging from years to decades after the land use has changed.
Relatively moderate decreases in the consumption of protein-rich food (meat, dairy products, eggs etc.) can have large effects on the total nutrient emissions during production of food and animal feed.
Our compilation of already published LCA analyses indicated that the nutrient emissions caused by the Swedish production of protein-rich food could be radically reduced (by 50 and 40 percent for nitrogen and
phosphorus, respectively) if the consumption of high-quality proteins is reduced by 25 percent. LUA analyses confirmed the crucial role of the amount of high-quality proteins in our diet.
Dietary changes can directly reduce the phosphorus and nitrogen burden on wastewater treatment systems, and thereby also the emissions from such systems.
The nitrogen burden is almost proportional to the overall protein intake. The phosphorus burden is also positively correlated to the protein intake, but the phosphorus-to-protein ration as higher for dairies than meat.
Substituting legumes for animal protein can have a substantial impact on nutrient emissions but lowering the overall protein intake is more
important.
The High legume diet produced the lowest nitrogen and phosphorus
emissions among the three investigated alternative diets. However, reducing the total daily intake of high-quality protein from 80 to 60 g had a greater influence on the emissions from food and animal feed production. If emissions from sewage treatment systems are also taken into account, our calculations indicate that reducing the total intake of proteins is more important than substituting legumes for meat.
There are substantial differences in nutrient emissions among the investigated animal products.
The differences in nutrient emissions depend largely on two factors: how efficiently animals transform animal feed to protein and the requirement for ploughed land for animal feed production. Chickens can, more efficiently than pigs, transform animal feed into protein for human consumption, and pigs are more efficient than cows and sheep. On the other hand, cows and sheep get a large share of their feed from grazed land.
3. Unnecessary food waste
Unnecessary food waste is defined as food thrown away that could be eaten if it had been handled correctly. An example is food that is thrown away only because the “consume before” date has passed irrespective of the quality of the food. The total amount of food that is thrown away in Sweden
(approximately 1.100.000 tonnes/year) comes from the food industry, restaurants, retailers, caterings and households. The food waste from
households thrown as garbage is estimated to be 720.000 tonnes per the year in 2014, of which 30 percent is considered unnecessary30. The major fraction (60 percent) of this unnecessary food waste consists of carbohydrate-rich products, such as vegetables, pasta, potatoes and bread31. Meat and fish contribute about 10 percent. In addition, nearly 250.000 tonnes solid and fluid waste is poured into the sink yearly32. In this section, we analyse the potential to reduce the input of nutrients into the sea by reducing the amount of unnecessary waste from protein-rich food.
3.1 Scenario regarding unnecessary food waste
Changes in nutrient inputs into the sea were assessed for a scenariopresuming a 50 percent reduction from the 2015 levels of unnecessary food waste. This scenario is in line with the Sustainable Development Goals to be reached by 2030. Our analysis focused on waste generated in households. Moreover, it was restricted to protein-rich foods (meat, eggs, dairy products and legumes) produced in Sweden.
3.2 Methods to assess emission changes
3.2.1 Land use assessments
Changes in emissions of production due to lower amounts of unnecessary food waste were calculated using the previously described land use assessment technique (see section 2.3.2). This technique is based on the assumption that changes in food consumption drive changes in land use, which in turn cause changes in emissions. More specifically, we assumed that fifty percent of the land presently used to produce food that ends up as waste will be converted so that the leaching coefficient equals that of permanent grassland.
The current amount of unnecessary solid food waste thrown as garbage was assumed to be 220.000 tonnes per year, or 67 g per capita per day33. To this
30
National Food Agency, Sweden (2016)
31
Andersson (2012)
32
26 kg per year and capita
33