Department of Forest Economics
Customers’ perceptions of self-service
quality
– A qualitative case study in the Swedish
banking sector
Kundernas uppfattning om självbetjäningskvalitet
Simon Winter
Master Thesis • 30 hp
Forest Science Programme Master Thesis, No 13 Uppsala 2019Customers’ perceptions of self-service quality
– A qualitative case study in the Swedish banking sector
Kundernas uppfattning om självbetjäningskvalitet
Simon Winter
Supervisor: Torbjörn Andersson, Swedish University of Agricultural Sciences, Department of Forest Economics
Examiner: Cecilia Mark-Herbert, Swedish University of Agricultural Sciences, Department of Forest Economics
Credits: 30 hp
Level: Advanced level, A2E
Course title: Master thesis in Forest Science
Course code: EX0923
Programme/education: Forest Science Programme
Course coordinating department: Department of Forest Economics
Place of publication: Uppsala
Year of publication: 2019
Title of series: Master Thesis
Part number: 13
Online publication: https://stud.epsilon.slu.se
Keywords: attributes, dimensions, forest and agricultural customers, self-service technology SST, SSTQUAL-scale
attribut, dimensioner, självbetjäningsteknik, skogs- och lantrbrukskunder, SSTQUAL-skala
Swedish University of Agricultural Sciences
Faculty of Forest Sciences Department of Forest Economics
ii
Abstract
Self-service technology, SST, enables the customer to interact with a service without contact with an employee. This technology has several benefits for both customers and businesses and is a powerful tool to achieve long term success. So the quality of an SST becomes crucial for businesses in order to achieve long term success. Therefore, it becomes essential to measure the quality of an SST.
The Self-service quality scale (SSTQUAL scale) purpose is to measure SST quality in several industries. The developer of this instrument, Lin and Hsieh (2011) encouraged others to do further research on the SSTQUAL scale since it is a continuous process and may change over time. Previous studies have shown that the SSTQUAL scale within the Romanian baking sector is revised. Therefore, the focus of this study will be to evaluate how service quality and the SSTQUAL scale fits in the Swedish banking sector. The study aims to identify how forest and agricultural customers in the Swedish banking sector perceive SST quality. The work is structured based on a specific case in a Swedish bank to capture how the customer perceives SST quality in these settings, and thus, the aim fulfills.
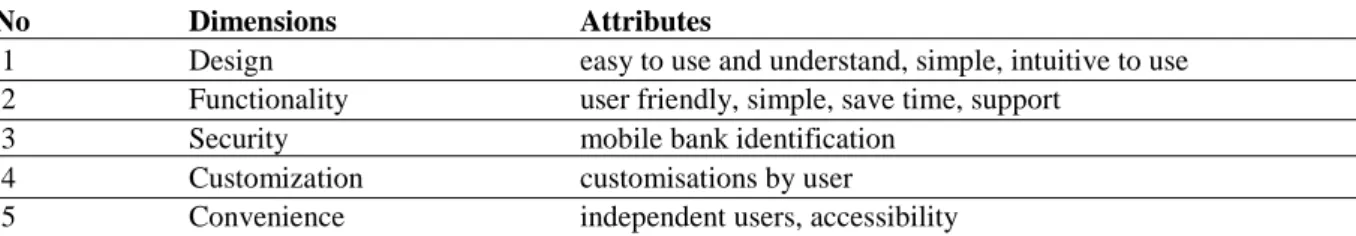
The result from this study reveals that the respondents perceive five dimensions, design, functionality, security, customization, and convenience as crucial for the quality of an SST in the Swedish banking sector. The conclusions are that the customers perceive design, functionality, and convenience as the most crucial dimensions for SST quality. Further research is needed for a generalization of the result and to determine if the SSTQUAL scale is an instrument suitable for measuring SST quality in the Swedish banking sector.
Key words: attributes, dimensions, forest and agricultural customers, self-service technology
iii
Sammanfattning
Självbetjäningstjänster, SST, gör det möjligt för kunden att interagera med en tjänst utan kontakt med en ansälld. Denna teknik har flera fördelar för både kunder och företag och är ett kraftfullt verktyg för att uppnå långsiktig framgång. Kvaliten på en SST är avgörande för att uppnå en långsiktig framgång för företaget. Därför blir det viktigt att mäta kvaliten på en SST. Självbetjäningsteknik kvalitet skalan (SSTQUAL skalan) mäter SST-kvalitet i flera branscher. Utvecklarna av detta instrument, Lin och Hsieh uppmuntrade andra att göra ytterligare forskning på SSTQUAL skalan eftersom det är en kontinuerlig process som kan förändras över tid. Tidigare studier har visat att SSTQUAL skalan inom den Rumänska banksektorn har reviderats. Därför fokuserar denna studie att utvärdera hur servicekvalitet och SSTQUAL skalan passar i den Svenska banksektorn. Studien syftar till att identifiera hur skogs och lantbrukskunder i den Svenska banksektorn uppfattar SST-kvalitet. Arbetets struktur är baserat på ett specifikt fall i en svensk bank för att fånga hur kunden uppfattar SST-kvalitet inom dessa ramar och därmed uppnå målet med studien.
Resultatet från denna studie visar att respondenterna uppfattar fem dimensioner, design, funktionalitet, säkerhet, anpassning och tillgänglighet som avgörande för kvaliten på en SST i den svenska banksektorn. Slutsatserna är att kunderna uppfattar design, funktionalitet och tillgänglighet som de mest avgörande dimensionerna för SST-kvalitet. Vidare forskning behövs för en generalisering av resultatet och för att avgöra om SSTQUAL skalan är ett instrument som passer för att mäta SST-kvalitet i den Svenska banksektorn.
Nyckelord: attribut, dimensioner, självbetjäningsteknik, skogs- och lantrbrukskunder,
SSTQUAL-skala
iv
Foreword
Writing this master thesis has been an exciting challenge. I have learned a lot, and I'm grateful I got the opportunity to write a master thesis within the field of service marketing. Without collaboration from Handelsbanken, this master thesis would indeed not be written. Therefore I want to thank Handelsbanken, and especially Rolf Åttingsberg and Stefan Matsson for their support.
Secondly, I want to thank my family and friends, for cheering on me and giving their support. Thirdly, I want to thank my classmates for interesting inputs and feedback in my work.
Last but not least, I want to thank my advisor, Torbjörn Andersson, for his advice and encouraging comments. Also, I'm grateful I got the opportunity to have Ander Roos and Cecilia Mark-Herbert as my teachers during my master's in Uppsala. You are outstanding!
v
Table of content
1 INTRODUCTION ... 1
1.1 PROBLEM BACKGROUND ... 1
1.2 PROBLEM ... 2
1.3 AIM AND RESEARCH QUESTIONS ... 2
1.4 DELIMITATIONS OF THE STUDY ... 3
1.5 OUTLINE ... 3
2 LITERATURE REVIEW AND THEORETICAL PERSPECTIVE ... 4
2.1 SERVICE ... 4
2.2 QUALITY ... 6
2.3 SERVICE QUALITY ... 6
2.4 SELF-SERVICE TECHNOLOGY ... 7
2.4.1 Sources contributing to customers satisfaction ... 8
2.4.2 Sources contributing to customer dissatisfaction ... 9
2.5 THE SELF-SERVICE QUALITY SCALE ... 10
3 METHOD ... 12 3.1 RESEARCH DESIGN ... 12 3.2 CASE STUDY ... 13 3.2.1 Unit of analysis ... 13 3.2.2 Selection of respondents ... 14 3.2.3 Selection of service ... 15 3.3 DATA COLLECTION ... 15 3.3.1 Interviews ... 15 3.3.2 Literature ... 17 3.4 ANALYSE TECHNIQUE ... 18 3.5 QUALITY ASSURANCE ... 18 3.6 ETHICAL ASPECTS ... 20
4 BACKGROUND FOR THE EMPIRICAL STUDY ... 21
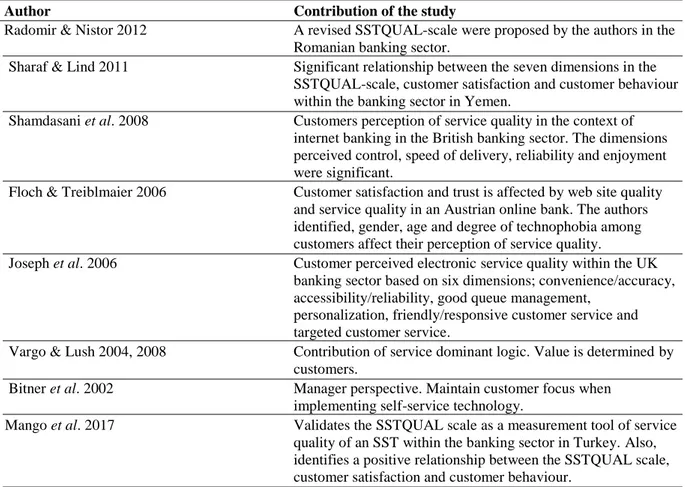
4.1 PREVIOUS STUDIES ... 21
4.2 HANDELSBANKEN ... 24
4.3 THE CORPORATE PACKAGE ... 25
4.3.1 Online corporate banking ... 25
4.3.2 Business application ... 25
4.3.3 Transaction account ... 26
4.3.4 4.2.4 Handelsbanken’s business card ... 26
5 THE EMPIRICAL STUDY ... 27
5.1 CUSTOMERS’ PERCEPTIONS OF DIMENSIONS AND ATTRIBUTES AFFECTING SELF-SERVICE QUALITY ... 27
5.2 CUSTOMERS PERCEPTION OF THE CORPORATE PACKAGE QUALITY ... 29
5.2.1 Functionality ... 29 5.2.2 Enjoyment ... 29 5.2.3 Security/Privacy ... 29 5.2.4 Assurance ... 30 5.2.5 Design ... 31 5.2.6 Convenience ... 31 5.2.7 Customization ... 31 6 ANALYSIS ... 33
vi
6.1 CUSTOMERS’ PERCEPTIONS OF DIMENSIONS AFFECTING SELF-SERVICE QUALITY ... 33
6.2 CUSTOMERS’ PERCEPTION OF THE CORPORATE PACKAGE ... 34
6.2.1 Functionality ... 34 6.2.2 Enjoyment ... 35 6.2.3 Security/Privacy ... 35 6.2.4 Assurance ... 36 6.2.5 Design ... 36 6.2.6 Convenience ... 36 6.2.7 Customization ... 37 7 DISCUSSION ... 38
7.1 HOW DO THE FOREST AND AGRICULTURE CUSTOMERS PERCEIVE THE QUALITY OF AN SELF -SERVICE TECHNOLOGY IN THE SWEDISH BANKING SECTOR? ... 38
7.2 WHAT DIMENSIONS DO FOREST AND AGRICULTURE CUSTOMERS THINK IS CRUCIAL FOR THE QUALITY OF AN SELF-SERVICE TECHNOLOGY IN THE SWEDISH BANKING SECTOR?.... 38
7.3 WHAT SIMILARITIES AND DIFFERENCES CAN BE IDENTIFIED BETWEEN FOREST AND AGRICULTURAL CUSTOMER'S PERCEPTION OF SELF-SERVICE QUALITY AND THE DIMENSION IN THE SELF-SERVICE QUALITY SCALE? ... 39
7.4 METHOD ... 40
8 CONCLUSIONS ... 41
8.1 THE PURPOSE OF THE STUDY ... 41
8.2 FUTURE RESEARCH ... 41
9 REFERENCES ... 42
1
1 Introduction
This chapter introduce the chosen problem area. It also presents research questions, the aim of the study and delimitations.
1.1 Problem background
The rapid development of new technology and distribution of internet connection is a long term trend that has shaped and is shaping the world we live in (Kettrick 2017). This development has contributed to an increased interest in the field of service marketing among researchers and businesses (Bitner et al. 2002; Lovelock & Patterson 2015). In traditionally services values are exchanged face to face between the customer and the service provider. The development of new technology has made it possible for businesses to interact with customers in new ways (Swartz & Iacobucci 2000). Self-service technologies SSTs enables customers to interact with services independent of physical interactions with employees. You are probably using SSTs every day without reflecting upon it. The automatic teller machine ATM launched by the banking industry in the year 1967 is one of the first self-service technologies (Singh 2018). It enabled customers to take control of their transactions, and soon, this technology spread to other industries because of its benefits (Meuter et al. 2000; Radomir & Nistor 2012). Today SSTs are a natural part of our lives. We use services on the internet and online devices (computer, mobile telephone, and tablet) to do transactions, brokerage, retail purchase, find information and more (Meuter et al. 2000; Rust & Kannan 2016). Both customers and business benefits of SSTs. Some advantages that it creates for customers and businesses are time savings, availability, cost reduction, innovation, added value for customers and better customer service (Dabholkar 1996; Bilgihan
et al. 2011; Ramaseshan et al. 2015). These benefits that SSTs enables make them a powerful
tool for businesses to achieve long term success (Meuter et al. 2000; Cunningham et al. 2009). As customers become more and more demanding, businesses have to become customer-oriented and invest in order to offer high-quality services to improve their performance (Pekovic & Rolland 2016). Therefore it requires that it is possible to measure the quality of an SST so firms can evaluate their investments in SSTs. Researchers have shown that the quality of an SST affects customer satisfaction and customer behavior which can be crucial for the performance of a business (Meuter et al. 2000; Yen 2005; Hwang & Kim 2007; Pekovic & Rolland 2016; Rust & Kannan 2016). Therefore the quality of SSTs is of high importance. Lin and Hsieh 2011 developed a scale named SSTQUAL, where they found seven dimensions affecting the quality of SSTs, eg, functionality, enjoyment, security/privacy, assurance, design, convenience, and customization. The purpose of the SSTQUAL scale was to develop an instrument able to measure SSTs quality across several industries. In their study, they request a need to investigate the seven dimensions further since it is a continuous process and may change over time.
With the previous explanation in mind and the combination of Vargo and Lush 2008 concept of a service. That it always should be co-created with the customer since the value determines by the customer and not the service provider. It could emphasis a need to test the SSTQUAL in different industries because customers' perceptions of SST quality may differentiate between branches. Previous research strengthens this statement, a study in the Romanian banking sector shows that the SSTQUAL scale may be revised to suit the Romanian market better (Radomir & Nistor 2012). A study to evaluate the SSTQUAL scale in the Swedish banking sector has
2
never been conducted before. Which raises the question if the SSTQUAL scale can be used to evaluate the quality of an SST in the Swedish banking sector?
1.2 Problem
The financial market is a business with a long tradition of being customer-oriented and offers a variety of SSTs. Within the research literature, in service-marketing, the banking sector is often mentioned to be a pioneer when it comes to SSTs. Also, the business gets high rankings in studies that evaluate digital Customer Experience Management maturity and customer satisfaction (Tieto, 2015; SKI, 2018). Although the banking sector has succeeded in the rapid development of new technology, the competition is fierce. The differences between interest rates and other financial offers are neglectable for most customers, which forces the banks to compete for customers in other ways. One approach is to offer customers high-quality SSTs that generate customer satisfaction (Meuter et al. 2000). Therefore it becomes crucial to consider customers' perception of SST quality. A work that requires continuous evaluation since customers' perception of self-service quality may change over time (Lin & Hsieh 2011). If not, there is a risk that the SSTs generate customer dissatisfaction instead of satisfaction (Meuter et
al. 2000; SKI 2018). A risk that, in turn, can affect the bank's market position (SKI 2018).
For the banks in Sweden, there is an incentive to focus on retaining market shares and on developing existing customer relationships instead of focusing on growth in market shares (Swedish Competition Authority 2013). Forest and agricultural customers are an example of such customers in the Swedish banking sector (Skogssällskapet 2018). They are associated with low risk and high-value development, which makes them a valuable segment for the Swedish banking sector (ibid.). A tough challenge for the Swedish banking sector is to offer SSTs that are personal and proactive (SKI 2018). With this in mind, it makes it interesting to evaluate forest and agricultural customer perceptions of SST quality in the Swedish banking sector. Therefore this study will evaluate which dimensions forest and agricultural customers perceive as crucial for the quality of SSTs in the Swedish banking sector. Hopefully, also contribute to new insights in the banking sector as well within the research of service quality and SSTs.
1.3 Aim and research questions
This study aims to identify which dimensions forest and agriculture customers perceive as crucial for the quality of self-service technology in the Swedish banking sector. The aim is achieved through an emperical case study in a Swedish bank, where the customer's perception of SST quality is investigated. Following research questions are answered:
How do the forest and agriculture customers perceive the quality of an self-service technology in the Swedish banking sector?
What dimensions do forest and agriculture customers think is crucial for the quality of an self-service technology in the banking sector?
What similarities and differences can be identified between forest and agricultural customer's perception of SST quality and the dimension in the SSTQUAL scale?
3
1.4 Delimitations of the study
To achieve the pourpose of this case study, focus will be on the concept of SST quality. Within the literature of service marketing concepts such as technology readiness, customer behavirol and customer satisfaction are often mentioned in relation of service quality. A lot can be said about these concept but because of practical resons and the aim of this study these concepts will not be explained profoundly or considered any closer. Still, the concept of customer satisfaction are used in the theoretical framework to better understand the respondents perception of the quality of an SST in the Swedish banking sector.
Another concept that is close at hand is servicification. It is a process based on service logic, where often manufacturing industries transform their business from selling gods towards selling services. However, this study will not focus on strategies or processes. Therefore servicification is not included in this study.
Moreover, this paper is deleminated to a specific case study within Handelsbanken and therefore the deleminations are influenced by the charactersitics of this case. One of these charachteristics are the forest and agricultural customers evaluating the SST, they are Swedish citizens and customers in Handelsbanken. Which also prostulate that the SST are developed by Handelsbanken.
1.5 Outline
The structure of this paper is illustrated in Figure 1. The structure is divided in eight chapters described below.
Figure 1. The structure of this paper.
Chapter 1 Introduce the problem background, aim of the study, research questions and
delimitations.
Chapter 2 Presents concepts and the theoretical framework. Chapter 3 Describes how the study is conducted.
Chapter 4 Previous studies and the unit of analysis (the corporate package) is described. Chapter 5 Present the findings in the result.
Chapter 6 The result in analysed in perspective of the theoretical framework in chapter 2. Chapter 7 The result is discussed in perspective of previus research in chapter 4.
Chapter 8 Give answear on the research questions and suggestions for future research.
8. Conclusion 7. Discussion 6. Analysis 5. The emerica l study 4. Background for the emperical study 3. Method 2. Literature review and theoretical perspective 1. Introduction
4
2 Literature review and theoretical perspective
The literature gathered in this study is necessary to provide a context for this research. It frames the work and helps identify main ideas, conclusions, differences and similarities in previous research. The review will explain concepts within service marketing and give a brief overview of the research within service marketing. Concepts such as service, quality and service quality are explained in the first part of this chapter. In the end of the chapter the self-service technology, SST, concept is explained and the self-service quality scale, SSTQUAL scale, measuring service quality in a context of self-service technology will be presented.
2.1 Service
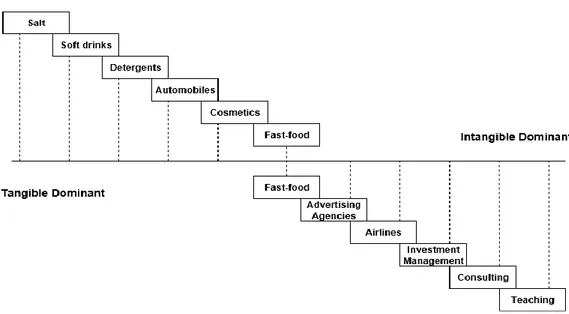
The diverse nature of a service has made it hard for researchers to define the concept (Edvardsson et al. 2005; Lovelock & Patterson 2015). Traditionally researchers within marketing has made distinct separations between services and manufactured goods (Lovelock & Patterson 2015). Which has been expressed particularly in four generic differences, intangibility, heterogeneity and perishability (Lovelock & Gummesson 2004; Lovelock & Patterson 2015). Services can include tangibility’s such as cars, facilities and food, that may be important for the delivery of the service. Though it is often the intangibility elements in the service, such as expertise, attitudes of service personal or internet-based transactions that creates the most value in the service performance (Lovelock & Patterson 2015). This make it often difficult for a customer to evaluate a service features before it is consumed, since there is a lack of reference points. Customer cannot smell, touch or taste the intangible elements of the service as is the case for manufactured goods that are tangible (ibid.). Lynn Shostack (1977) distinguishes between services and manufactured goods by a scale, reaching from dominant tangibility to dominant intangibility, see Figure 2 for illustration. Where the range of the most tangible dominant entity is salt, and the most intangible dominant entity is teaching. In the middle of the spectrum, the entity fast-food is found and are classified as equally tangible and intangible dominant (Shostack 1977).
Figure 2. A spectrum of service and goods provides an understanding of a varying degree of tangible or intangible characteristics. Inspired by Shostack (1977 p. 77).
The variability is also something that distinguish services from goods, manufactured products are often characterized by being homogenic and services heterogenic (Lovelock & Patterson
5
2015). For example, a service such as a fishing trip, will be impossible to keep homogenic, it is not possible to control factors that will affect customers experience such as weather conditions and luck at fishing. On the other hand, customers participating in the fishing trip can easily buy identical fishing equipment. In other words, manufactured goods can be produced in controlled circumstances where the features of the goods can be inspected accordingly to quality standards (ibid.). Where’s it is harder to predict, control and protect customers from the result from service failure, (which in this example could be the weather or luck at fishing).
Another distinction between goods and services is that people often are a part of the service experience (Lovelock & Patterson 2015). For example, the attitudes on customers and employees participating in the fishing trip will probably affect the outcome of the experience. If you like their attitudes and having a good time, your experience will probably be better than if it was the opposite. Also, this means customers are a part of co-creating value of the service. This type of interactions, where customers are seen as a part of co-creating value is a view that has received more attention the last decade (Vargo & Lusch 2004, 2008; Lusch & Vargo 2006). And stand out from the more traditional view of marketing, called goods dominant logic (GDL) where the purpose of industry mainly was producing goods, and customers were seen as passive recipients (Lovelock & Patterson 2015).
Today the distinction between service and manufactured goods in the marketing scholar are blurry and not so clear as it was when marketing was dominated by goods dominant logic (Vargo & Lusch 2008; Lovelock & Patterson 2015). Even within businesses the same phenomenon can be recognized. Companies that traditionally was manufacturing goods is now adding services to their goods and even include services in their portfolio (Lovelock & Patterson 2015). For example, the company IBM founded year 1911 (IBM 2012) was from start mainly a manufacturer of computer hardware. Today it is a multinational information technology company offering global technology services (ibid.). These trend in business, the shift of economy from goods to services has given rise to a new service paradigm within marketing, namely service dominant logic (Vargo & Lusch 2004), a concept that defines service as follows: “we define services as the application of specialized competences (knowledge and skills)
through deeds, processes, and performances for the benefit of another entity or the entity itself
“ (Vargo & Lusch 2004 p. 3).
The service dominant logic propose that services should not only be seen as an intangible resource of knowledge and skills but also the possibility of being tangible resources (Vargo & Lusch 2004, 2008; Lusch & Vargo 2006) . Vargo and Lush claim that their definition of a services is more inclusive and capture the heart of business. Though they are not the first to highlight that everything could be considered a service. As Theodore Levitt (1974) put it long time ago:
“There are no such things as service industries. There are only industries whose service
components are greater or less than those of other industries. Everybody is in service” (Levitt
1974 p. 47).
Bo Edvardsson (2005) claim there exist two different approaches of the definitions of a service within the service research. He means that some researchers view a service as a perspective on value creation and others view service as a category of market offerings (Edvardsson et al. 2005). The first approach aligns with Vargo, Lusch and Levitts definitions of a service (see above). The latter one confirms with Grönroos definition of a service:
6
“as an activity or series of activities of a more or less intangible nature that normally, but not
necessarily, take place in the interaction between the customer and service employees and/or physical resources or goods and/or systems of the service provider, which are provided as solutions to customer problems” (Edvarsson et al. 2005 p. 110)
Grönroos (2002) proposes that a service is an activity that are provided to solve customer problems. Other researchers in the field (Evert Gummesson and Christopher Lovelock) has a similar approach towards the definition of a service, e.g. customer perspective (Edvardsson et
al. 2005).
It exists many definitions of a service in the marketing literature though some of them have been presented above. One thing is clear, it does not exist any universal definition of a service and it seems that many definitions are vague and open for interpretations. As Bo Edvardsson (2005) reflect about the concept:
“The terms or concepts used in defining services are also open to different interpretations. It is not clear what we mean by activities, deeds, processes, performance, interactions, experiences, and solutions to customer problems. The concept of “service” is fuzzy, and perhaps this is normal within an emerging discourse. As service research enters maturity, however, we may need more precise definitions or a clearer point of departure: one possibility is to define services through the lens of the customer with a focus on value-in-use” (Edvardsson et al. 2005
p. 113)
This brief literature review shows that the concept of service is rather complex, though Edvardsson (2005) agree with Vargo and Lusch, that a service should be defined through the lens of the customer with a focus on value-in-use.
2.2 Quality
According to the Swedish Academy’s dictionary (SAOB 2019), quality is a greatness that describes how well one or more properties of a phenomenon, product or service meet a need. However there is no universal definition of the concept (Reeves & Bednar 1994). It varies between industries, academia’s and practioners, manufacturing and services (Wicks & Roethlein 2009). One possible explanation why the concept of quality varies could be because of its properties. The components are often of intangible nature and it makes different definitions of quality suitable for different circumstances (ibid.).
2.3 Service quality
As you have read, both quality and service are two concepts that do not have any universal definition and they can be seen as rather complex concepts. Not so surprisingly, this also implies for service quality (SQ). However, it is often referred as a measure of how a service meet customer expectations (Ghobadian et al. 1994). Where customer judge the quality of a service by comparing their expectations of what they should receive with their perceptions of what the service actually delivered (ibid.). Or as parasuman summarizes previous studies in service quality “SQ stems from a comparison of what customers feel a company should offer with the
company’s actual service performance”. Though, the perception of the service quality is not
only determined by the servie outcome but also by the service process, since the customer is present and a co-creator in the delivery process of a service (Ghobadian et al. 1994; Vargo & Lusch 2008).
7
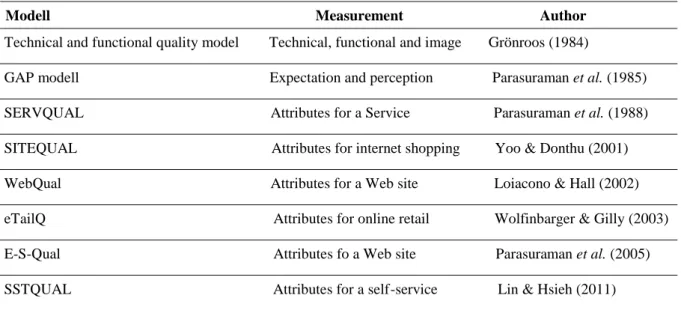
Moreover, service quality is a concept that is considered important for business, regarding competitiveness and long term profitability (Ghobadian et al. 1994). And therefore companies often strives to deliver services that has an high quality. But in order to know if the quality of the service is high or low it has to be measured. This is something that reserachers has tried to answear and as a result there is several models describing how service quality is measured. As an example, Table 1 illustrates a few of them.
Table 1. Excerpt of literature describing how quality could be measured
Modell Measurement Author
Technical and functional quality model Technical, functional and image Grönroos (1984) GAP modell Expectation and perception Parasuraman et al. (1985) SERVQUAL Attributes for a Service Parasuraman et al. (1988) SITEQUAL Attributes for internet shopping Yoo & Donthu (2001)
WebQual Attributes for a Web site Loiacono & Hall (2002) eTailQ Attributes for online retail Wolfinbarger & Gilly (2003) E-S-Qual Attributes fo a Web site Parasuraman et al. (2005) SSTQUAL Attributes for a self-service Lin & Hsieh (2011)
Christian Grönroos was maybe one of the first to highlight the need of a model that describes how quality in service is perceived by customers (Grönroos 1984). He describes the importance to include dimensions of technical quality, functional quality and customers image of the company in terms of measuring service quality (ibid.). Also, he proposes that service quality is dependent on two variables, expected service and perceived service. Another dominant researcher in the field that develop the same point of view is Parasuman, which created the GAP model that later was developed into SERVQUAL (Parasuraman et al. 1985, 1988). Which describes five dimensions affecting service quality and has become a well-recognized tool to evaluate the quality of a service (Parasuraman et al. 1988). Though researches have continued to develop models and found other dimensions affecting service quality in different contexts. As Table 1 displays, more recent models describe how quality is measured in internet-based services and therefore differs from SERVQUAL which measures the quality of traditional services (face to face). Services characterized by technology where no interpersonal contact between customer and provider exists. Customers’ expectations of the service are less important since customers tend to rely on their experience instead (Santos 2003). Yang & Jun (2002) has also shown that customers have difficulties to have a clear perception of what expectations they hold for online services.
2.4 Self-service technology
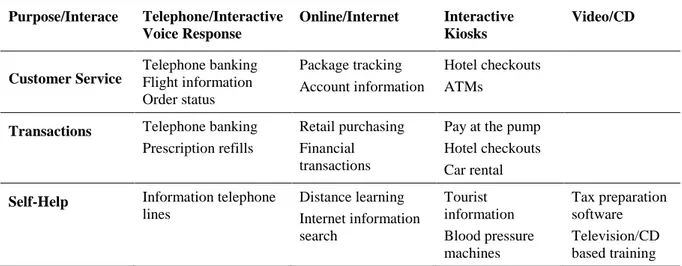
The implication of self-service technologies (SSTs) has allowed customers to produce and consume services independent of face to face interaction with service employees (Meuter et al. 2000). They serve different purposes (customer service, transactions and self-help) to customers and the technology interface of the SSTs can also vary, see Table 1. Some of the technology interfaces of the SSTs include interactive free-standing kiosks such as self – pumping gas stations or internet-based interfaces where customers independently can check their account balance or make financial transactions. It is also possible to combine the different types of
8
technology interfaces. For example, a customer can buy a flight ticket online and at the airport the customer can use interactive kiosk to print boarding card and check in baggage. This type of solutions does not only combine several types of technology interfaces (online webpage and interactive kiosks) but also fulfills several purposes to the customer (in this specific case transaction and self-help), see Table 2.
Table 2. Provides technology interfaces that a self-service technology can obtain and customers purpose using it (Meuter et al. 2000 p. 52) Purpose/Interace Telephone/Interactive Voice Response Online/Internet Interactive Kiosks Video/CD Customer Service Telephone banking Flight information Order status Package tracking Account information Hotel checkouts ATMs
Transactions Telephone banking
Prescription refills
Retail purchasing Financial transactions
Pay at the pump Hotel checkouts Car rental
Self-Help Information telephone
lines Distance learning Internet information search Tourist information Blood pressure machines Tax preparation software Television/CD based training
As Table 2 shows, SSTs is used in several different businesses in our society such as health care, finance, tourism and retail. In combination with the possible customizations of its technology interface and how it can serve customers. It makes SST a creative tool for business to engage in customers in new ways (Meuter et al. 2000; Rust & Kannan 2016). Several researchers propose that self-service technologies should be considered as an important part of long-term success in business(Meuter et al. 2000; Yen 2005; Bolton et al. 2007; Rust & Kannan 2016). In order for business to deliver self-service technology that satisfies customers it is fundamental to identify the source of satisfaction and dissatisfaction in these technology solutions (Meuter et al. 2000).
Meuter (2000) has identified seven sources that contributes to customers dissatisfaction or satisfaction. These sources are based on interactive incedents of 823 consumers using a variety of self-service technologies in different businesses (ibid.). Below, the satisfying incedents and disatissfying incedents in SSTs are described. Category one to three is considered to contribute to customers satisfaction and category four to seven dissatisfaction.
2.4.1 Sources contributing to customers satisfaction
Below the characteristics and reasons of why an SST can contribute to customer satisfaction is explained (Meuter et al. 2000).
1 Solved intensified needs
That SSTs has the function to solve customers’ needs in urgent situations are a factor that contribute to customer satisfaction (Meuter et al. 2000). Since the characteristics of SSTs are availability and flexibility, they can help customers to solve their problems at once (ibid.).
9
2 Better than the alternative
Another reason of why SSTs contributed to satisfaction among customers was because it had functions or benefits that was superior to other service alternatives (e.g. interpersonal services). These functions are divided into six subcategories and are presented as 2a, 2b etc.
2A easy to use
Self-service technology where the process of using it is clear and straightforward was contributing to customers satisfaction (ibid.). Also, that it was easier to use than other service alternatives were highlighted as important for customers satisfaction.
2B avoid service personnel
Customers can appreciate the possibility of consuming a service without interacting with service employees (ibid.).
2C saved time
This subcategory was considered especially important for customers and their satisfaction. For example, SSTs allowed customers to deal with transactions and information more quickly and efficient (ibid.).
2D when I want
The availability of SSTs is seen as a positive function in the perspective of the customer. To consume the service at any time (ibid.).
2E where I want
Or at any location.
2F saved money
When the SSTs enable customers to get a better deal or other financial benefits it is a function that contribute to satisfaction (ibid.).
3 Did its job
The last source identified in SSTs contributing to customers satisfaction is “did its job”. That the SST actually do what it is intended to do is considered important. And often enough for customers to have a pleasant experience with the SST. Also, many customers were impressed by the capabilities self-service technologies had (ibid.).
2.4.2 Sources contributing to customer dissatisfaction
Below the characteristics and reasons of why an SST can cause customer dissatisfaction is explained.
4 Technology failure
Customers are dissatisfied when the technology of the service failure. This was also the largest source of dissatisfaction from customers perspective (ibid.).
5 Process failure
Problems that occur in the process after customer consume the service were seen as a source of dissatisfaction. For example, customers who successfully paid and ordered a product online, did never receive the product (ibid.).
10
6 Poor design
The design of the service experience including both the service design and the technology design were a source of dissatisfaction among several customers. Poor technology design refers to difficulties to navigate in the system, slow systems or other shortcomings that do not affect the purpose of the service. Poor service design refers to restraints or other limits that customers believe hinder them from using the full capacity of the service. Though these types of restraints do not hinder the customer to use the function of the service. For example, online retail purchases can be limited to where it is possible to deliver the product. Or fees are charged by the SST or limits of how frequently customers can use the service can be set up by the company (ibid.).
7 Customer-driven failure
The Customers own failure was one reason why they had dissatisfied experience with the service. For example, when customer forgot their own password to their accounts (ibid.).
2.5 The Self-service quality scale
The purpose of the service quality scale, SSTQUAL scale, is to measure the quality of self-service technology (Lin & Hsieh 2011). It was developed by Lin and Hsieh in year 2011 because they believed that there was a gap in the research of service quality. At that time, there was no instruments that had the ability to measure technology-based service quality across several industries (Radomir & Nistor 2012). Instead, research in measurement of service quality was limited to specific industries, such as online retail and online shopping (Lin & Hsieh 2011; Radomir & Nistor 2012). Therefore, Lin and Hsieh saw a need of developing a new scale that could be used to evaluate the quality of self-service technology. Since the concept of SST target several areas where it is used (Meuter et al. 2000), the scale develop by Lin and Hsieh also target a broader area of where the scale could be applicable (Lin & Hsieh 2011).
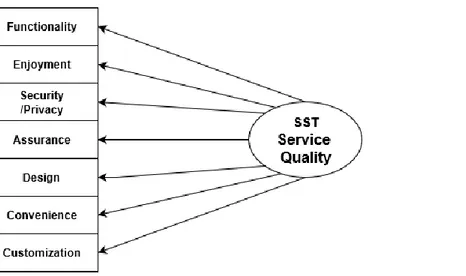
In their research, they found that customers, regardless of industry, rated SST service quality based on seven primary sources. Including, functionality, enjoyment, security/privacy, assurance, design, convenience and customization, see Figure 3. The sources contributing to customers perception of SST service quality are further described below.
Figure 3. Attributes that are fundamental for the quality of self-service technology. Inspired by Lin & Hsieh (2011 p. 199).
11
Functionality
Involves the functional characteristics of the SSTs regarding ease of use, reliability and responsiveness.
Enjoyment
Customers perception of using the SST, includes delivery and outcome of SST.
Security/Privacy
Describes customer trust in SST, includes parameters such as the risk of losing private information and security against intrusion and fraud.
Assurance
Relates to the confidence customer have to the SST due to the reputation and competence of the SST provider.
Design
Customers perception of the whole design of the SST service system.
Convenience
Refers to the accessibility of the SST, includes time but also ease of reaching the providers SST (place).
Customization
In which degree the SST can be adopted to individual customers’ needs and preferences. These dimensions can be used as a guide in evaluations measuring the quality of SSTs. And help providers to develop more competitive services that fits customer needs. Another important finding in their research (Lin & Hsieh 2011) that also align with previous research regarding service quality is the fact that service quality affect customers behavioral intentions (Cronin et al. 2000). Meaning that customers perception of the quality of a service will affect if customers are willing to say positive things about it, recommend the service, remain loyal and pay premium prices (Zeithaml et al. 1996; Cronin et al. 2000). Factors that could determine if a service provider has the ability to generate profits or not (ibid.).
12
3 Method
This part explains and motivates the research approach, how data is collected, choice of unit of analysis, analytical technique, quality assurance and ethical aspects. The purpose is to give the reader an understanding of how the study is constructed.
3.1 Research design
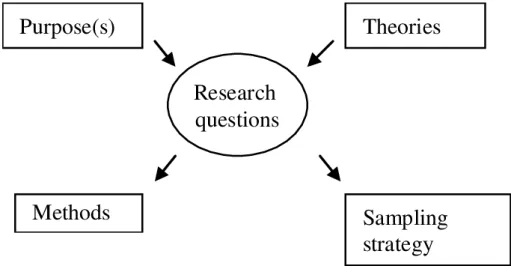
When writing a research project there is five components to consider which should influence research design (Robson, 2002). The five components, see Figure 4, are purpose, theory,
research questions, methods and sampling strategy. All of them are described in this paper and
together they should determine and motivate the chosen strategy. Robson (2002) claim that all of them need to be inter-related and kept in balance. He explains (ibid.) that if the research question does not link to theory, it is not likely that the answers will be of value. Then something has to change or develop, either the research questions or the theory. With other words, the components are shaping each other.
Figure 4. A framework for research design. Inspired by Robson (2002 p. 73).
In a fixed research design, all of the components mentioned above is specified early in the research process, see Figure 5. The design is a linear process and a common approach in natural science when quantitative data are collected in controlled circumstances (ibid.).
Figure 5. The process of a fixed design. Inspired by Dybå (2019 p.8).
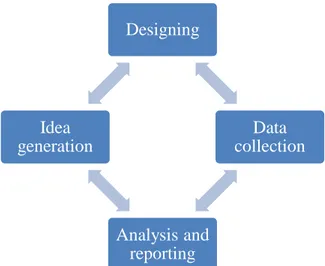
Another approach is the flexible design, see Figure 6. Here, a repeated revisiting of all the components occur as the research proceeds (ibid.). Shaping the research design framework during the process. In the end of the process all the components in the study is specified. A Flexible design is a common approach in social science where qualitative data is collected
(ibid.). Though, it should be mentioned that a flexible approach could also include quantitative
data, (it is more rarely for a fixed design to include qualitative data).
Idea generation Designing Data collection Analysis and reporting
13
Figure 6. The process of a flexible design. Inspired by Dybå (2019 p. 8).
This thesis will identify how forest and agriculture customers in the Swedish banking sector perceive the service quality of an SST and what dimension they find affecting SST quality. According to Robson (2002), when dealing with case study research a fixed or flexible approach can be used. In this study a flexible approach is preferred because in order to achieve the purpose, how and why questions are answered (see chapter 1.3 for research questions). Also, the study will include a case and interviews of customers. Which means that the study operates in an open system (real world) and the data will be of qualitative nature (words). When operating in an open system it is hard to control and predict the process of the study and it may evolve during time. Further this indicate that a flexible design is an appropriate method for this particular study (ibid.).
3.2 Case study
A case study is commonly used in a real-world context and consist often of qualitative data (Robson 2002). It can also be a mix of methods (ibid.), where both quantitative and qualitative data are collected. The strategy is to focus on one case, may it be a group, organisation or a setting, where the context is taken into account (ibid.). Since this study starts of in a commission, where customers perception of SST quality is collected in a specific setting, a case study become a natural part of the strategy of the work (ibid.). Moreover a case study is a recommended method in marketing research and since this paper focus on service marketing, a case study should be an appropriate method to achieve the purpose of this thesis (Riege 2003), see chapter 1.
It also aligns with the flexible design of the research in this study. Because a case study has the ability to be flexible and can be loosely designed (Robson 2002). Which makes it a suitable approach when the direction of the study is uncertain, and the field of research are novel (Eisenhardt 1989).
3.2.1 Unit of analysis
According to Yin (2009), the unit of analysis is related to the fundamental problem of defining what the case is. It should be related to the topic of the case and the primary research questions and can include individuals, events, or an entity (ibid.). This case study evaluates the concept of service quality in SSTs from the perspective of Forest and agriculture customers. Focus is on the concept of self-service quality, but since the concept evolves customers' perception and
Designing Data collection Analysis and reporting Idea generation
14
the properties of an SST, the interface between customers' perception and the banks SST becomes fundamental for the analysis.
3.2.2 Selection of respondents
There are various ways to collect the sample used in a research study, it can be based on different probability methods or non-probability methods (Denscombe 2014). The former is based on random selection from the research group and the idea is that the researcher has no influence on the choice of test persons or objects to be included in the sample (ibid.). In that way, everyone in the research group has the same probability to be picked and the selection becomes representative (ibid.). This method is best suited for large selections and is often used in large surveys where quantitative data is processed (ibid.).
Non-probability methods means that respondents are collected based on certain attributes or criteria (Denscombe 2014). Meaning that they are not randomly selected, and the researcher has an impact on the sample. This method is used when the researcher think it is difficult or inappropriate to rely on random selection (ibid.).
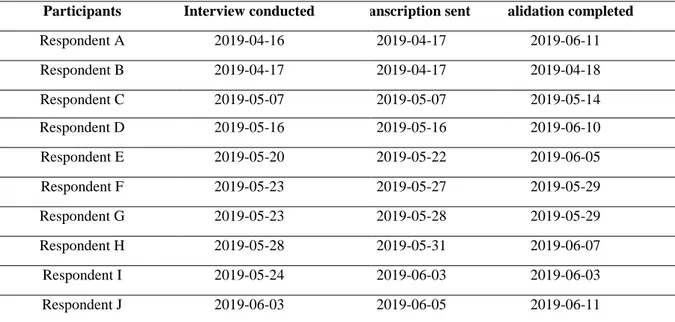
In this study a targeted selection has been used to select respondents. It is a non-probability methods where the respondents are picked based on their attributes (Denscombe 2014). The purpose of the method is to collect respondents that can contribute with valuable information connected to the topic of the study and the research questions (Bryman 2011; Denscombe 2014). For example it can be respondents with certain knowledge or experience about the research topic (Denscombe 2014). In qualitative research, targeted selection is often recommended as an appropriate method when doing interviews (Bryman 2011). Though, to find appropriate respondents, it requires knowledge of the group from which the selection should take place (ibid.). Therefore, the respondents have been selected based on Handelsbanken knowledge about their customers and the authors knowledge about the research questions and topic of the study.
Table 3. Interviewed forest and agricultural customers in Handelsbanken
No Participants Interview conducted Transcription sent Validation completed
1 Respondent A 2019-04-16 2019-04-17 2019-06-11 2 Respondent B 2019-04-17 2019-04-17 2019-04-18 3 Respondent C 2019-05-07 2019-05-07 2019-05-14 4 Respondent D 2019-05-16 2019-05-16 2019-06-10 5 Respondent E 2019-05-20 2019-05-22 2019-06-05 6 Respondent F 2019-05-23 2019-05-27 2019-05-29 7 Respondent G 2019-05-23 2019-05-28 2019-05-29 8 Respondent H 2019-05-28 2019-05-31 2019-06-07 9 Respondent I 2019-05-24 2019-06-03 2019-06-03 10 Respondent J 2019-06-03 2019-06-05 2019-06-11
The sample from where respondents was selected consists of forest and acricultural customers which use the Corporate Package (an SST) in Handelsbanken. Forest and agricultural customers are defined as a owner of agricultural assessed property. The customers using the Corporate Package are entrepreneurs and are a heterogeneous group but since this study focus on forest
15
and agriculture customers the selection of respondents was focused on this particular group. In other words, no consideration of age and gender was taken. Secondly, in order to get a deeper understanding of how forest and agriculture customers perceive the quality of the Corporate Package, customers considered experienced using the self-service was picked. Experienced users were defined using the corporate package a minimum of once a week. Also, experienced respondents in this study are entrepreneurs that have their business as the main source of income and therefore has a need to use The Corporate Package on regular basis. This choice was made because experienced customers was considered to give more valuable information than unexperienced customers. Lastly, this group of respondents are considered to be valuable customers for Handelsbanken.
The sample of respondents are in ages between 35-65 years old. Of the ten interviewees three are women and seven are men and all of them have a forest or agriculture business.
3.2.3 Selection of service
The Corporate Package (described in chapter 4) is the SST in this study that are analysed, the reason of why this particular SST was picked has several reasons. Firstly, the corporate package is a self-service technology in the Swedish banking sector and therefore links to the research question (see chapter 1.3) “How does the forest and agriculture customer perceive the quality
of an SST in the Swedish banking sector?”. Secondly, the corporate package is developed for
corporate customers, and lastly, forest and agricultural customers are using this service. A bank had to be picked based on specific criteria to answer the research questions in this study. The first criteria of the bank consist of having a business in Sweden, secondly, having customers defined as forest and agricultural customers (definition described in chapter 3.2.2). The last criteria refer to the bank’s services, the bank needs to have an SST developed for corporate customers, specifically the segment of forest and agricultural customers.
3.3 Data collection
3.3.1 Interviews
Data were gathered by semi-structured interviews which is commonly used in flexible qualitative designs (Robson, 2002). It is a method which is a combination of structured interviews and unstructured interviews. Meaning that the interview consists of predetermined questions based on certain themes but allows the interviewer to ask open questions when needed
(ibid.). This gives the interviewer the opportunity to get a deeper understanding of the
interviewee attitudes, opinions and experiences. Semi-structured interviews produce small amounts of data per interview and requires therefore more participants to achieve “saturation” (ibid.). When no further data collection adds no or little knowledge to what you already have learned, saturation is considered achieved (ibid.). Qualitative interviews are suitable when a study focus on the meaning or perception of a particular phenomenon to the participants (ibid.). Since this study focus on customers perception of SSTs and service quality, such method is considered to be appropriate in this study.
The questionnaire was divided into two parts (Appendix 1), the first part of the questionnaire was structured of semi-structured questions to answer the research question what dimensions
does forest and agriculture customers think is important for the quality of an SST in the banking sector? The second part of the questionnaire was constructed to answer the research question how does the forest and agriculture customer perceive the quality of an SST in the Swedish banking sector? The questions in the second part of the questionnaire was divided into seven
16
themes, functionality, enjoyment, security/privacy, assurance, design, convenience and
customization in order to reflect the seven dimensions of the SSTQUAL scale. Each theme
(dimensions) had semi-structured questions influenced by the “attribute questions” in the SSTQUAL scale, see Table 4. The questions were rephrased to avoid yes and no questions. If the respondents answered yes or no, additional why or how questions were asked to get a deeper understanding of the reasons behind the respondent’s perception.
To avoid influencing the respondents, they had the opportunity to first express which dimensions or attributes they found important for the quality of an SST in the banking sector (part one). Then they were asked about the dimensions (found in SSTQUAL scale) of the corporate package (part two). Thereby the order of the two parts of the questionnaire.
Table 4. Attributes influencing each dimension of the self-service quality scale. Inspired by Lin & Hsieh (2011 p. 197)
The interviews were conducted by telephone and not face to face, which in research literature often is argued to be a better alternative when collecting qualitative data (Novick 2008). Arguments against using telephone as a technique is the ascent for the interviewer to notice visual or nonverbal insinuations that could generate data (ibid.). Other drawbacks compared to face to face interviews are lower response rate and requirements of shorter interview durations which could reduce in-depth discussion (ibid.). Advantages of telephone interviews are decreased costs, less travels, improved interviewer safety and ability to reach geographically spread respondents (ibid.). Other advantages are increased anonymity, privacy and decreased social pressure (ibid.). Which can affect the respondent to feel more relaxed, willing to talk freely and share intimate information (Kavanaugh & Ayres 1998; Novick 2008). Some researchers (Kavanaugh & Ayres 1998; Sturges & Hanrahan 2004) argues that qualitative telephone data is detailed and of high quality.
No Dimensions Attributes
1 Functionality 1. I can get my service done with the firm’s SST in short time.
2. The service process of the firm’s SST is clear.
3. Using the firm’s SST requires little effort.
4. I can get my service done smoothly with the firm’s SST.
5. Each service item/function of the SST is error-free. 2 Enjoyment 1. The operation of the firm’s SST is interesting.
2. I feel good being able to use the SSTs.
3. The firm’s SST has interesting additional functions. 4. The firm’s SST provides me with all relevant information. 3 Security/Privacy 1. I feel safe in my transactions with the firm’s SST.
2. A clear privacy policy is stated when I use the firm’s SST. 4 Assurance 1. The firm providing the SST is well-known.
2. The firm providing the SST has a good reputation. 5 Design 1. The layout of the firm’s SST is aesthetically appealing.
2. The firm’s SST appears to use up-to-date technology. 6 Convenience 1. The SST has operating hours convenient to customers.
2. It is easy and convenient to reach the firm’s SST. 7 Customization 1. The firm’s SST understands my specific needs.
2. The firm’s SST has my best interests at heart.
17
Even if face to face interviews are seen as the “way to go” when doing qualitative interviews (McCoyd & Kerson 2006), Gina Novick (2008) are sceptical. She believes there is a need of more evidence and therefore none of the qualitative interview methods should be favoured over another (Novick 2008).
The reason why telephone interviews was conducted in this study rather than face to face interviews was because of the time savings due to no need of travels. Making it possible for the author to collect more data of customers perceptions. Also, as mentioned above, previous research shows that there is a debate in research literature if face to face interviews are a better method than telephone interviews when collecting qualitative data or not. This ambiguity interprets that telephone interviews and face to face interviews could be seen as equal. Therefore, the reason why telephone interviews was chosen should be an acceptable statement. To prevent possible misinterpretations during the interviews, the respondent’s native language, Swedish was spoken. All interviews were transcribed and translated to English. The author of this paper translated the transcriptions as accurate as possible, but because of limitations in the languages vocabulary all words was not translated identically. Though, it should not affect the outcome of the result since the whole picture of each interview was captured in each transcription.
The technique used to transcribe all interviews were denaturalism. It is a approach where grammar is corrected, non-standard accents are standardized and interview noise such as stutters and pauses are removed (Oliver et al. 2005). The purpose of denaturalism is to capture the substance of the interview so the perceptions and meanings shared during the conversation are captured (ibid.). This approach differs from naturalized transcription where the whole conversation is transcribed in detail, including pauses and stutters (ibid.). Naturalism is often used in conversation analysis studies where the purpose is to find speech patterns between people (ibid.). Since the purpose of this study not is analysing speech pattern between people, but rather identify customers perceptions and service quality, the denaturalized transcription was considered as an appropriate approach.
3.3.2 Literature
The literature gathered in this study is necessary to provide a context for this research. It frames the work and help identify main ideas, conclusions, differences and similarities in previous research. To give the reader a picture of the phenomenon and answer the research questions in this case study it is necessary to cover literature within the field of service marketing. This is because this field of science covers theories and concepts related to the complexity of SSTs and its quality. The literature in this study give the reader a brief overview of the research within service marketing. Though, all literature in this field is not covered in this study, only literature that contributes to an understanding of this particular phenomenon, namely SSTquality, and theories that are used to identify the quality of an SST. For a broader search of relevant literature, Google Scholar was used together with the scientific database Web of Science. The keyword SST and self-service technology was used in combination with service quality and
quality. To ensure the quality of the literature retrieved, articles that are scientifically reviewed
18
3.4 Analyse technique
In order to answer the research question in this study, the bricolage technique (Brinkmann & Kvale 2015) was used to analyse the transcriptions of the interviews. It is a mix of methods, including analytical techniques and concepts, it is not fixed to a certain technical discourse, rather it moves freely between them (ibid.). The bricolage enables the interviewer to find structures and connections that can be of importance for the research project (ibid.). This generation of meaning can be in words, in numbers, in figures or a combination of these (ibid.). In this study, the transcriptions have been interpreted based on the respondent’s answers of the seven dimensions of the SSTQUAL scale used in the interview guide. Answers related to respondent’s perception of the corporate package has been categorized to either positive, negative or neutral by the author. Answers that express positive feedback about the corporate package are categorized as positive, for example, answers similar to “I think it is good, it is a good experience” is categorized as positive. Answers similar to “It is pretty boring it does not appeal to me at all” were categorized as negative. When the respondent could not express if the dimension was either good or bad, or did not had any answer, the answer was categorized as neutral. Answers similar to “It works, no big ovations, it fulfils my needs” was categorized as neutral. The overall expression from each dimension and respondent was then quantified and summarized in Table 6 (see chapter 5.2). The numbers are displayed in Table 6 to show the outcome of respondent’s opinion e.g. positive, negative or neutral for each attribute regarding the corporate package.
3.5 Quality assurance
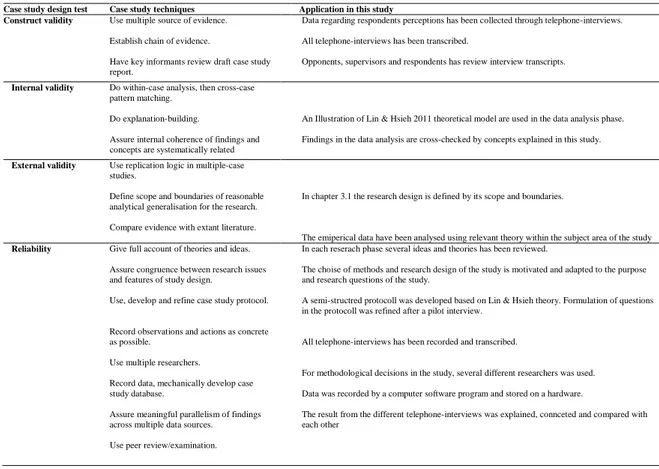
To assure the quality of the content in a case study Riege (2003) propose various techniques that can be used to establish high validity and reliability of qualitative data. Table 5 presents the different case study techniques and how they are applied in this study.
Table 5. Techniques for quality assurance in case studies and application of these techniques in the study
Case study design test Case study techniques Application in this study Construct validity Use multiple source of evidence.
Establish chain of evidence.
Have key informants review draft case study report.
Data regarding respondents perceptions has been collected through telephone-interviews. All telephone-interviews has been transcribed.
Opponents, supervisors and respondents has review interview transcripts.
Internal validity Do within-case analysis, then cross-case pattern matching.
Do explanation-building.
Assure internal coherence of findings and concepts are systematically related
An Illustration of Lin & Hsieh 2011 theoretical model are used in the data analysis phase. Findings in the data analysis are cross-checked by concepts explained in this study.
External validity Use replication logic in multiple-case studies.
Define scope and boundaries of reasonable analytical generalisation for the research. Compare evidence with extant literature.
In chapter 3.1 the research design is defined by its scope and boundaries.
The emiperical data have been analysed using relevant theory within the subject area of the study
Reliability Give full account of theories and ideas. Assure congruence between research issues and features of study design.
Use, develop and refine case study protocol.
Record observations and actions as concrete as possible.
Use multiple researchers. Record data, mechanically develop case study database.
Assure meaningful parallelism of findings across multiple data sources. Use peer review/examination.
In each reserach phase several ideas and theories has been reviewed.
The choise of methods and research design of the study is motivated and adapted to the purpose and research questions of the study.
A semi-structred protocoll was developed based on Lin & Hsieh theory. Formulation of questions in the protocoll was refined after a pilot interview.
All telephone-interviews has been recorded and transcribed.
For methodological decisions in the study, several different researchers was used. Data was recorded by a computer software program and stored on a hardware.
The result from the different telephone-interviews was explained, connceted and compared with each other
19
The design tests in Table 5, construct validity, internal validity, external validity and reliability originate from quantitative research but they can also be applied to qualitative research, such as a case study (Riege 2003). Construct validity refers to the researcher’s ability to refrain from subjective judgments during research design and data collection (ibid.). If the researcher is objective, high validity can be achieved. Though, case studies are generally seen as more subjective then qualitative research methodologies since a case study often involve close contact with organizations and people (ibid.).
The meaning of internal validity in a case study is how the author highlight patterns of similarities and differences between respondents’ experiences, opinions or thoughts (ibid.). And how these patterns can be explained by different components and mechanism so the phenomenon can be established in a credible way (ibid.).
In order to achieve external validity, an analytical generalization is necessary, which is based on the fact that particular findings are generalized to a broader theory (ibid.). The purpose is to understand how the empirical results connects with developed theoretical constructs (ibid.). Reliability refers to the ability for other researchers to repeat the study and achieve similar findings (ibid.). Therefore, the researcher has to account for the operations and procedures in the study. Though it can be difficult to replicate a case study since it often involves people, for example in an interview, people’s answers may change from time to time even if the researcher interviews same people and ask exactly the same questions. This does not mean that a case study is a bad method. Rather, possible differences can provide valuable information about cases investigated (ibid.).
Except the four design tests described above, Rieg (2003) also proposes that four other design tests should be incorporated to enhance the quality of case study methods. These design tests are credibility, transferability, dependability and confirmability and refers to qualitative approaches. All of them corresponds to the four design tests shown in Table 5.
Confirmability is similar to construct validity, it estimates in which extent the conclusions are the most reasonable ones obtained from the data (ibid.). To ensure the confirmability of the study, the general method of the study should be explained in detail, the study should contain enough information to cover the whole picture of the phenomenon and the data should be available for others analysis (ibid.). To ensure the confirmability in this paper, the methods is described and motivated in chapter 3. The phenomenon is described in chapter 1, further relevant concepts and theories of the phenomenon is described in chapter 2. Also, the interview guide is attached, see Appendix 1, illustrating the structure of the interviews. Further commitments to enhance construct validity is illustrated in Table 5.
The parallel construct to internal validity is credibility, which involves approval of researcher findings by interviewees, opponents or supervisors (ibid.). This step is important since reality can be interpreted in different ways. Therefore, all respondents had the ability to review and change the transcript, so the authors interpretation of the interview was confirmed by the respondents. Moreover, to ensure the credibility of a study the findings should be internally coherent, concepts systematically related and descriptions should be rich and meaningful (ibid.). The findings in this study is shown in chapter 5, analyzed in chapter 6 and discussed in chapter 7. Together, these chapters should give the reader a picture of how the findings are internally coherent and how the concepts are systematically related.
20
Transferability relates to the function of external validity or generalization (ibid.). This is achieved when the researcher can show similarities or differences of a phenomenon among respondents (ibid.). Findings should be described in a rich manner so other readers potentially can transfer appropriateness to their own setting (ibid.). Also, the finding should be linked to or affirming previous theories (ibid.). Similarities and differences of the findings are shown in chapter 6 and the links to previous theories are discussed in chapter 7. The description and explanation of all content in this paper is reviewed by opponents and a supervisor, to ensure that descriptions and explanations are rich and meaningful.
Lastly, the parallel construct to reliability is dependability and the purpose is to show consistency in the processes or techniques used in the study (ibid.). To achieve dependability the research question should be clear, and the functions of the study design should correspond to it. The focus of this paper is to answers the research questions, see chapter 1.3. Therefore, the methods were chosen and motivated based on the research questions, see chapter 1.3 and chapter 3.
3.6
Ethical aspects
When doing social research, participants may be involved. It is important to consider their situation, if not, it can cause the participants unnecessary negative feelings, such as anxiety or stress (Robson 2002). Therefore, all participants were informed in advance about the study by Handelsbanken. They were asked to participate in a telephone interview regarding the corporate package and informed that it was voluntary to participate in the study. Before the interview started, the researcher gave the respondents some brief information about the study, to ensure they had understood the criteria for the study. Also, informed consent between all participants was mandatory in order to participate in the study. The participants had the right to withdraw or change any statements that was transcribed and validated.
The researcher’s role in the study may affect the outcome, to give the reader an insight into what prejudices this can create. The researcher was as transparent as possible and described which decisions were made or not in the study. Because of secrecy, specific information about the company and their SST was not be carried out in this report. Also, all respondents were anonymous to protect their integrity.