J
Ö N K Ö P I N GI
N T E R N A T I O N A LB
U S I N E S SS
C H O O L JÖNKÖPING UNIVERSITYEquity funds – and the Relationship
between Return and Administration
Fees
Bachelor Thesis within Economics
Authors: Per Adolfsson & Jon Christensson Tutors: Prof. Ulf Jakobsson
Daniel Wiberg
Bachelor Thesis within Economics
Title: Return and Administration Fee Relationship in Swedish
Mutual Equity Funds - Bank and PPM funds
Author: Per Adolfsson & Jon Christensson
Tutors: Prof. Ulf Jakobsson
Daniel Wiberg
Date: January 2007
Subject terms: Mutual equity funds, Return, Administration fee
Abstract
The number of investmentfunds have dramatically increased in the last years and so have the interest in funds. 94% of the Swedish population between 18-74 years are investing in some kind of mutual fund. In 2005 the total fund capital was approximately 1.4 billion SEK. That makes this an important topic to investigate further.
Therefore this thesis purpose is to analyse if there is any relationship between administrationfees, returns, the risk-adjusted performances. Furthermore, does the performance of the Swedish mutual funds differ dependent on whether they are managed by banks or if they are listed as Premiepensionsmyndigheten (PPM) funds, or run by other mutual fund companies?
To analyse the problem a panel least square regression was used. The population consisted of 63 Swedish mutual equity funds over 20 quarters. Dummy variables were used to separate the banks- and PPM funds from the total population.
The findings are mixed compared to previous research. There seem to be no relationship between the return, the risk-adjusted return and the administration fee. This indicates that the fund companies do not set their administration fee based on the expected return.
However, a negative relationship was found between the market-adjusted return and administration fee.
In general, the banks, on average, outperformed, the mutual fund companies that were not bank and/or PPM funds, in return, risk-adjusted return and market-adjusted return. Further, the funds with some additional fee had the on average second lowest efficiency in terms of return on the market.
Kandidatuppsats inom Nationalekonomi
Titel: Avkastning och Förvaltningsavgift i Svenska Aktiefonder –
Banker och PPM fonder
Författare: Per Adolfsson & Jon Christensson
Handledare: Prof. Ulf Jakobsson
Daniel Wiberg
Datum: January 2007
Ämnesord: Aktiefonder, Avkastning, Förvaltningsavgift
Sammanfattning
Antalet investeringsfonder och intresset för dessa har under de senaste åren ökat drama-tiskt. 94 % av den svenska befolkningen mellan 18-74 år sparar i någon form av fond. Un-der 2005 uppgick det totala fondkapitalet till ungefär 1,4 miljarUn-der SEK. Det gör detta till ett viktigt ämne att studera vidare.
Syftet med denna uppsats att analysera om det är något samband mellan förvaltningsavgif-ter, avkastning, riskjusterad avkastning och marknadsanpassad förvaltningsavgift och av-kastning i svenska aktiefonder. Vidare, skiljer sig prestationen mellan fonder beroende på om de är förvaltade av banker, listade som premiepensionsfonder eller förvaltade av andra fondbolag?
För att analysera dessa frågor användes ’panel least square’ regressioner. Populationen be-stod av 63 aktiefonder inom en tidsram av 20 kvartal. Dummy variabler användes för att särskilja bank- och premiepensionsfonder från den totala populationen.
Observationerna visade liksom tidigare forskningen blandade resultat. Ingen relation hitta-des mellan avkastning, riskjusterad avkastning och förvaltningsavgift. Detta indikerar att fondbolagen inte tar hänsyn till den förväntade avkastningen när de fastställer sin förvalt-ningsavgift, vilket överensstämmer med tidigare forskning.
Ett negativt samband hittades emellertid mellan den marknadsanpassade avkastningen och förvaltningsavgiften.
Generellt presterade banker i genomsnitt bättre än fondbolag som varken var bank- och/eller premiepensionsfonder när det gäller avkastning, riskjusterad avkastning och marknadsanpassad avkastning. Vidare, fonderna med någon avgift utöver förvaltningsavgif-ten var de med den i genomsnitt näst sämsta gällande avkastning.
Contents
1
Introduction ... 1
2
Background ... 2
2.1 Risk and Return...2
2.2 Banks ...3
2.3 PPM...5
2.4 Fund fees ...6
2.5 Capital Gain Tax...6
3
Theoretical framework... 8
3.1 Portfolio Theory and Capital Asset Pricing Model ...8
3.2 Risk-adjusted Performance and the Sharpe ratio ...9
4
Empirical Analysis ... 11
4.1 Limitations ...11 4.2 Data...11 4.3 Method ...13 4.4 Result ...165
Discussion ... 20
5.1 Regression 1 ...20 5.2 Regression 2 ...20 5.3 Regression 3 ...21 5.4 Regression 4 ...225.5 Previous research and the critique on banks...22
5.6 Caveats ...23
6
Conclusion ... 24
6.1 Further Studies ...24
Tables
Table 2.1 Standard deviation variables ...3
Table 2.2 Fund capital...3
Table 4.1 Descriptive statistics...11
Table 4.2 Regression variable description ...14
Table 4.3 Regression 1 ...15
Table 4.4 Regression 2 ...16
Table 4.5 Regression 3 ...16
Table 4.6 Regression 4 ...17
Figures
Figure 3.1 The Market Portfolio...9Diagram
Diagram 4.1 Average Fund Capital ...131
Introduction
Today 94% of the Swedish population, in the range 18-74 years, invest in some kind of mutual fund. Subtracting the premiepensionsmyndigheten (PPM) funds, the figure is still as high as 77%.1
The interest for mutual funds is growing and with that the amount of mutual fund companies. In 1994 there were around 350 Swedish mutual funds on the market but in the following nine years the amount increased dramatically to more than 2600.2
With a mutual fund one can earn a higher return than in a savings account, but still only take a relatively small risk. On the other hand, funds most often have some kind of fee involved, whereas savings accounts have none. Thus, for the rational individual, the benefits of investing in a fund must more than cover the fees and the interest gained from a savings account.
Even small variations in returns and fees of funds do make a huge difference in the long run. One would suspect that there is some kind of relationship between fees and returns of different funds. How else can a rational individual agree to invest in a fund with a high fee? If this is not the case, how can these funds endure?
Therefore this thesis examines if there is any relationship between administration fees, returns and the risk-adjusted performances of Swedish mutual equity funds. Furthermore, does the performance of funds differ dependent on whether they are managed by banks, listed as Premiepensionsmyndigheten (PPM) funds or run by other mutual fund companies?
In section 2, a more indepth background of the problem is given and some important concepts are clarified. Section 3 presents the theories used in the analysis, which is covered in section 4. Also, section 4 presents a description of the data and the method used. Section 5 canvasses the empirical findings along with a discussion of caveats. Lastly, conclusions are drawn and further studies are suggested in section 6.
1Fondbolagens förening, Fondsparandet i ett 10-årsperspektiv 1994-2004, 2004
2
Background
There is an ongoing debate regarding to what extent fees are related to returns in a mutual fund. The Swedish Investment Fund Association states that most research indicate that there is no relationship between fees and returns in mutual funds. (fondbolagens förening, fakta om fonder och konkurrens, 2006)
However, Dellva and Olson (1998) showed a relationship between fees (12b-13, redemption fee4 and front-end load5) and risk-adjusted performance. Funds with 12b-1 and redemption fees tended, on average, to perform better than funds without, whereas funds with front-end load fees performed worse.
‘Nya Privata Affärer’ found that low fee funds are the best choice in the market; that they gave a relative large return despite their low fee. (Arnell, 2006)
A similar result was found by Magnus Dahlquist, Stefan Engström and Paul Söderlind (2000) who researched the Swedish equity fund market and came to the conclusion that “large equity funds tend to perform less well than small equity funds… high-fee funds tend to underperform relative to low-fee funds… actively managed equity funds perform better than more passively managed.” (Dahlquist, Engström & Söderlind, 2000, p.2).
Another finding concerning the fees has come from Mcleod and Malhotra (1994). They found that large funds can utilize economies of scale6. Latzko (1998) came to the same conclusion, stating that mutual funds have the ability to make use of economies of scale due to the fact that they often have fixed costs. When the fund grows the fund expenses relative to average net assets ratio decreases. Hence, the fund will obtain a downward sloping average cost curve.
As seen above, the findings have been mixed. Some say there is a relationship between returns and fees and some say there is not. This indicates that further studies in the subject are necessary and maybe the difference in the results lies deeper within the problem. To try to pinpoint the problem some concepts need to be clarified.
2.1 Risk and Return
The return is what you earn from investing in any kind of asset. It is quite logical that a person wants to earn the highest possible return at the least amount of risk (Elton & Gruber, 1995). The return of a fund is divided into capital returns or losses (the fluctuation in value of a security) and income (interest yields or dividend payments) (Simons, 1998). The return given is most often compared to a benchmark of some sort which usually is a 90-day Treasury bill7 (Morningstar, Ordlista, 2006). This treasury bill is usually referred to
3 A fee to cover marketing costs and sometimes selling of fund shares and service to the client. This fee is
included in the administration fee in Sweden.
4 A form of selling fee. 5 A form of buying fee.
6 Cited in Korkeamaki & Smythe, 2004 7 ‘Tre månaders statsskuldväxel (SSVX)’
as ‘risk free’ because it is issued by the government which is considered ‘safe’ from going bankrupt.8 Therefore, the excess return is equal to the return minus this ‘risk free return’ (Simons, 1998).
The fact is that from 1994-2004 equity funds had the best average return per year out of all the funds. They had a greater volatility over the years but in the end, they ended up with a higher return in the estimated time period than the mixed and interest funds. (Fondbolagens förening, Avkastning för olika fontyper 1994-2004)
Risk and return are very closely related. As said before, the rational investor wants the least risk with the highest possible return.
There are a number of different ways to measure the risk but the most basic and well known is the standard deviation. The standard deviation shows how the fund has fluctuated during the given time periods. This measure is calculated in the following way: σ = √[1/T * ∑(Rt – AR)2 ]
Table 2.1 Standard deviation variables Variable Meaning
σ Standard deviation
T Number of quarters
AR Average return every quarter
Rt Fund’s return at the given time period
2.2 Banks
The four big banks in Sweden are Handelsbanken, SEB, Nordea and Swedbank. In table 2.2 the four big banks’ fund capital is shown and the percentage share of the fund capital in the whole market.
Table 2.2 Fund capital
Fund Company 2000 2001 2002 2003 2004 2005 Handelsbanken 88.675 (9.9%) 98.571 (11.1%) 87.192 (12.1%) 110.538 (12.2%) 135.025 (13.0%) 180.480 (13.1%) Nordea 163.230 (18.2%) 161.692 (18.3%) 124.099 (17.2%) 145.026 (16.1%) 155.078 (14.9%) 189.992 (13.8%)
SEB 175.865 (19.6%) 159.156 (18.0%) 121.394 (16.8%) 147.654 (16.3%) 162.124 (15.6%) 210.575 (15.3%) Swedbank 287.874 (32.0%) 262.611 (29.7%) 203.410 (28.2%) 245.165 (27.1%) 276.344 (26.6%) 349.271 (25.4%) Total Bank 715.644 (79.7%) 682.030 (77.1%) 536.095 (74.3%) 648.383 (71.7%) 728.571 (70,1%) 930.313 (67.6%) Other fund companies 182.751 (20.3%) 202.155 (22.9%) 185.506 (25.6%) 254.741 (28.2%) 308.957 (29.8%) 444.177 (32.3%) Total9 898.395 (100%) 884.185 (100%) 721.601 (99.9%) 903.124 (99.9%) 1 037.528 (99.9%) 1 374.495 (99.9%)
(Source: Svenska Bankföreningen, Bank- och finansstatistik, 2005)
As seen in table 2.2, the banks have had and continue to have an oligopoly like structure; they still have a very large share of the fund capital market. (Konkurrensverket, 2005). One can see that the fund capital has increased during recent years, but the banks are loosing more and more newly invested capital to the other fund companies.
In recent years the banks have only received 50% of newly invested capital into funds. This is due in part, to the loss of the market edge banks used to hold thanks to the once-popular ‘allemansfonderna’10. In addition, there has been an increase in competition as more firms enter the market. (Fondbolagens förening, fakta om fonder of konkurrens, 2006)
All banks except Handelsbanken have seen an outflow of capital in their equity funds during the last years. According to Niklas Lundberg, MD of Indecap, this is greatly due to their inability to be flexible in the fund market by managing their own fund companies (Macéus, 2006).
While there are as many as 127 different banks in Sweden, in 2005 only 3% of the Swedish population changed banks, according to Länsförsäkringar. Remarkably, almost 50% of the population think that there is a better bank on the market, nevertheless most choose to remain with their current one. The explanation given by Länsförsäkringar is that people find it difficult and time consuming to switch banks. However, those that do change are generally pleased with their decision. (Länsförsäkringar, Kunders rädsla för krångel sätter stopp för bankbyte, 2006)
Another explanation comes from a survey done by ‘Svenskt kvalitetsindex’11 who found that the customer satisfaction of bank customers has increased during recent years (Svenskt kvalitetsindex, Bankerna 2005 enligt Svenskt kvalitetsindex, 2005)
Although the bank customers are pleased, the banks are still making substantial profits. From the administration fee alone the banks had a total estimated revenue of 5 billion SEK during the first half of 2005. More than half of the administration fund fee is pure profit,
9 Some rounding errors are present and the fund capital is given in million SEK
10 Basically equity funds that were distributed by banks and were rather beneficial to the public due to a tax
relief.
according to Mats Wester, editor-in-chief of the magazine Sparöversikt. (Huldschiner, 2005)
An explanation for the low percentage of people changing banks and the substantial profits may be the ‘lock-in’ effect that the banks utilize. They do this by bundling their services, meaning that one might obtain some discount for having all their assets in a particular bank. It also affects the ability of the individual to compare costs and services. (Konkurrensverket, Konkurrens i Sverige 2005, 2005)
Still, the banks have received considerable critiquefrom the media. Some of the criticisms is already mentioned. Other like the article in Dagens Industri, Storbanker ligger kvar i fondbotten, claim that the big banks funds are among the worst funds in the Swedish fund market. (Svensson, Storbanker ligger kvar i fondbotten, 2006)
2.3 PPM
In the year 2000, the Swedish citizens selected their PPM funds for the first time. The Swedish government had earlier decided upon a legislative change in the pension system to cope with the upcoming future problem of pensions. The new pension system was designed to better follow the economic and demographic development (Brantmo 2001). The pension is now based upon the individuals taxable lifetime earnings. Even if you are unemployed or home with children, you are receiving money for your future pension. The highest one can earn during one year for the future pension was in 2006 equal to 333 750 SEK, which is equal to 7.5 Swedish income base amount. The pension can be divided into three different types: the guarantied pension, the income pension and the premiepension. (Försäkringskassan, Pensionssystemet, 2006)
If you have not earned any money or not a sufficient amount during your lifetime, you will receive the guarantied pension. In the year 2006, this amount is 7047 SEK per month for unmarried and 6286 SEK per month for married person. Sometimes this pension can be increased to also cover a part of the housing expenses. (Försäkringskassan, Garantipension, 2006)
There are two other types of pensions; the PPM fund and the income pension. When earning over a specific amount, the individual is not entitled to the guarantied pension, but instead receives one of these two types. The income pension is the pension one earns when, for example, working, unemployed, or home with children. The income pension system works in the following way; as the individual lends money to the people that are pensioner today, he/she then receives the money back when one becomes a pensioner him/herself. (Försäkringskassan, Inkomstpension, 2006)
The premiepension does not work like the income pension. Rather than the money being paid to today’s pensioner, it is instead invested in different kinds of equity funds of one’s choice. This money is then paid out to you when you become a pensioner. The individual must pay 2,5% of the income towards the pension every year, a maximum of 8344 SEK in 2006 (calculated based upon the maximum one can earn for pensions in 2006, 333 750 SEK). If the individual is born between 1938-1953 it will be somewhat different. This is because the system has been changed and they will be in-between. The future pension is dependent upon the return of the funds in which one has invested. Even small differences have a large effect from a long-term perspective and studies have shown that between 0-30% of the pension comes from the PPM funds. (Försäkringskassan, Premiepension, 2006)
To be as beneficial to the public as possible, PPM have agreements with the specific fund companies to have a lower fee than normal which is enforced by the government. One can also switch funds without cost12 within the system. (PPM, Avgifter, 2006)
2.4 Fund fees
There are three commonly used fees for funds in Sweden. These fees are administration fees, buying fees and selling fees. There are also performance fees which are relatively rare in Swedish mutual equity funds.
Administration fee
The most common fee is the administration fee. It is supposed to cover the cost of the administration of the fund, as well as the cost of the staffing, counselling, information distribution, and so on. The administration fee differs between different fund companies, since it matters in which branch the funds are invested, and also, for example, if counselling is included. (Fondbolagens förening, fakta om fonder och konkurrens, 2006) From an international perspective, Sweden has relatively low fees, and it is unique in the sense that all fees are made public in their annual report. In 2004, Sweden had the lowest unweighted total expence ratio (TER) in the whole of Europe for mutual equity funds that were actively administrated, as well as the third lowest weighted13 TER on the continent. However, it is the unweighted TER that is of interest to the investor. (Fondbolagens före-ning, fakta om fonder och konkurrens, 2006)
Buying, selling and performance fee
Buying and selling fees are charged when one either buys or sells a fund. Performance fee, on the other hand, is a fee that is charged, for example, quarterly or yearly as a percentage of the over-performance. Over-performance is measured according to how a fund performs relative to a benchmark. The performance fee is a relatively rare fee in the Swedish mutual equity market and may act as an incentive for the fund administrator to perform better. (Morningstar, Ordlista, 2006)
2.5 Capital Gain Tax
The capital gain tax is just as it sounds; a tax on the gain from an asset. It is taxed as a percentage of the capital gained; currently 30% in Sweden. This tax is charged not only when selling the fund, but also when trading it.
It has been argued by Konkurrensverket that the capital gain tax hinders competition in the fund market. It acts as a kind of ‘lock-in’ mechanism which makes the investors less likely to change funds. Due to this, Konkurrensverket has suggested that the capital gain tax be ‘moved’ to the final sale date. (Konkurrensverket, Konkurrens i Sverige 2005, 2005)
12 No capital gain tax (reavinstskatt) nor return tax (avkastningsskatt) 13 They are weighted according to the fund size.
This ‘lock-in’ mechanism was confirmed in a survey done by SIFO Research International14 in 2005. They found that 36% of people taking the survey would change funds more often if the capital gain tax was moved as suggested by the Konkurrensverket. (Fonbolagens förening, Var 3:e fondsparare skulle byta fonder om uppskov infördes, 2006)
14 Previously SIFO Research & Consulting, and before that Svenska Institutet för Opinionsundersökningar
3
Theoretical framework
A fund is constituted of several different assets and, therefore, is a form of asset portfolio. The fund administrator’s task is to manage these assets in the best possible way. With portfolio management, the administrator tries to obtain the highest possible return with the lowest possible risk.
The first section, 3.1, deals with the portfolio theory and the Capital Asset Pricing Model (CAPM). Section 3.2 continues with the risk-adjusted performance ratios and considers the Sharpe ratio.
3.1 Portfolio Theory and Capital Asset Pricing Model
The portfolio theory was first developed by Markowitz (1952). In this article, he showed how one could acquire a higher return in a portfolio of stocks than in an individual stock, the former also with a lower risk. This article is the foundation of all investments techniques we have today. Markowitz (1991) says, “My work on portfolio theory considers how an optimizing investor would behave, whereas the work by Sharpe and Lintner on the CAPM is concerned with economic equilibrium assuming all investors optimize in the particular manner I proposed.” (Markowitz, 1991, p. 469)
From the work of Markowitz, the Modern Portfolio Theory was developed by authors like Sharpe, Lintner, and Mossin, among others. These authors have independently brought forward evidence of the relationship between expected returns and the risk. Therefore this model is often also called the Sharpe-Lintner-Mossin capital asset pricing model. (Elton & Gruber, 1995)
In this theory the portfolio has two risks; systematic risk (often called market risk) and unsystematic risk (also known as specific risk). The thought behind this is that the investor can diversify the portfolio in such a way as to eliminate the unsystematic risk; one can ‘spread out’ the risk enough for it not to matter. The systematic risk, on the other hand, is impossible to diversify away, and it is also for this risk that investors are expected to demand a higher return.
The CAPM model attempts to depict the general equilibrium of the relationship between expected returns and risk. This is the most basic model and it requires numerous assumptions. When completed, it is a simplistic and understandable model for the capital markets. However, the various assumptions used in the model also make it unreliable and unsuitable for prediction of the market situation today and how one should invest. (Elton & Gruber, 1995)
In figure 3.1, one can see the expected return on the y-axis and the standard deviation as risk on the x-axis. The risk-free rate is given by the capital market line (CML) which is a straight line and the straightness of the line will not change as the market risk changes. (Alexander, Sharpe & Bailey, 2001)
Point M, where the efficient frontier is tangent to the CML, is the most efficient point, in terms of risk and return, in the market. It is where every investor wants to invest and if all assumptions of this model would be fulfilled, this would be a stable equilibrium. The second most efficient investment is every point on the CML
because here one can diversify away the unsystematic risk. (Alexander et al., 2001)
When the assumptions are fulfilled and every investor holds the market portfolio, they are only interested in the market risk. The market risk is the only thing that will affect their expected return through the slope of the capital market line. The slope of the capital market line is affected by all the assets in the market. When a high risk asset (high standard deviation) enters the market, the effect on the capital market line is greater than if an asset with a small risk would enter. Basically, it is dependent on the assets covariance to the market portfolio. These riskier assets must logically then yield a greater return to appeal the investors (Alexander et al., 2001).
3.2 Risk-adjusted Performance and the Sharpe ratio
There are three different risk-adjusted performance measures that are commonly used; Sharpe index, Jensen’s alpha and Treynor index.
Jensen’s Alpha compares the average return with the expected return according to the CAPM model (Jensen, 1968). The Treynor index is different from the Sharpe ratio in the sense that the Treynor (1965) index is based on systematic risk, while the Sharpe (1966) ratio is based on the total risk of the fund (Alexander et al. 2001).
However, the Sharp ratio will be used in this paper because it is probably the most well-known risk measure used in the industry.
The Sharpe ratio, also called the reward-to-variability ratio, is a ratio that tells the investor how much return a fund gives compared to the risk it has (Simons, 1998). The ratio, named after William Sharpe (1966), uses the standard deviation of portfolio returns as the total risk measure.
The Sharpe ratio is based on the trade-off between risk and return. The higher the ratio, the more the fund gives in return per risk. This means that any investor, regardless of how risk tolerant he or she is, should invest in the fund with the best combination of risk and return. That is the most ‘efficient’ fund (Simons, 1998).
The Sharpe ratio is most useful for investors who are investing all their money in one fund. Simons (1998) claims that, if CAPM explained previously holds, “then the market portfolio is, in fact, the portfolio with the highest Sharpe ratio” (Simons, 1998, p. 45).
The Sharpe ratio should be used and compared for funds that are on the same market, otherwise it may be misleading. This is because it does not take correlations between funds returns into consideration. How high the Sharpe index is varies based upon which market the fund focuses. (Simons, 1998)
The Sharpe ratio is calculated as follows: Sharpe ratio = (Ri – Rf) / σ
4
Empirical Analysis
In section 4.1 the limits of the thesis is discussed. Next, in section 4.2, the data is presented and interpreted. Further, in section 4.3, the method used is presented. Lastly the results are displayed in section 4.4.
4.1 Limitations
There are a number of different funds from which a person can choose; equity funds, mixed funds, interest funds and hedge funds. However, this empirical analysis is confined to only deal with Swedish mutual equity funds. Morningstar defines this as “Sweden Large-Cap Equity funds invest primarily in the equities of large-cap Swedish companies. Equities in the top 70% of the capitalisation of the European equity market (including the UK) are defined as large-cap. These funds invest at least 75% of total assets in equities and invest at least 75% of equity assets in Swedish equities.” (Morningstar, Category Definitions, 2006) The banks among the Swedish mutual equity funds are limited to only deal with the four ‘big’ banks in Sweden; Nordea, SEB, Handelsbanken and Swedbank (Robur). Further, the empirical analysis only deals with funds that have existed from the 4th quarter, 2001 till the 3rd quarter, 2006. The given time period has a fairly good trade-off between amount of funds and operating time (quarters). Also, the market has had some fluctuations in the time period which make the analysis more realistic.
4.2 Data
The return and the fee data have been collected from Morningstar15. While the return data was collected quarterly, the administration fee is assumed to be constant over the time period. The risk-adjusted performance measured as the Sharp ratio was calculated with data from Morningstar and EcoWin.
The dataset consist of all Swedish mutual equity funds that have been active during the specified time period. The descriptive statistics is presented in table 4.1.
Table 4.1 Descriptive statistics
N Minimum Maximum Mean σ
Return of all funds 1260 -30.50 29.30 3.4976 11.68042
Banks’ Return 360 -30.50 26.40 3.6428 11.96920
PPM funds’ Return 600 -30.50 29.30 3.5767 11.53111
‘Others’ Return 420 -30.40 28.40 3.2774 11.72903
Fee for all funds 1260 0.05 0.63 0.2863 0.12993
Banks’ Fee 360 0.13 0.63 0.3243 0.11292
PPM funds’ Fee 600 0.05 0.43 0.2213 0.11838
‘Others’ Fee 420 0.08 0.44 0.3423 0.11296
Risk-adjusted performance for all
funds 1260 -3.63 2.24 0.0696 1.06396 Risk-adjusted performance, bank funds 360 -3.10 1.77 0.0766 1.03064 Risk-adjusted performance, PPM funds 600 -3.10 2.10 0.0714 1.03058 Risk-adjusted performance, ‘Others’ funds 420 -3.01 1.89 0.0459 1.03320 Over/Under, all funds’ Return 1260 -23.79 13.08 0.0041 1.85924 Over/Under, banks’ Return 360 -8.39 13.08 0.1453 1.57428 Over/Under, PPM funds’ Return 600 -23.79 7.31 0.0838 1.82962 Over/Under, ’Others’ Return 420 -10.09 8.85 -0.2147 2.03778 Over/Under, Buy/Sell/Performance funds’ Return 560 -23.79 13.08 -0.1435 2.18444 Over/Under, all funds’ Fee 1260 -0.24 0.34 0.0000 0.12993 Over/Under, banks’ Fee 360 -0.16 0.34 0.0380 0.11292 Over/Under, PPM funds’ Fee 600 -0.24 0.14 -0.0651 0.11838 Over/Under, ’Others’ Fee 420 -0.21 0.15 0.0560 0.11296 Over/Under, Buy/Sell/Performance funds’ Fee 560 -0.24 0.15 0.0079 0.11585
The data in table 4.1 is shown as quarterly data and one can see that both bank (3.64%) and PPM (3.58%) funds have a higher average return than the other fund companies (3.28%).
Looking at the average administration fee, one can also see that the bank (0.32%) and PPM (0.22%) funds again are better than the other fund companies (0.34%). The bank and PPM funds were better in the sense that they had a lower average administration fee during the same time period.
The ‘Over/Under’-variables can be seen as ‘market-adjusted variables’16. Looking at the return, the bank funds (0.15) had the highest, followed by the PPM funds (0.08) and lastly the other fund companies(-0.25). Further, examining the fee of the funds one can see that the PPM funds (-0.07) has the lowest, followed by the bank funds (0.04) and the other fund companies (0.06). In short, the bank funds yielded the best return, while the PPM funds had an administration fee lower than the market administration fee.
Moving on to the risk-adjusted performance measure, the Sharpe ratio, one can see that the bank funds (0.08) again come out on top, followed by the PPM funds (0.07) and lastly the other fund companies (0.05).
Comparing bank and PPM funds one can see that the banks had an average higher return and risk-adjusted return than the PPM funds. However, the PPM funds had the lowest average administration fee.
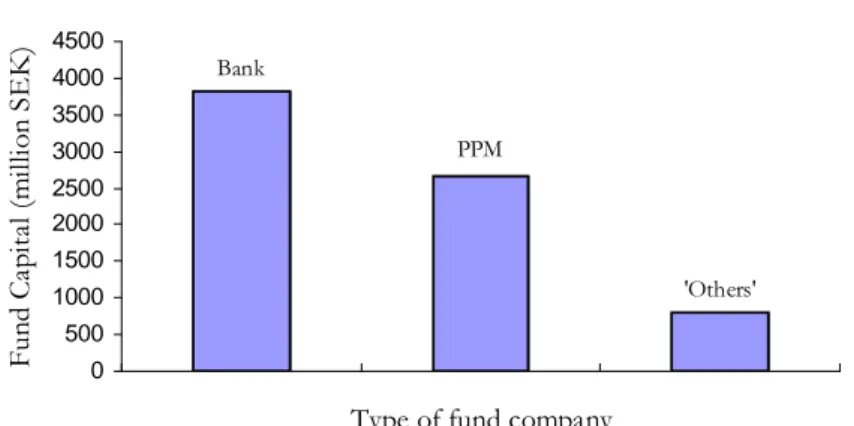
Diagram 4.1 Average Fund Capital
Average Fund Capital
PPM Bank 'Others' 0 500 1000 1500 2000 2500 3000 3500 4000 4500
Type of fund company
F un d C ap ita l (m ill io n SE K )
In diagram 4.1 the average fund capital is displayed and, on average, the banks have clearly the highest fund capital, followed by the PPM funds and lastly, the ‘others’. This means that the bank funds are, on average, the biggest fund company on the Swedish mutual equity fund market, followed by the PPM funds and lastly the other fund companies.
4.3 Method
This thesis uses the panel least square regressions to statistically examine the data collected. A 95% confidence level is used to reject or accept the findings.
The estimation equation of the return and the administration fee is a multiple-regression and its basic form is given below:
Returnft = α 1+ α 2D2ft + α 3D3ft + β4Fees4ft + u ft Regression 1 To separate the bank and PPM funds from the population, dummy variables are used. The dummy variables can take on the value 1 or 0. If a fund is a PPM fund, the dummy variable will take on the value of 1. If it is not, then the value will be 0. The same is true for funds managed by banks.
Furthermore, the risk-adjusted performance values are calculated with the help of data from Morningstar and EcoWin. Since only Swedish mutual equity funds are examined, the Sharpe ratio can be used as the risk-adjusted performance measure.
To adjust the dataset to the Swedish mutual equity fund market, over/under values were calculated from the return and the administrative fee:
Over/Under-Return = Return of the individual fund – [(∑Return) / N of funds] Over/Under-Fee = Fee of the individual fund – [(∑Fee) / N of funds]
To test the relationship between administration fee and risk-adjusted performance, the following regression is estimated:
Risk-Adjusted Performanceft = α 1+ α 2D2ft + α 3D3ft + β4Fees4ft + uft Regression 2 The third regression run is with the market-adjusted return and the market-adjusted administration fee. This is done with the following regression:
Over/Under-Returnft = α 1+ α 2D2ft + α 3D3ft + β4Over/Under-Fees4ft + uft Regression 3
Due to the limitation of including the administration fee as the only fee, an additional regression is run, regression 4. This regression includes a third dummy variable to separate the funds with any sort of selling, buying and/or performance fee. This will be done in the best performing regression.
Table 4.2 Regression variable description
Variable Meaning
Returnt The individual fund’s return at time t Fee The individual fund’s administrative fee
Over/Under-Returnt The over or under performance of the market return
Over/Under-Feest The over or under administrative fee of the market administrative fee
Risk-Adjusted Performancet The Sharpe Ratio
DBank Dummy variable for ‘big’ bank fund; 1 if bank fund, 0 otherwise
DPPM Dummy variable for the individual PPM fund; 1 if PPM fund, 0 otherwise
4.4 Result
The first regression tests the relationship between the fund returns and fees and also includes dummy variables on bank and PPM funds. The following regression was estimated:
Returnft = α 1+ α 2D2ft + α 3D3ft + β4Fees4ft + u ft Regression 1
The parameter estimates are presented in Table 4.3.
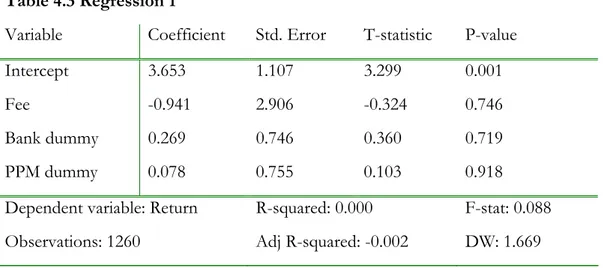
Table 4.3 Regression 1
Variable Coefficient Std. Error T-statistic P-value Intercept 3.653 1.107 3.299 0.001
Fee -0.941 2.906 -0.324 0.746
Bank dummy 0.269 0.746 0.360 0.719
PPM dummy 0.078 0.755 0.103 0.918
Dependent variable: Return R-squared: 0.000 F-stat: 0.088 Observations: 1260 Adj R-squared: -0.002 DW: 1.669
From the estimates, we can see that both the F-statistic and all variable’s p-values indicate that there is no significant relationship between return and fee among the funds.
Since the dummy variables can take on the same value simultaneously one cannot use the intercept term to separate the ‘others’ in the population. However, without the intercept the regression would have been forced through the origin which would yield misleading results.
One can see from the Durbin-Watson figure that there is a slight positive autocorrelation and this might affect the interpretation of the variables. It indicates that the regression is plagued by a correlation between the error terms. However, this is ignored due to the high insignificance of the whole regression and we assume that any correction for the autocorrelation would make no difference to the outcome.
The second regression tests if the risk-adjusted performance has any relation to the fee. The following regression was estimated:
Risk-Adjusted Performanceft = α 1+ α 2D2ft + α 3D3ft + β4Fees4ft + u ft Regression 2 The parameter estimates are presented in Table 4.4.
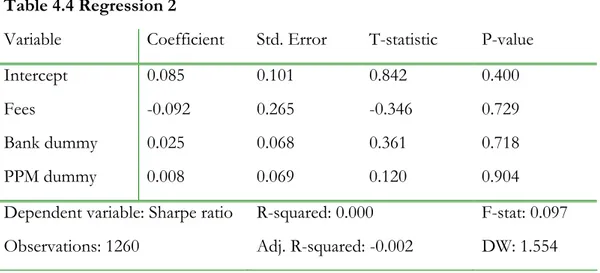
Table 4.4 Regression 2
Variable Coefficient Std. Error T-statistic P-value Intercept 0.085 0.101 0.842 0.400
Fees -0.092 0.265 -0.346 0.729
Bank dummy 0.025 0.068 0.361 0.718
PPM dummy 0.008 0.069 0.120 0.904
Dependent variable: Sharpe ratio R-squared: 0.000 F-stat: 0.097 Observations: 1260 Adj. R-squared: -0.002 DW: 1.554
The findings clearly show that there is no relationship between the risk-adjusted performance, Sharpe, and the fund fee. None of the individual p-values and t-values are significant and the F-value for the whole regression is also insignificant at the 5% significance level. Again, the autocorrelation is ignored due to the high insignificance of the whole regression.
In an attempt to adjust the dataset to the Swedish mutual equity fund market, the Over/Under values of the return and administration fee was calculated and the following regression was estimated:
Over/Under-Returnft = α 1+ α 2D2ft + α 3D3ft + β4Over/Under-Fee4ft + uft Regression 3
The parameter estimates are presented in Table 4.5.
Table 4.5 Regression 3
Variable Coefficient Std. Error T-statistic P-value
Intercept -0.106 0.087 -1.224 0.221
Over/Under-Fee -0.985 0.461 -2.139 0.033
Bank dummy 0.265 0.118 2.237 0.025
PPM dummy 0.073 0.120 0.610 0.542
Dependent variable:
Observations: 1260 Adj. R-squared: 0.006 DW: 1.990
From the estimates we now see that the F-value is statistically significant within a 95% confidence interval17, as are also all p-values except the value for the PPM-funds and intercept variable.
The Over/Under-Fee variable is statistically significant at a 95% confidence interval. If one increases the Over/Under-Fee by 1%, the Over/Under-Return decreases by 0.99%, ceteris paribus. Furthermore, the bank dummy variable is also significant at the same confidence interval and it has a higher intercept (0.27) than the market-adjusted fee variable (Over/Under-Fee, -0.11).
The R-square value is still very low and the variables in the population only explain 0.8% of the change in the return. According to the Durbin-Watson statistic, there is no autocorrelation present in the estimation.
Regression 4 is run to separate the funds that have some other fee in addition to the administrative fee. The dummy variable is included in the best performing regression which in this case is regression 3 since it is the only significant regression.
Over/Under-Returnft = α 1+ α 2D2ft + α 3D3ft + α 4D4ft + β5Over/Under-Fee5ft + uft Regression 4
The parameter estimates are presented in table 4.6
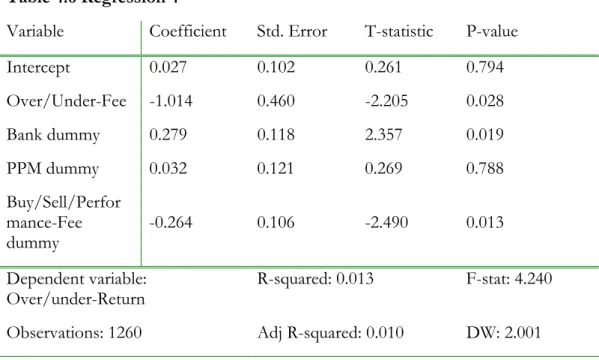
Table 4.6 Regression 4
Variable Coefficient Std. Error T-statistic P-value Intercept 0.027 0.102 0.261 0.794 Over/Under-Fee -1.014 0.460 -2.205 0.028 Bank dummy 0.279 0.118 2.357 0.019 PPM dummy 0.032 0.121 0.269 0.788 Buy/Sell/Perfor mance-Fee dummy -0.264 0.106 -2.490 0.013 Dependent variable:
Over/under-Return R-squared: 0.013 F-stat: 4.240 Observations: 1260 Adj R-squared: 0.010 DW: 2.001
The regression is significant at the 5% significance level according to the F-value. The variables Over/Under-Fee, Bank dummy and Buy/Sell/Performance-Fee are significant
looking at the p-value. According to the Durbin-Watson statistics, there is no autocorrelation present in the estimation.
5
Discussion
While common thought is that there is no relationship between the return and fee of a fund, this analysis shows that there actually may be a relationship. If this is not the case, how can these funds survive, or more specifically, how can rational investors keep investing in these funds?
In this section, the regression results will be discussed to try to determine the reason for the relationship or the lack thereof.
5.1 Regression 1
The results from regression 1 indicate that there is no relationship between the return and the administration fee of a fund. Based on this result, general idea of no relationship between the return and administration fee is correct.
It is obvious that the fund company sets their fees basedupon criteria other than expected return, such as promotion costs, facility costs, labour costs, etc. Of course, the fee varies from different fund companies due to size, location, investment and labour differences. Even in the same fund companies, the fund fee differs between individual funds due to how large the fund capital is and/or if the fund is a PPM fund.
From table 4.1, one can see that the total average administration fee of the Swedish fundsi was 0.29% per quarter. Of course, the PPM funds had the lowest average fee, 0.22% per quarter, due to their special agreements. They, in turn, were followed by the banks who had a quarterly fee of 0.32%, and finally the ‘others’ at 0.34% per quarter.
To continue, the total quarterly average return of the population was 3.50%. Interestingly, the ‘others’ had the lowest quarterly average return, even though they are, in general, more specialized than the bank and PPM funds. The bank funds had the highest quarterly average return of 3.64% followed by the PPM funds at 3.58%. However, the bank funds are found to have the most risk, the highest standard deviation, (11.97) followed by the ‘others’ (11.73) and the PPM funds (11.53).
Although there is no relationship between the administration fee and the return of a fund, one can still see that the banks have, on average, performed better than all other fund companies in the market during the given time period, though associated with a slightly higher risk.
5.2 Regression 2
The findings in regression 2 again show that there is no relationship between the return and the administration fee, but now the return is measured as risk-adjusted performance (the Sharpe ratio). None of the variables are statistically significant at the 95% confidence level. This, however, was expected since there was no relationship found in regression 1 between returns and administration fees.
The quarterly average Sharpe ratio for all the funds in this time-period was 0.07%, as can be seen in table 4.1. The banks and the PPM funds had the highest Sharpe ratio with 0.08 and 0.07 respectively. Once again, the ‘others’ performed worst of these three fund companies with a Sharpe ratio at 0.05. This means that the ‘others’ had the lowest
risk-adjusted quarterly average return in this time period. Again, the bank and PPM funds performed better than the ‘others’.
5.3 Regression 3
In regression 3, the relationship between the market-adjusted return and the market-adjusted fee is analyzed. Also, the bank, PPM and the ‘others’ fund companies are examined. The regression is found to be statistically significant due to a high F-value (3.57). All variables, except the intercept term for the market-adjusted fee and the PPM dummy variable, had a sufficientlylow p-value, making them significant at the 5% significance level.
Looking at the R-square value, only 0.80% of the variation in the Over/Under-Return is explained by the explanatory variables. This is very low and merely indicates that the administration fee is not a good explanation to the variation in the return which of course is fairly logical. The fund companies do not know the return, they do not have the privilege of having perfect forecasting ability, hence the low R-square value.
Focusing upon the market-adjusted administration fee, the Over/Under-Fee variable, one can see that if the Over/Under-Fee increases by 1%, the Over/Under-Return will actually decrease by 0.99%, ceteris paribus18.
In other words, this means that as the fund companies raises their administration fee compared to the market average administration fee, the return compared to the market average return for the investor actually decreases, and the individual ends up in a worse situation than before. The change in the market-adjusted administration fee is almost the same as the change in the market-adjusted return. This of course shows in the slope of the estimated equation being very close to 1 (0.99).
From the results of regression 3, one can say something about how the banks and PPM funds compare to the whole population. The dummy variables in the regression all have the same slope as the total population of funds, of course, but they have a different intercept. The equality of the slope is rather irrelevant to the study at hand since its purpose is not to estimate projections, but only to examine whether or not there is a relationship between the return and the administrative fee in this specific time period.
To continue, by focusing upon the bank dummy variable, one can see that it is significant at the 5% level. The value of the coefficient represents the intercept which was estimated to 0.27. This means that the bank funds have over-performed the market since 0.27 > 0. Due to the lack of significance of the intercept terms for Over/Under-Fee and PPM dummy, one cannot determine whether or not the banks have over-performed them in the market.
However, one can still interpret table 4.1 where the different quarterly average market-adjusted returns and administration fees for the population of funds are displayed. From there one can see that the banks had the highest quarterly average market-adjusted return (0.15%). They were followed by the PPM funds (0.08%). The ‘others’ had the lowest figure and actually under-performed the market due to a negative value (-0.22%).
Looking on the market-adjusted values of the administration fee, the PPM funds clearly have the lowest fee (-0.07%). They ‘over-performed’ the market in the sense that they had administration fees lower than the market average. The PPM funds were followed by the bank funds who had a slightly higher market-adjusted administration fee (0.04%) Again, the worst funds were the ‘others’ who had the highest market-adjusted administration fee (0.06%).
5.4 Regression 4
Due to the good properties of regression 3 it is the base for regression 4 where the dummy variable for buying/selling/performance fee is incorporated. The purpose of this last regression is to see how funds with some additional kind of buying, selling or performance fee would perform in relation to the other funds.
The regression results give, unsurprisingly, similar findings to regression 3. All variables, except the intercept for the market-adjusted fee and the PPM dummy variable, are statistically significant at the 5% significance level.
As in regression 3, the bank funds come out on top and. The PPM funds are insignificant and cannot be compared to the bank funds. However, the additional fee dummy variable was significant and these funds were found to markedly under-perform the market (-0.26 < 0). This under-performance is also seen in table 4.1. The market-adjusted additional fee funds had a negative market-adjusted quarterly average return of -0.14%, barely better than the ‘others’ who were the worst performers. In the market-adjusted administration, the additional fee companies actually had a fairly decent administration fee (0.01%), only the PPM funds were better. The most plausible explanation is that they can have a lower administrative fee due to all the other fees already charged.
5.5 Previous research and the critique on banks
Although none of the regressions were statistically significant in showing any relationship between the return and the administration fee of the funds, they, including the descriptive statistics, still showed an over-performance of the return of banks in the regular return, the risk-adjusted return and the market-adjusted return. They were only beaten by the PPM funds in the same categories when focusing upon the administration fee.
Comparing the results obtained to previous research, one can see that our results were not supported by the research of Dellva and Olson (1998) in the sense that they indeed found a relationship between the risk-adjusted performance and the administration fee which in this study was not found.
The results shown here were substantiated to some extent by the article in ‘Nya Privata Affärer’ in the way that the PPM funds had the lowest administration fee but were not the most efficient funds in terms of returns in the market. On average, the funds with the highest administration fee were the worst performers.
When comparing the results to the research of Dahlquist et al. (2000), the findings are mixed. Our findings were in line with their conclusion that high fee funds tended to underperform in relation to the low fee funds. However, our findings regarding the size of the fund and the performance were the opposite of the result of Dahlquist et al. (2000). Instead, our results showed that on average, the bigger funds (bank and PPM funds) actually had a better performance than the smaller funds (‘others’).
One explanation of the bank and PPM funds’ more efficient performance in the market might have been due to economies of scale which also was supported by the research of Mcleod and Malhotra (1994) and Latzko (1998). Due to economies of scale, the bigger funds can lower the costs and become more efficient.
Another reason as to why banks have a lower quarterly average fee than the ‘others’ might be due to their bundling of services and/or as a promotion intended to attract customers. An explanation for the ‘others’ higher administration fee may be because they are, in general, the ‘experts’ in the area and therefore might be expected to have a higher wage level.
Recently, Länsförsäkringar reported that ‘only’ 3% of the population changed banks last year due to loyalty to their bank and the difficulty of changing. However, our findings instead suggest a loyalty to the bank due to the relatively good performance in the Swedish mutual equity fund market. Furthermore, the media seems to have the preconceived notion that the banks are the ‘money stealing’ company in the market, when actually they are merely profit maximizers just like any other fund out there.
The banks, most likely try, as many others, to utilize the ‘lock-in’ mechanism to try to keep their customers. This might be one reason, other than economies of scale, as to why they have such beneficial administration fees. However, as it is now, every fund, except the PPM funds, have the capital gain tax as a ‘lock-in’ mechanism, unintentional though it may be.
Lock-in mechanism or not, it is strange that, on average, individuals accept a higher fee and a lower return. Why would a rational investor act in this manner? The most plausible explanation is due to information asymetries. There are so many funds on the market that it becomes almost impossible for the uninformed investor to keep track of the relationship between return and all different fees.
5.6 Caveats
There are some implications with the empirical data and method in this thesis that may cause some misleading estimation results. To bring these caveats forth, we address them here.
The first caveat is the assumption of a constant administrative fee. This, of course, affects the estimation to the extent that fees may change during the estimated period. However, it is not an unrealistic assumption. The administrative fees have most likely not been changed significantly enough to, in any greater matter, affect the results.
Further, the use of only 20 quarters in the estimation could have affected the results. To minimize the affect of this limitation, one can extended the time period studied. Again however, we do not believe that this will change the general findings of the analysis in any significant way.
Lastly, regression 1 and 2 experienced some degree of autocorrelation, but since both regressions were so far from being significant the autocorrelation was ignored.
6
Conclusion
Is there any relationship between the return and the fee of Swedish mutual equity funds? The answer is both yes and no. There was no relationship between the return versus the administration fee. Though, there was no relationship between the risk-adjusted performance and the administrative fee in the market.
However, there was a relationship between the over or under performance of a fund in the Swedish mutual equity fund market and the over or under administrative fee that the fund company charges in relation to the the Swedish mutual equity market.
The most surprising finding was the high performing bank funds. They were found to be the most efficient funds in market. Due to their generally large fund capital, they are most likely able to make use of economies of scale and in that way become more efficient in terms of risk, return and fees. This result indicate that the banks are not as bad as media perceives them to be.
The PPM funds were found to perform second best while having the lowest administration fees. The funds which were neither bank or PPM funds were the worst performers and consistently underperformed the quarterly average market in both in terms of the administration fee and the return.
The study also showed that funds that charge some kind of fee additional to the administrative fee (buying-; selling-; or performance fee) performed second worst, in terms of the return, in the market.
In short, our study finds that if people were to choose a fund in the Swedish mutual equity market, they should select a bank fund with the lowest possible administration fee and with no additional fees, such as buying, selling and/or performance fees. One can also conclude that the general public should become more aware of the fund market and make their own analysis rather than put too much trust in the popular media.
6.1 Further Studies
Even though no relationship between return and the administration fee was found, this study could be extended with other fund markets and over a longer time period to see if the relationships can be colaborated. Further, how can this non-relationship persist? How come individuals accept to pay a higher fee when they do not get rewarded for it? ´What are the underlying reasons for this? Is it maybe just that people in general are lazy, that they cannot find information or that the markets are inefficient? In this area, further studies needs to be done. Moreover, the topic of economies of scale in the bank fund market is intriguing, and a study of this in the Swedish market would be of great interest.
References
Alexander, G.J., Sharpe, W.S. & Bailey, J.V. (2001). Fundamentals of Investments, 3rd ed, Prentice Hall.
Arnell, K. (2006, October). Fonder med låg avgift ofta bästa valet. Nya Privata Affärer, nr 10, 92-93.
Brantmo, D. (2001). Premiepensionens riskjusterade avkastning. Unpublished manuscript, Stockholm University, Economics
Dagens Industri. (2006, October 27). Rekordhöga bankvinster – men Handelsbanken svek. Dagens Industri. Retrieved November 20, 2006, from http://di.se/Nyheter/?page=%2fAvdelningar%2fArtikel.aspx%3fArticleID%3 d2006%5c10%5c27%5c207882%26words%3dbank%26SectionID%3dEttan% 26menusection%3dStartsidan%3bHuvudnyheter
Dahlquist, M., Engström, S., & Söderlind, P. (2000). Performance and Characteristics of Swedish Mutual Funds. The journal of financial and quantities analysis. 35(3), 409-423.
Dellva, W.L. & Olson, G.T. (1998). The relationship between mutual fund fees and expenses and their effects on performance. The Financial Review. 33(1), 85-104. Elton E, J. & Gruber, J M. (1995). Modern portfolio theory and investment analysis. 5th ed,
Wiley.
Fondbolagens förening. Avkastning för olika fontyper 1994-2004. Retrieved December 9, 2006, from http://www.fondbolagen.se/upload/avkastning_1994-2004_001.xls Fondbolagens förening. (2004, September 02). Fondsparandet i ett 10-årsperspektiv 1994-2004.
Retrieved November 3, 2006, from
http://www.fondbolagen.se/upload/fondsparande_i_ett_10-årspektiv1994-2004.pdf
Fondbolagens förening. (2006, June 20). Fakta om fonder och konkurrens. Retrieved
November 3, 2006, from http://www.fondbolagen.se/upload/060620_fonder_och_konkurrens.pdf
Fonbolagens förening. (2006, July 5). Var 3:e fondsparare skulle byta fonder om uppskov infördes.
Retrieved December 17, 2006, from http://www.fondbolagen.se/Pressrum/Pressmeddelanden/060705%20Uppsk
ov.aspx?year=2006
Försäkringskassan. (2006, July 27). Inkomstpension. Retrieved November 16, 2006 from http://www.forsakringskassan.se/privatpers/pensionar/pensionssys/inkpen/ Försäkringskassan. (2006, July 27). Premiepension. Retrieved November 16, 2006 from
http://www.forsakringskassan.se/privatpers/pensionar/pensionssys/prepen/ Försäkringskassan. (2006, July 28). Garantipension. Retrieved November 16, 2006 from
Försäkringskassan. (2006, August 24). Pensionssystemet. Retrieved November 16, 2006 from http://www.forsakringskassan.se/privatpers/pensionar/pensionssys/
Huldschiner, H. (2005, August 25). Fonder ger bankerna miljardklirr i kassan. Dagens
Indu-stri. Retrieved November 21, 2006, from http://di.se/Nyheter/?page=%2fAvdelningar%2fArtikel.aspx%3fO%3dIndex
%26ArticleId%3d2005%5c08%5c25%5c154154
Jensen, M.C. (1968). The performance of mutual funds in the period 1945-1964. The Journal of Finance. 23(2), 389-416.
Konkurrensverket. (2005, December). Konkurrens i Sverige 2005. Retrieved November 21,
2006, from http://www.kkv.se/upload/Filer/Trycksaker/Rapporter/rap_2005-1.pdf
Korkeamaki, T.P. & Smythe, T.I. (2004). Effects of Market Segmentation and Bank Concentration on Mutual Fund Expenses and Returns: Evidence from Finland. European Financial Management. 10(3), 413-438.
Latzko, D.A. (1998). Economies of Scale of mutual fund administration. Journal of Financial Research. 22(3), 331
Länsförsäkringar. (2006, November 13). Kunders rädsla för krångel sätter stopp för
bank-byte. Newsdesk. Retrieved November 20, 2006, from
http://www.newsdesk.se/pressroom/lansforsakringar/pressrelease/view/114 525
Macéus, P.K. (2006, November 11). Fondkunder flyr storbankerna. Dagens Industri.
Retrie-ved November 11, 2006, from http://di.se/Nyheter/?page=%2fAvdelningar%2fArtikel.aspx%3fO%3dIndex
%26ArticleId%3d2006%5c11%5c15%5c210301
Markowitz, H. (1952). Portfolio Secelction. The Journal of Finance, 7(1), pp 77-91.
Markowitz, H. (1991). Foundations of Portfolio Theory, The Journal of Finance, 46(2), pp 469-477.
Morningstar. (2006). Ordlista. Retrieved December 9, 2006, from http://www.morningstar.se/definitions/index.asp?lang=sv&helptype=S&key word=mscatgry
Morningstar. (2006). Category Definitions. Retrieved November 2, 2006, from http://www.morningstareurope.com/download/morningstarcategories2005.p df
PPM. (2006, June 05). Avgifter. Retrieved November 16, 2006 from http://www.ppm.nu/tpp/infodocument/1:1;201352,201351
Sharpe, W.F. (1966). Mutual fund performance. The Journal of Business. 39(1), 119-138.
Simons, K. (1998). Risk-Adjusted Performance of Mutual Funds. New England Economic Review, 33-48.
Svenska Bankföreningen. (2005). Bank- och finansstatistik. Retrieved December 21, 2006, from http://www.bankforeningen.se/Statistik/Bank-%20och%20finansstatistik.aspx
Svenskt kvalitetsindex. (2005, October 4). Bankerna 2005 enligt Svenskt kvalitetsindex.
Retrieved November 20, 2006, from http://www.kvalitetsindex.se/index.php?option=com_content&task=view&id
=63
Svensson, K. (2006, September 23). Storbanker ligger kvar i fondbotten. Retrieved December
17, 2006, from http://di.se/Nyheter/?page=%2fAvdelningar%2fArtikel.aspx%3fO%3dIndex