http://www.diva-portal.org
Postprint
This is the accepted version of a paper published in Applied Energy. This paper has been peer-reviewed but does not include the final publisher proof-corrections or journal pagination.
Citation for the original published paper (version of record): Azimoh, C., Klintenberg, P., Wallin, F., Karlsson, B. (2015)
Illuminated but not electrified: An assessment of the impact of Solar Home System on rural households in South Africa.
Applied Energy, 155: 354-364
http://dx.doi.org/10.1016/j.apenergy.2015.05.120
Access to the published version may require subscription. N.B. When citing this work, cite the original published paper.
Permanent link to this version:
1 Illuminated but not electrified: An assessment of the impact of solar home system on rural households in 1
South Africa 2
Chukwuma Leonard Azimoh, Patrik Klintenberg, Fredrik Wallin, Björn Karlsson 3
4
Mälardalen University, School of Business, Society and Engineering, Box 883, SE-721 23 Västerås, 5 Sweden 6 leonard.azimoh@mdh.se 7 Abstract 8
The introduction of the off-grid electrification program in South Africa using the Solar Home System (SHS) 9
was a central component of the government policy aimed at bringing development to un-electrified 10
households. An assessment of the performance of SHS in many countries provided little evidence to support 11
the development impact of the system. The general perception is that the SHS program is wasting 12
government funds and has no hope of achieving the set objectives. Previous scientific reports have 13
concluded that SHS is the most viable technology for bringing about socio-economic development to rural 14
households. Most of these conclusions have been based on one sided arguments and largely on anecdotal 15
evidence. This study provides a pluralistic view of the subject from the perspective of the energy service 16
companies (ESCOs) and the households using the equipment. The development impact of SHS is subjected 17
to scientific analysis by investigating the economic and social dimensions of the program. Additionally, the 18
sustainability of the South African SHS program is assessed by investigating the challenges facing the 19
ESCOs and the households. The study reveals that illumination provided by SHS electricity has profound 20
impact on the livelihoods of rural households. Due to the limited capacity of SHS for productive and thermal 21
use, there are limited direct economic benefits to the households. The associated economic impact is 22
peripheral to the secondary usage of SHS electricity. SHS has improved the productivity of small scale 23
business owners who utilize the light from SHS to do business at night. Irregularities in payment of subsidy 24
funds and energy bills, high operation cost, non-optimal use of SHS, grid encroachment, and lack of 25
customer satisfaction contribute to make the business unsustainable for the ESCOs. 26
2 28
1. Introduction 29
The change in political governance in South Africa in 1994 also led to a major policy review of the energy 30
sector [1]. The government changed the focus of an energy policy based on separate development to an 31
inclusive policy that embraces the energy needs of disadvantaged households. This was evident with the 32
implementation of the National Electrification Program (NEP), a precursor to the Electricity-For-All 33
program of 1994 [2]. The objective in the revised policies is to extend development to the large segments 34
of the population that were deprived during the apartheid regime. One of the basic elements of NEP is the 35
Free Basic Electrification (FBE) policy, which is aimed at providing access to electricity to all South 36
Africans [3]. This policy seeks to provide ways and means through which government interventions can 37
bring about relief to poor un-electrified households and ensure optimal socio-economic benefits from the 38
NEP [4]. 39
In order to achieve this objective the Department of Energy (DOE) awarded contracts to provide electricity 40
to un-electrified rural households to six consortia known as the concession companies or Energy Services 41
Companies (ESCOs) in 2002 [3, 5, 6]. The contract agreement mandates the companies to provide energy 42
services to the off-grid population using the Solar Home System (SHS) [7]. The SHS program has lasted 43
for more than a decade, and on that basis it can be regarded as a success. SHS has been used to facilitate 44
large scale electrification programs in rural South Africa. However, recent reports indicate that the SHS 45
program is fraught with challenges such as inconsistent government policies, theft and vandalization of 46
equipment, limited power capacity and high cost of equipment [5, 8-11]. By 2013 only three of the six 47
concession companies remained in the business, with another on the verge of opting out [10]. 48
Several scientific publications have shown that the use of decentralized renewable energy systems like SHS 49
for rural electrification has become a controversial issue. Many contributions to this topic argue in support 50
of SHS, while numerous submissions question the efficacy of SHS in bringing about development to rural 51
3 communities in developing countries. For instance, one report argued that access to electricity can have a 52
significant effect on the livelihoods of households which were previously not electrified [12]. SHS has 53
brought about improved performance for children at schools along with other social benefits like 54
entertainment and cell phone charging [8, 13]. A study conducted in Bangladesh concluded that if SHS is 55
used according to the designed and installed specification, it can improve the quality of life of rural people 56
and provide income-generating opportunities [14]. Results of a survey conducted in Fiji indicate that SHS 57
has improved quality of lives, provided entertainment, enabled increased working and study hours and 58
created jobs, contributing directly and indirectly to increased income generation for the households using it 59
[15]. 60
Meanwhile, several studies have concluded that SHS is not a viable solution for bringing development to 61
the rural population. In another study in Bangladesh analysis of the development impact of SHS shows little 62
evidence that energy from SHS supports development [16]. A review of the effectiveness of SHS in Africa 63
in 2007 questioned the wisdom of using public funds to support SHS at the expense of more appropriate 64
technologies, since the costs associated with SHS remain high for very low service levels compared with 65
conventional technologies [17]. Another challenge is that SHS is limited in scope as basic energy needs like 66
cooking cannot be met [18]. Besides the low power capacity of SHS, the energy conversion efficiency is 67
low and can easily be affected by deposition of dust and other elements on the panels [19]. A review of 232 68
scholarly articles [20] concluded that despite the social and environmental benefits of SHS the economic 69
case remains uncertain. SHS has been found to be an expensive tool that produces low power at high cost 70
[21]. An analysis of SHS in the Amazonian regions also revealed that the low capacity of the system and 71
low performance during the rainy season is a major drawback [22]. 72
A study in Zambia showed that SHS programs using the concession model forces people into a “solar trap” 73
which often results in protests [8]. Thus, many households do not want to be included in SHS programs for 74
fear of being classified as electrified, thereby risking exclusion from future introductions of more efficient 75
technologies or expansion of the grid. Another study in Zambia indicates that there is growing resentment 76
4 towards SHS among households using the system [23]. In addition, the decreasing number of ESCOs in 77
South Africa is an indication that the SHS program is facing challenges [10]. An evaluation of previous 78
reports shows that most conclusions on the subject were based on a one-sided perspective from either users 79
or the energy providers. Furthermore, most arguments lack sufficient evidence to support their case. For 80
instance, the proponents of SHS as a tool for rural development have not explained unambiguously how this 81
might be achieved. On the other hand, those with dissenting argument often ignore the fact that SHS may 82
be useful in some applications. This paper assesses the development impact of the SHS program in specific 83
off-grid locations in South Africa. The socio-economic dimensions of the SHS program and its sustainability 84
are investigated from both the energy providers’ and users’ perspectives. The intention is to determine the 85
contribution of the SHS program to the development of rural households in South Africa, and whether the 86
adopted method of implementation is sustainable. 87
Previous studies have shown that there is no agreed definition on rural development. Most definitions 88
responded to regional and local solutions to modernization paradigms [24]. In the past rural development 89
has been associated with growth in the agricultural sector, improvement in social services and reduction of 90
poverty [24]. Rural development was seen as a sustained improvement in the standard of living and/or 91
welfare of the rural population [25]. Rural development has also been defined as an improvement in overall 92
rural community conditions, including economic, social, environmental, health, infrastructure, and housing 93
conditions [26]. This study investigates the ability of the SHS program in South Africa to reduce poverty 94
and induce development of the economic and social lives of rural off-grid households. 95
96
97
98
5 2. Fee-For-Service model used for South African SHS program
100
The contractual agreement between private investors and the South African government led to the formation 101
of local energy providing companies known as ESCOs or concessionaires (because they were given 102
concession to electrify specific geographical locations). The concessionaires are the vehicle used to facilitate 103
the diffusion of SHS electricity in rural South Africa. The government supports SHS and other rural 104
electrification programs with the Free Basic Electricity (FBE) policy and Electricity Basic Support Services 105
Tariff (EBSST), also known as the “poverty tariff”. This policy provides 50 kWh/month of grid electricity 106
for free to all households classified as poor [27]. Households that consume more than 50 kWh/month would 107
pay for their electricity according to blocked or stepped tariffs [27]. SHS users and all non-grid electrified 108
households in South Africa receive a subsidy of 48 ZAR per month for payment of electricity service charges 109
[6]. The ESCOs are made up of both local and international entrepreneurs who invested private funds with 110
the intention of recovering their investment through service charges from customers. A government 111
subsidized Fee-For-Service finance mechanism is currently being used to run the program. Under this 112
financing structure, the households pay for services only, but allow to keep and use the systems without 113
owning it. 114
The organizational structure of the fee-for-service business model is shown in Fig. 1. The Department of 115
Energy (DOE) and the National Electricity Regulator of South Africa (NERSA) bankroll and regulate the 116
program respectively. Under the contract agreement, the government is responsible for 80% of the 117
program’s funding, while the remaining 20% comes from private investors. The ESCOs are solely owned 118
by private investors [3]. The households pay the maintenance and service charges by purchasing tokens 119
from energy stores [5]. The ESCOs administer the provision of SHS and auxiliary energy services like LPG, 120
paraffin, and stoves to the households in their concession areas [5, 7]. The energy providers run their 121
operations from branch offices and energy stores located close to their customers, including services such 122
as logistics for installation and maintenance, and stocking and refilling of LPG and paraffin. 123
6 124
Fig. 1. Organizational structure and Fee-For-Service model of the SHS program in South Africa. 125
3. Study areas and methodology 126
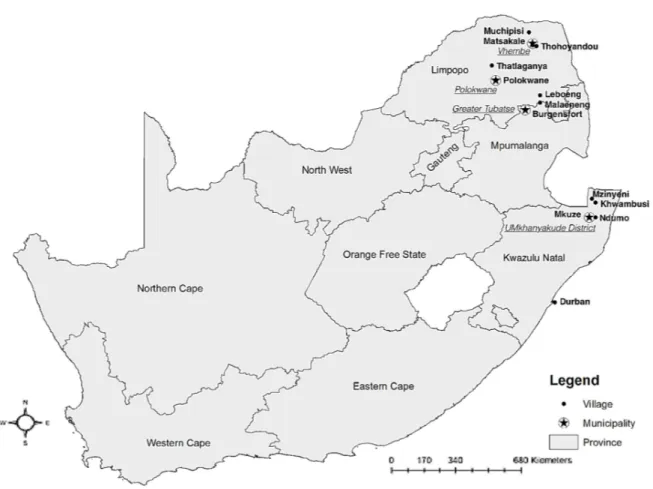
The study was conducted between the 16th of April and 1st of May 2013 in seven villages in four 127
municipalities located in three provinces of rural South Africa (see Figs. 2 and 3). Technical and 128
management staff of the ESCOs, namely Solar Vision, NuRa Energy and Kwazulu Energy Services (KES)1
129
were interviewed along with a number of households. 130
131
1 The management and technical staff of Kwazulu Energy Services’ concession areas in southern Kwazulu-Natal and
7 132
Fig. 2. Surveyed areas and the stakeholders interviewed. 133
8 134
Fig. 3. Map of South Africa showing the location of the surveyed villages. 135
9 136
3.1 Assumptions made in the study 137
The assumptions made in the study were: cost of energy is directly proportional to size of household; the 138
pattern of energy usage is uniform in all the households; cost of fuel excludes transportation; service charge 139
is considered as the total burden of SHS (because purchasing and installation cost is covered by subsidies, 140
hence no additional burden on the household); a five person household is used as the base case; candles 141
and paraffin are not used to provide lighting when there is a power outage from the SHS. The foreign 142
exchange (FOREX) at the time of the investigation is $1 USD to ZAR 9. 143
144
145
3.2 Data gathering through semi-structured interviews 146
10 Data was collected through semi-structured interviews supervised by a team of researchers from Mälardalen 147
University, Sweden, assisted by trained interviewers who speak the local languages. The translators were 148
considered necessary to gain the confidence of the interviewees and to allow for more flexibility in the 149
discourse. For the analysis, the survey was categorized into households in the Solar Vision and NuRa Energy 150
concession areas. The Solar Vision concession area includes households in Polokwane municipal area 151
comprising Thlatlaganya village with 23 surveyed households, Vhembe municipality (Muchipisi and 152
Masakele villages) comprising 24 households, and Greater Tubatse municipality (Malaeneng village) with 153
23 households. The NuRa Energy concession area includes households in Umkhanyakude district 154
municipality, comprising (Mzinyeni, Khwambusi and Ndumo villages) with 18 surveyed households. A 155
total of 88 households were interviewed in the seven villages. The dispersed nature of homesteads in the 156
NuRa concession area explains the shortfall in the number of households surveyed in Umkhanyakude 157
municipality. 158
3.3 Social impact of the SHS program 159
The assessment of the social impacts of SHS on the households was analyzed using parameters such as 160
satisfaction with SHS electricity, its ability to meet energy needs, theft of solar panels, influence on skills 161
acquisition, and impact on children’s education. 162
3.4 Economic impact of SHS program 163
The economic impact of SHS was evaluated using household income, income distribution, cost advantage 164
of SHS over alternatives, improved economic activities as a result of SHS and energy burden of SHS and 165
alternatives. Energy burden is defined as the share of a household’s income that is devoted to energy 166
expenditure [16]. In this study energy burden represents the percentage of the household total income that 167
is paid for energy services. 168
11 In the analysis of the energy burden 10% of the household total income was used as the threshold for 169
determining the energy poverty line. 10% of income has been used as the threshold for energy in many 170
studies [28-31]. 171
The economics of SHS energy in comparison to alternative energy sources was determined by comparing 172
the energy burden of SHS on the household with those of LPG, paraffin and candle. Two scenarios were 173
investigated for the energy burden. The first was the energy burden of households with access to SHS 174
electricity. In this case, SHS was considered as the only energy source for lighting, alternative energy 175
sources like paraffin, firewood and LPG were used for cooking. In the second scenario, households without 176
access to SHS electricity were investigated. Alternative energy sources such as candle and paraffin (lantern) 177
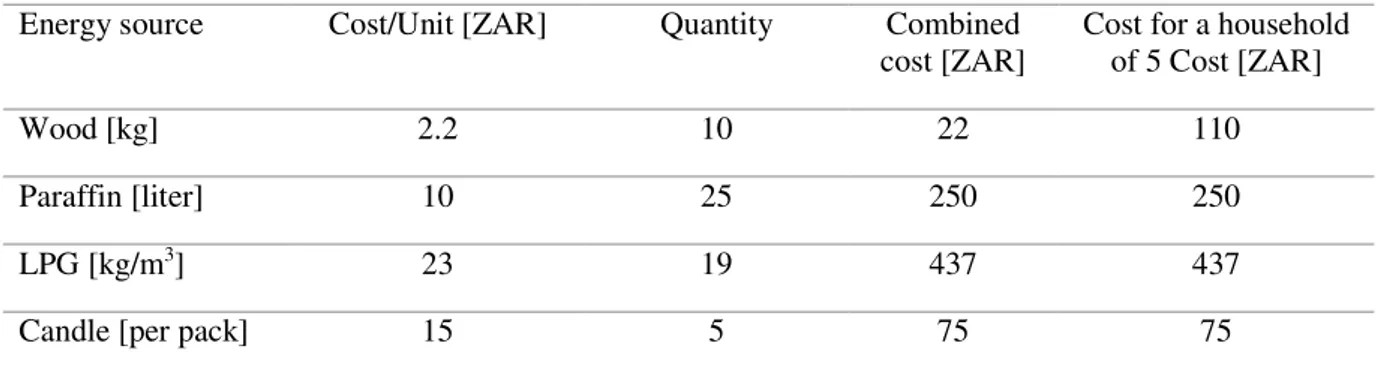
were used for lighting, while paraffin (stove), firewood and LPG were used for cooking. The cost analysis 178
for various energy sources was based on the data from Table 1. 179
Table 1. Cost analysis for alternative energy sources 180
Energy source Cost/Unit [ZAR] Quantity Combined cost [ZAR]
Cost for a household of 5 Cost [ZAR]
Wood [kg] 2.2 10 22 110
Paraffin [liter] 10 25 250 250
LPG [kg/m3] 23 19 437 437
Candle [per pack] 15 5 75 75
Source: Author’s compilation base on personal communication and [32, 33]. 181 182 183 184 4. Results 185
12 4.1 ESCOs’ Perspective
186
The interviews with the ESCOs revealed some of the benefits and challenges facing the South African SHS 187
program. According to Solar Vision, increased illumination at night provides protection against reptiles and 188
reduces the rate of theft in the villages. It has also reduced the use of candles thereby decreasing the risk of 189
fire accidents. In addition, improvement in children’s education by extending possible study hours have also 190
been observed. The responses from the ESCOs show that access to information and entertainment is the 191
most noticeable social impact of SHS electricity. 192
Due to a number of challenges, sustainability of SHS has been difficult to achieve for the ESCOs despite 193
government support through subsidies. The ESCOs are currently grappling with the issue of delayed 194
payments of subsidies from some municipalities. The tariff for the SHS service ranges from 60 to 70 195
ZAR/month, and the EBSST supports poor households with up to 48 ZAR/month, depending on the 196
municipality. A household can pay up to 30 ZAR/month, however, over the years some municipalities have 197
stopped paying the EBSST subsidy. For instance, out of the five municipalities within the NuRa Energy 198
concession area only one is still paying the subsidy. This has compelled NuRa Energy to increase the energy 199
tariff, which is currently causing disaffection with SHS in some households for whom the increased price is 200
not reflected in the service provided. According to our analysis, the average energy bill is 110 ZAR/month 201
in the NuRa Energy concession area and 27 ZAR/month in the Solar Vision concession area. 202
Non-payment of service charges by some households is another issue that increases the financial burden on 203
the ESCOs. Other challenges that the energy providers face are frequent theft of solar panels, user ignorance 204
and lack of responsibility and abuse of SHS, e.g. bypassing of charge controllers to gain direct access to 205
electricity from the battery. In addition, the ESCOs have to contend with vandalization of equipment, illegal 206
use of cheap inverters that draw disproportionate amounts of current from the system, preference of grid 207
electricity to SHS, and unplanned encroachment of the Eskom grid. Incorrect usage of the systems mostly 208
affects the battery, resulting in more frequent battery replacements, adding to the operation and maintenance 209
costs. 210
13 4.2 Households perspective
211
The results from the household survey are divided into two segments. The first segment represents the 212
responses regarding the social impact of the SHS program on the households, while the second segment 213
deals with the economic impact. The analysis also compares the impact of SHS electricity on households in 214
the Solar Vision concession area which are supported by the EBSST subsidy and the households in the 215
NuRa Energy concession areas whose municipalities have ceased payment of the poverty tariff. 216
4.2.1 Assessment of social dimensions of SHS on the households 217
The results presented here represent the social impact of the SHS program as perceived by the respondents. 218
4.2.2 Satisfaction with SHS 219
The survey indicates that the level of satisfaction with SHS services is lower than the level of dissatisfaction. 220
56% of the households interviewed are not satisfied with SHS services, while 44% rated them as 221
satisfactory, with ratings of excellent, very good or good. However, the level of satisfaction varies between 222
villages depending on their specific circumstances. Masakele village (Vhembe municipality) for instance 223
reported 90% satisfaction, while Malaeneng village (Greater Tubatse municipality) reported only 13% 224
satisfaction. Villages like Thlatlaganya (Polokwane municipality), Malaeneng (Greater Tubatse 225
Municipality) and Ndumo (Umkhanyakude municipality) reported levels of dissatisfaction above 50%, with 226
Malaeneng having the highest with 87% (Table 2). There is no noticeable distinction in the attitudes of the 227
households in the two concession areas (NuRa Energy and Solar Vision), with as many as 56% of all 228
respondents in Solar Vision and NuRa Energy concession areas reportedly dissatisfied with their SHS. The 229
average results by municipality are shown in Table 2. 230
231
Table 2. Households’ satisfaction ratings regarding SHS electricity in the four municipalities 232
14
Satisfaction with SHS Polokwane
n=23 Vhembe n=24 Greater Tubatse n=23 Umkhanyakude n=18 Excellent (%) 0 12 4 5 Very good (%) 4 13 0 11 Good (%) 39 50 9 28 Not satisfied (%) 57 25 87 56 233 234
4.2.3 Influence of SHS on skills acquisition 235
Interviewees were asked to describe how SHS had influenced their ability to develop skills, with the aim of 236
identifying the impact of SHS on human capital capacity building. 41% of all the households interviewed 237
stated that SHS has had positive impacts, while 59% were uncertain. The responses vary between villages, 238
but households in the Solar Vision concession area reported more positive impacts on their skills 239
development than those in NuRa Energy areas, with values of 47% and 22% respectively. While there is a 240
high level of ambivalence in all households none indicated that SHS has had a negative influence on skills 241
acquisition (Table 3). 242
Table 3. Reported effects of SHS program on skills acquisition. 243
Skills acquisition Polokwane
n=23 Vhembe n=24 Greater Tubatse n=23 Umkhanyakude n=18 Positive (%) 48 46 48 22 Negative (%) 0 0 0 0 Uncertain (%) 52 54 52 78 244
4.2.4 Meeting of energy needs with SHS electricity 245
Many factors influences the energy needs of a household, including income, job type and routine, age, 246
household size, and social status of the inhabitants. The assessment of the ability of SHS electricity to meet 247
these diverse energy needs indicates that it seldom does. For instance, in the NuRa concession area 89% of 248
the respondents reported that their energy needs are not being met, while as many as 67% reported alike in 249
the Solar Vision area (Fig. 4). A majority of respondents said that they only use their SHS for lighting for a 250
15 limited period during the day. Heating and cooking are done mainly with paraffin and firewood, and a few 251
households use LPG to meet their thermal energy needs. 252
253
Fig. 4. Reported ability of SHS electricity to meet the energy needs of households. 254
255
Responses from households regarding the ability of SHS to meet energy needs show that 11% of households 256
in Kwazulu-Natal is meeting their energy needs with SHS, since they do not have much demand other than 257
lighting and charging of phones, while 89% have had issues with the system such as insufficient power, 258
decline in performance 3-4 months after installation, weak batteries that can't even sustain the lights, 259
insufficient power to support appliances like cooking stoves, pressing iron, color TV, refrigerator, and the 260
system breaking down with the slightest use. All the respondents in Greater Tubatse have had issues with 261
the power from the system, they complained that their usage of the system is limited due to its low power. 262
In Vhembe municipality 42% responded that their energy needs are limited, and therefore the electricity 263
from SHS is meeting their needs, while 58% complained that the power from the system does not enable 264
them to use their appliances, which stand idle most of the time. 13% of households in Polokwane indicated 265
that their power needs are being met, while 87% responded negatively. Many complained that they are 266
unable to store perishable foodstuff, the electricity cuts off when all appliances are switched on at the same 267
time, and that SHS cannot support appliances other than lighting, charging of phones, radio and DC-TV. 268
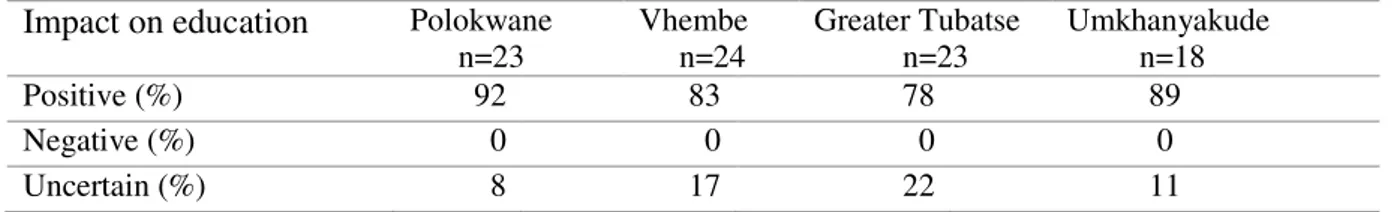
16 4.2.5 The effect of SHS on children’s education
269
Responses indicate that before the introduction of SHS most children preferred to do their homework during 270
the day, and few were able to study at night using candle and paraffin lighting for limited hours. SHS 271
therefore offers an alternative source of lighting to meet this demand. The result shows that in both 272
concession areas, SHS has affected children’s education positively. In NuRa Energy concession areas 89% 273
of households said that SHS has positive effects on their children’s education, and 84% indicated likewise 274
in the Solar Vision area. The rest of the respondents in the two areas were uncertain on the impact of SHS 275
on children’s education. A majority of those that were uncertain on the impact of SHS includes those with 276
adult children and infants who are either out of school or not yet in school. None of the households stated 277
that SHS has a negative influence on their children’s education (Table 4). Discussions with some of the 278
respondents revealed that the positive effect is a consequence of the extended hours available for learning 279
due to the greater availability of illumination at night. A majority of the respondents indicated that lighting 280
is the most important contribution of SHS due to its positive effect on their children’s education. 281
282
Table 4. Reported impact of SHS on children’s education. 283
Impact on education Polokwane
n=23 Vhembe n=24 Greater Tubatse n=23 Umkhanyakude n=18 Positive (%) 92 83 78 89 Negative (%) 0 0 0 0 Uncertain (%) 8 17 22 11 284
4.2.6 Theft of solar panels 285
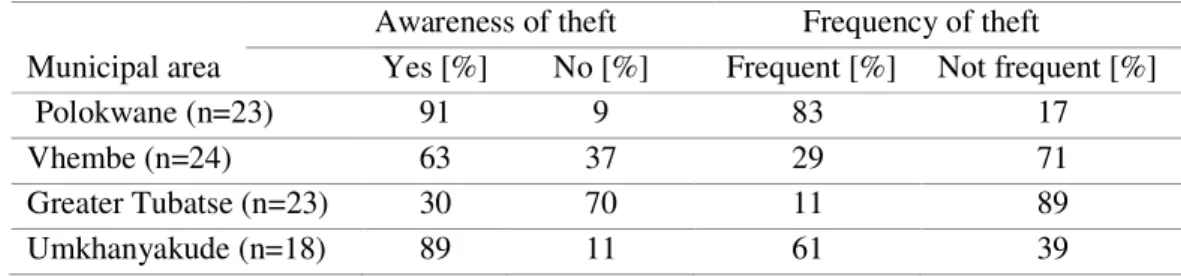
One of the social ills facing the SHS program in South Africa is the theft of solar panels. A majority of the 286
respondents have experienced theft of solar panels at one time or the other. Awareness of solar panel theft 287
is high in both concession areas. 89% of the respondents in the NuRa Energy concession area indicated that 288
they are aware of solar panel theft, while 61% agreed that the frequency of occurrence is high. 61% indicated 289
awareness of solar panel theft in the Solar Vision area and 41% stated that it is frequent. The awareness and 290
frequency of theft indicates that solar panel theft may be more prevalent in the NuRa concession area (see 291
17 Table 5). Even so, Thlatlaganya village in Polokwane municipality has the highest awareness and 292
occurrence of equipment theft. 293
Table 5. Reported awareness and frequency of occurrence of solar panel theft. 294
Awareness of theft Frequency of theft
Municipal area Yes [%] No [%] Frequent [%] Not frequent [%]
Polokwane (n=23) 91 9 83 17
Vhembe (n=24) 63 37 29 71
Greater Tubatse (n=23) 30 70 11 89
Umkhanyakude (n=18) 89 11 61 39
295
4.3 Assessment of economic dimensions of SHS on the households in rural South Africa 296
Explicit questions were asked on the level of economic activities and the influence on development to 297
ascertain the impact of SHS since the start of the program. 298
4.3.1 Income and payment capability of the households 299
Most households in the surveyed areas depend on grants, pensions, remittances and incomes as labourers 300
from neighbouring farms for subsistence. Therefore, the average household income in the surveyed areas is 301
low when compared to municipal and provincial household incomes. According to the survey, the average 302
income per household in the NuRa Energy concession was 1941 ZAR/month and that in the Solar Vision 303
was 1428 ZAR/month as shown in Table 6. 304
Table 6. Household income and SHS charges. 305
Municipalities Average income [ZAR] Average size of household Average service charge [ZAR]
Polokwane (n=23) 1605 5 29
Vhembe (n=24) 1275 4 29
Greater Tubatse (n=23) 1405 6 23
Umkhanyakude (n=18) 1941 7 110
306
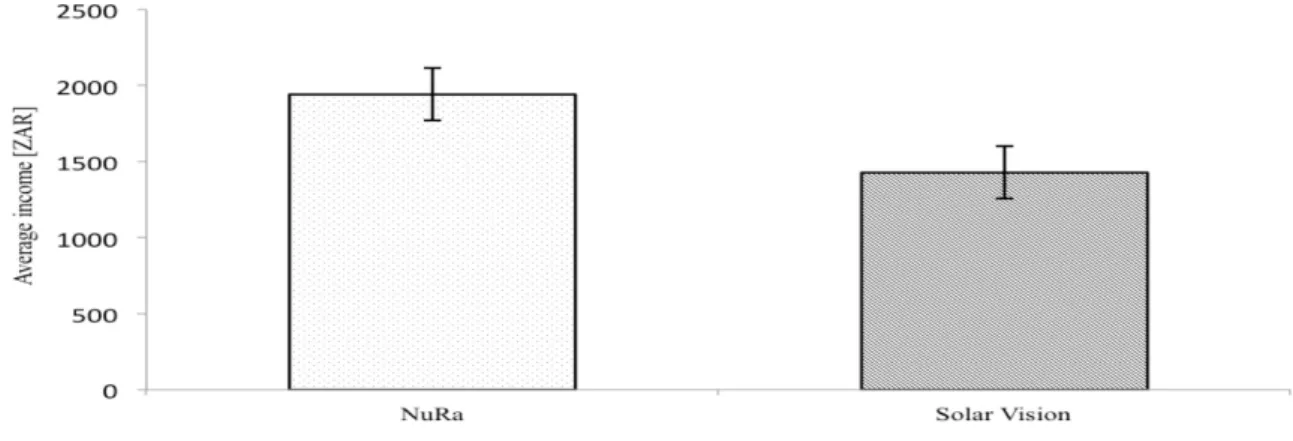
4.3.2 Analysis of income distribution and payment of service charges 307
18 With a mean income distribution of 1941 ZAR and 1428 ZAR for NuRa and Solar vision concession areas 308
respectively, the statistical analysis shows that the non-overlapping confidence intervals (Fig. 5) indicate a 309
significant difference in income between the two concession areas. The study also shows a mean of 110 310
ZAR and 27 ZAR in the ability to pay service charges in the NuRa and Solar Vision areas respectively. The 311
non-overlapping confidence intervals also demonstrate that there is a large difference in the service charges 312
between the concession areas (Fig. 6). The disparity is due to the lack of an EBSST subsidy in the NuRa 313
Energy concession area. 314
315
Fig. 5. Average income and confidence interval for NuRa and Solar Vision concession areas. 316
317
Fig. 6. Average SHS service charge and confidence interval for NuRa and Solar Vision concession areas. 318
4.3.3 Cost advantage of SHS over alternative energy sources 319
19 The energy sources commonly used for cooking in the surveyed villages are firewood, paraffin and most 320
recently LPG. Table 1 was used to analyze the cost benefit of SHS over the alternative energy sources. The 321
burden of an energy system on a household is evident when the energy expenditure is expressed as a 322
percentage of the household income (Fig. 7-9). 323
324
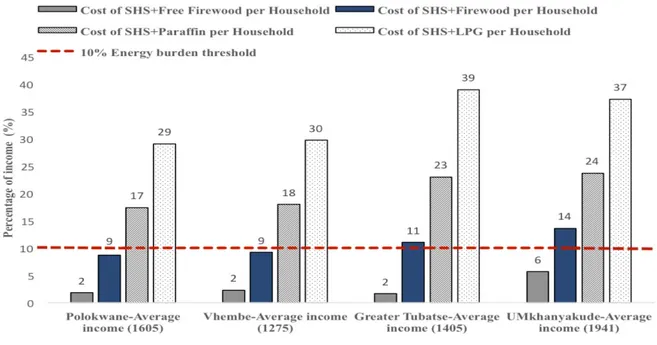
4.3.4 Analysis of energy burden for households with access to SHS electricity 325
The analysis of the energy burden of SHS on the households showed that households within the Solar Vision 326
concession area, which receive the EBSST subsidy have lower energy burden, and spend an average of 327
around 2% of their monthly income on the SHS energy bill. Whereas households in the NuRa concession 328
area spend up to 6% of their monthly income on the SHS energy bill. When the cost of firewood is taken 329
into account, most households in Greater Tubatse (Solar Vision area) spend around 10% of their income on 330
energy (Fig. 7). In the NuRa concession area, in the absence of the poverty tariff, the energy burden rises to 331
14% of the average income. The combination of SHS and paraffin to meet energy needs increases the energy 332
burden to around 21% of their income. The few households that use LPG for cooking and SHS for lighting, 333
had an average energy burden of around 34%. It is therefore safe to conclude that the households are energy 334
poor when the total energy needs are taken into account. However, the household SHS energy expenditure 335
alone is less than 10% of their income with or without the EBSST subsidy. 336
20 337
Fig. 7. The energy burden on the average income2 of households with access to SHS.
338
4.3.5 The cost analysis for households without access to SHS electricity 339
Households that use candles for lighting and free firewood for heating spend an average of 5% of their 340
income on energy (Fig. 8). However, those that pay for firewood, and to greater extent those that use paraffin 341
and LPG for cooking, exceed the 10% energy burden threshold and therefore could be considered as energy 342
poor (Fig. 9). 343
344
2 Note the average income indicated at the foot of the bars under each municipality represents the mean income of
the households interviewed during the survey. The values on the y-axis represents the share of the household income spent on a particular energy source.
21 345
Fig. 8. Energy burden on the average income of households using candle for lighting. 346
347
Fig. 9. Energy burden on the average income of households using paraffin for lighting. 348
349
22 4.3.6 Economic development impact of SHS on the households
351
Responses from the survey indicate that the influence of SHS on household economic development is 352
minimal, as shown in Table 7. Its ability to jumpstart small scale businesses is generally low in the surveyed 353
regions. 23% of all the households believed that SHS has a positive economic impact on their livelihood, 354
47% did not believe so and 30% were uncertain. Respondents in the Solar Vision concession area were more 355
positive (25%) than those in the NuRa Energy area (17%), Khwambusi village (Umkhanyakude 356
municipality) was the only village in the survey where more than 50% of responses were positive regarding 357
the ability of SHS to stimulate small scale businesses. Three quarters of all the households reported that 358
SHS has not led to any job creation or increased chances of employment. 83% of households in the NuRa 359
Energy concession area and 75% of households in the Solar Vision area either did not agree or were unaware 360
of any business started as a result of the SHS program. 361
Table 7.Reported economic activities resulting from the SHS program. 362
Impact on economic activities Polokwane
n=23 Vhembe n=24 Greater Tubatse n=23 Umkhanyakude n=18 Yes (%) 35 17 22 17 No (%) 61 33 65 27 Uncertain (%) 4 50 13 56 363 5. Discussion 364
5.1 Development impact of the SHS program. 365
According to the UN standard that places the poverty line at purchasing power parity (PPP) of $1.25 per 366
day [34], the surveyed households lie below the poverty line. The analysis shows that the average monthly 367
income per head per day is $1.03 in the NuRa area and $1.06 in the Solar Vision area. According to a 368
statistical report, the average income for Polokwane, Vhembe and Greater Tubatse municipalities are 5768 369
ZAR, 4120 ZAR and 3831 ZAR/month respectively, the province average (Limpopo) is 4737 ZAR/month, 370
the average income for Umkhanyakude municipality is 3933 ZAR/month and the province average is 8600 371
ZAR/month [35, 36]. The income of the households in the surveyed concession areas are far below the 372
23 provincial and municipal averages. Therefore, they can be classified as poor in both world and South African 373
standard. The SHS program and the Fee-For-Service model took the low income of the households into 374
consideration in the implementation of the program through the EBSST subsidy. The high variability in the 375
SHS service charges between households in the NuRa Energy and Solar Vision concession areas is 376
indicative of the fact that most municipalities in the NuRa Energy territory are no longer paying the EBSST 377
subsidy. This has increased the energy expenditure of households within the concession areas three fold. 378
Government support through subsidy is also reflected in the comparative cost advantage of SHS over the 379
alternative energy sources. The energy burden on households with access to SHS is lower than households 380
without access to SHS that use candle and paraffin for lighting. Including the cost of thermal energy sources 381
results in most households (with or without the EBSST subsidy) exceeding the 10% energy burden 382
benchmark. They can therefore be regarded as energy poor [30]. Although the study shows an average 383
expenditure on SHS electricity below the 10% threshold, the 80% funding from the government was 384
excluded from the analysis. If this is included, households without EBSST support would spend about 30% 385
of their income on SHS electricity. However, free gathering of firewood is the prevalent practice in most of 386
the villages during the survey. 387
The responses show that illumination provided by SHS has a positive effect on children. Extended reading 388
hours are accompanied by flexibility in reading routines, improving educational outcomes. This result is 389
consistent with a similar study which showed that the introduction of SHS in rural households in Zambia 390
improved children’s performance at school [23]. 391
Analysis of the data from this study shows that the SHS program has limited direct economic impact on the 392
households. This is mainly due to the limited capacity of the system. Responses show that there is a high 393
level of uncertainty regarding the economic impact of the SHS program on the households. Even those that 394
agreed that it has positive impacts, could not explain unambiguously in economic terms the specific 395
development impacts of SHS. The situation is exemplified by one respondent saying that the only job SHS 396
24 has created in the village is that of the technician who makes a brisk business illegally bypassing the control 397
units. 398
The only perceptible economic impact of SHS revealed by this study is related to illumination provided by 399
SHS electricity. Those who have benefitted economically from SHS are those who use illumination from it 400
to extend business hours into the night. For instance, somerespondents in Khwambusi village indicated that 401
SHS has helped their grass mat making business, since working late at night has greatly improved production 402
and significantly reduced expenditure on candles. Discussions with some households revealed that SHS has 403
an economic impact on small scale businesses like retail tuck shops, hairdressers, barbers and provision 404
stores that utilize the light provided by SHS to work late at night. A tuck shop owner from Malaeneng 405
village admitted that his business hours have been extended from his normal closing time of 20:00 to 23:00, 406
and he no longer has the problem of issuing the wrong change to customers, which was not the case when 407
paraffin lanterns and candles were used. 408
However, the assertion that extended business hours and reading periods could lead to an improvement in 409
businesses and performance at school should be taken with caution, because although activities are able 410
continue into the night, it is difficult to conclude that there is an improvement in outcomes without further 411
research. This situation reiterates the argument of [16] that extending business hours does not necessarily 412
translate to an increase in sales and that changing of children’s reading routines does not necessarily lead to 413
improved performance at school, since spending more time with a customer who decides to shop at night 414
instead of during the day does not necessarily lead to increased sales, and children who spend day watching 415
TV and read at night may not do better at school. Even if the illumination from SHS electricity does improve 416
the economies of a few isolated households engaged in business activities at night, this does not necessarily 417
translate to a sustained socio-economic development in the local communities. In addition, watching TV, 418
listening to the radio, charging phones and doing business at night are neither parameters nor indices for 419
measuring development as stipulated by [26]. 420
25 5.2 Sustainability of SHS program
422
Information from the ESCOs shows that the sustainability of the SHS business under the present condition 423
is low. The ESCOs are currently grappling with issues of delayed payments of the EBSST subsidy from 424
some municipalities, and contending with poor payment capability of some households due to low income. 425
Grid encroachment and the setting of unrealistic targets by the department of energy also weigh down on 426
their activities. The most worrying challenges currently facing the SHS program are the issues of equipment 427
theft and non-optimal use of the system due to lack of user education. Abuse of the system through 428
tampering, vandalism and bypassing of control units are added challenges that adds to the overhead 429
maintenance and operation costs. These challenges negatively affect the sustainability of the SHS program 430
in South Africa and may be the reason why three of the six ESCOs who were originally awarded the SHS 431
contract have withdrawn from the program. 432
The assessment of social impacts of the SHS program on the households reveal that a high percentage of 433
respondents are not satisfied with their SHS, and that those that showed high levels of satisfaction, like in 434
the case of Masakele and Muchipisi in Vhembe municipality acquired their systems in February 2013, just 435
prior to the survey and are located far from the grid. Experience has shown that with increasing load and 436
non-optimal use of the systems, the battery systems soon succumb to abuses and overloads which lead to 437
power outages and then disaffection with the system. This is consistent with the position of [37] who 438
advised that electricity demand soon doubled after installations due to increasing load. On the other hand, 439
villages that indicated high levels of dissatisfaction with SHS like Malaeneng (Greater Tubatse), 440
Thlatlaganya (Polokwane) and Ndumo (Umkhanyakude) have peculiar circumstances. For instance, in 441
Malaeneng the Eskom (the major power utility company in South Africa) grid passes through the village to 442
the neighbouring farms. In Thlatlaganya the grid exists side by side with SHS and in Ndumo village the 443
Eskom power grid is only a few kilometers away. Proximity to the grid creates awareness and makes the 444
limitations of SHS more apparent to the users, which contributes to hostility towards SHS over time. This 445
also affects the sustainability of the program. 446
26 The results from the survey show that SHS is not meeting the energy needs of the households interviewed. 447
A majority of the respondents admitted that they could only use their SHS for limited hours. Those who 448
indicated that SHS is meeting their energy needs nevertheless request that government should improve the 449
power quality so that they can use some of their idle appliances. SHS electricity is currently used for lighting, 450
entertainment using radios with a low power rating or a black and white DC-TV, and phone charging. 451
Therefore, it has little or no effect on skills acquisition since it cannot be used for any productive purposes 452
due to the limited power capacity. These findings agrees with studies like [18, 21, 22] which report on the 453
challenges of the low power limitations of SHS. Sustainability of the South African SHS program under 454
these conditions is therefore unlikely. 455 456 457 458 6. Conclusion 459
Analysis of the impact of the solar home system program in South Africa revealed the following salient 460
points. 461
• Illumination provided by SHS electricity has a positive impact on the households, it has enabled 462
increased access to information and entertainment, and could affect children’s education positively. 463
• The direct economic impacts of SHS are uncertain and difficult to evaluate due to the absence of 464
verifiable supporting evidence. Peripheral economic, and social impacts of SHS are associated with 465
the secondary usage of SHS electricity. It has provided useful illumination which supports business 466
activities at night. 467
• The energy needs of households are largely unmet by SHS due to the limited power of the system. 468
This has a negative effect on the households’ satisfaction with the system. 469
27 • Proximity to the grid creates awareness of the thermal and productive capacity of the national grid 470
resulting in resentment of SHS. 471
• Grid encroachment, irregular payment and non-payment of energy bills by some municipalities and 472
customers are making the SHS program unsustainable for the ESCOs. 473
• In addition, equipment theft, non-optimal use and abuse of SHS are increasing the cost of doing 474
business for the ESCOs. 475
There is no evidence for specific development impact resulting from the implementation of the South 476
African SHS program. Most of the measurable socio-economic impacts are hampered by the limited power 477
from the system. However, further research is needed to compare the pre and post SHS periods of South 478
Africa with regard to socio-economic conditions before a rigorous conclusion can be drawn. However, the 479
current situation on the ground shows that SHS households are poor in both economic and energy terms. 480
481 482
6.1 Recommendation 483
Based on the information from the study there is an urgent need for education of households on the designed 484
and operational guidelines of SHS, since abuses and non-optimal usage of the systems are increasing costs 485
for the energy providers and by extension threatening the sustainability of the program. 486
Strict FBE policy implementation by the government, transparency and adherence to the approved grid 487
extension plan by Eskom could forestall the issues of grid encroachment, institutional delays and payment 488
avoidance by some municipalities. Also empowering the poor households through supports for upstarts of 489
small-scale businesses could contribute to increase in payment capability and improved livelihood. In 490
addition the power supply from SHS needs to be improved to drive productive activities which are necessary 491
for sustaining businesses, without which the socio-economic development objective of the government is 492
likely to remain unattainable. 493
Despite the shortcomings of SHS, it may still be useful for providing supplementary electricity for lighting 494
during power outages in locations that are already connected to the grid. Moreover, locations that are not 495
28 going to be connected to the grid in the foreseeable future could utilize SHS electricity for lighting. 496
However, the inhabitants of such locations should not be expected to depend on SHS electricity for income 497
generation because of the low power output from the current systems being provided by the government 498
through the ESCOs. 499
500
Acknowledgements 501
502
We thank the locals of Thlatlaganya, Masakele, Malaeneng, Muchipisi, Dumela, and Ndumo communities 503
for their hospitality and valued information given to us during the survey. Our profound appreciation goes 504
to Jake Jacobs, the MD of Solar Vision whose support made the survey a success. We also thank Sifiso 505
Dlamini, the general manager of NuRa Energy, for coordinating our survey in Kwazulu Natal province, and 506
we must not fail to mention the positive contribution provided by Vicky Basson, the MD of Kwazulu Energy 507
during her interview. Special thanks to the Department of Energy of South Africa for the valid information 508
and support given to us during the study. We would like to acknowledge the Swedish International 509
Development Cooperation Agency (SIDA) for their financial support under the contract AKT-2010-031. 510
511
References 512
513
[1] Davison O, Winkler H, Kenny A, Prasad G, Nkomo J, Sparks D, Alfstad T, Howells M. Energy 514
policies for sustainable development in South Africa. Energy research center, University of Cape 515
Town, 2006. https://www.iaea.org/OurWork/ST/NE/Pess/assets/South_Africa_Report_May06.pdf. 516
[2] Gaunt CT. Meeting electrification’s social objectives in South Africa, and implication for 517
developing countries. Energy Policy, 2005; 33: 1309-17. 518
[3] Banks D, Clark A, Steel K, Purcell C, Bates J. Integrated rural energy utilities: a review of literature 519
and opportunities for the establisment of an IREU, REEP, 2008. 520
29 http://www.reeep.org/sites/default/files/Integrated%20Rural%20Energy%20Utilities.pdf.
521
[4] DOE. Electricity Basic Services Support Tariff (Free Basic Electricity) Policy for the Republic of 522
South Africa South African, Endorsed by Phumzile Mlambo Ngcuka Minister of Minerals and 523
Energy. Gazette No. 25088, 30 June, Department of Energy 2003: 3-25 524
http://www.energy.gov.za/files/policies/Free%20Basic%20Electricity%20Policy%202003.pdf. 525
[5] Lemaire X. Off-grid electrification with Solar Home Systems: The experience of a fee-for-service 526
concession in South Africa. Energy for Sustainable Development, 2011; 15: 277-283 527
[6] Niemand FR and Banks DI. NuRa - a success story for rural energy service delivery. RAPS 528
Technologies, Energize, 2006; 12-16. http://www.ee.co.za/wp-content/uploads/legacy/NuRa.pdf. 529
[7] Banks D. Rural energy service delivery a public private partnership approach. Domestic Use of 530
Energy Conference 2003; 45-50. 531
[8] Ellegård A, Arvidson A, Nordström M, Kalumiana O, and Mwanza C. Rural people pay for solar; 532
experiences from the Zambia PV-ESCO project. Renewable Energy, 2004; 29: 1251-1263. 533
[9] Sovacool BK, D'Agostino AL, and Bambawale MJ. The socio-technical barriers to Solar Home 534
Systems (SHS) in Papua New Guinea: Choosing pigs, prostitutes, and poker chips over panels. 535
Energy Policy, 2011; 39 :1532-1542. 536
[10] Azimoh CL, Wallin F, Klintenberg P, and Karlsson B. An assessment of unforeseen losses resulting 537
from inappropriate use of solar home systems in South Africa. Applied Energy, 2014; 136 :336-538
346. 539
[11] Bhandari R and Stadler I. Electrification using solar photovoltaic systems in Nepal. Applied Energy, 540
2011; 88: 458-465. 541
[12] Friebea C, Paschen von Flotowb, and Täubea F. Exploring the link between products and services 542
in low-income markets—Evidence from solar home systems. Energy Policy, 2013;52 760-769. 543
[13] Lemaire X. Fee-for-service companies for rural electricfication with Photovoltaic Systems: The 544
case of Zambia. Energy for Sustainable Development, 2009 ;13 :18-23. 545
30 [14] Biswas WK, Diesendorf M, and Bryce P. Can photovoltaic technologies help attain sustainable rural 546
development in Bangladesh? Energy Policy, 2004; 32: 1199–1207. 547
[15] Urmee T, Harries D, and Schlapfer A. Issues related to rural electrification using renewable energy 548
in developing countries of Asia and Pacific. Renewable Energy, 2009; 34:354–357. 549
[16] Rahman S and Ahmad M. Solar Home System (SHS) in rural Bangladesh: Ornamentation or fact 550
of development? Energy Policy, 2013; 63: 348–354. 551
[17] Wamukonya N. Solar home system electrification as a viable technology option for Africa's 552
development. Energy Policy, 2007; 35: 6-14. 553
[18] Bhattacharyya SC. Renewable energies and the poor: niche or nexus? Energy Policy, 2006; 34: 554
659–663. 555
[19] Al-Ismaily HA and Probert D. Photovoltaic electricity prospects in Oman. Applied Energy, 556
1998;59: 97-124. 557
[20] Schillebeeckx SJD, Parikh P, Bansal R, and George G. An integrated framework for rural 558
electrification: Adopting a user-centric approach to business model development. Energy Policy, 559
2012; 48: 687-697. 560
[21] Drennen T, Erickson J, and Chapman D. Solar power and climate change policy in developing 561
countries. Energy Policy, 1996; 24: 9-16. 562
[22] Linguet L and Hidair I. A detailed analysis of the productivity of solar home system in an 563
Amazonian environment. Renewable and Sustainable Energy Reviews, 2010;14: 745–753. 564
[23] Ellegård A, Arvidson A, Nordström M, Kalumiana OS, and Mwanza C. Rural people pay for solar; 565
experiences from the Zambia PV-ESCO project. Renewable Energy, 2004; 29: 1251-1263. 566
[24] Van der Ploeg JD, Renting H, Brunori G, Knickel K, Mannion J, Marsden T, De Roest K, Sevilla-567
Guzmán E, and Ventura F. Rural development: From practices and policies towards theory. 568
Sociologia Ruralis, 2000; 40:392-408. 569
31 [25] Anriquez G and Stamoulis K. Rural Development and Poverty Reduction: Is Agriculture Still The 570
Key? Electronic Journal of Agricultural and Development Economics. vol. 4, 2007. 571
http://www.fao.org/3/a-ah885e.pdf. 572
[26] USDA. United States Department of Agriculture-2007, Farm Bill Theme Paper. United States 573
Department of Agriculture, 2006;4:1-31. http://www.usda.gov/documents/Farmbill07energy.pdf. 574
[27] Bekker B, Eberhand A, Gaunt T and Marquard A. South Africa’s rapid electrification progromme: 575
Policy, institutional, planning, finnancing and technical innovations. Energy Policy, 2008; 36 :25-576
37. 577
[28] Buzar S. Estimating the extent of domestic energy deprivation through household expenditure 578
surveys. CEA Journal of Economics, 2006;1: 5-14. 579
[29] Allen AM. Addressing affordability of utility services in urban housing: Energy efficiency 580
solutions. USAID: Alliance to save energy: Municipal network for energy efficiency, 2007. 581
https://www.ase.org/sites/ase.org/files/residential_ee_study_final.pdf. 582
[30] DOE. A survey of energy-related behaviour and perceptions in South Africa (The residential sector). 583
Department of Energy Republic of South Africa, 2013. 584
http://www.energy.gov.za/files/media/Pub/DoE-2013-Survey-of-EnergyRelated-Behaviour-and-585
Perception-in-SA.pdf. 586
[31] Pachauri S, Mueller A, Kemmler A and Spreng D. On measuring energy poverty in Indian 587
hoseholds. World Development, 2004;32: 2083-2104. 588
[32] Green JM. and Erskine SH. Solar (photovoltaic) systems, energy use and business activities, in 589
Maphephethe, KwaZulu-Natal. Development Southern Africa, 1999 ; 16: 221-237. 590
[33] Matseba L and Nembahe R. Energy Price Report. DOE: Directorate: Energy collection, 591
management and analysis, South Africa, 2012. 592
http://www.energy.gov.za/files/media/explained/Energy-Price-Report-2012.pdf. 593
[34] Dollar D, Kleineberg T and Kraay A. Growth still is good for the poor.World Bank policy reseach 594
working paper 6568, August 2013. http://papers.ssrn.com/sol3/papers.cfm?abstract_id=2309849. 595
32 [35] Lehohla P. Census 2011 municipal report Kwazulu-Natal, statistics, South Africa. Statistics of 596
South Africa, 2011. 597
http://www.statssa.gov.za/census/census_2011/census_products/KZN_Municipal_Report.pdf. 598
[36] Lehohla P. Census 2011 municipal report Limpopo, Statistic of South Africa. Statistics South 599
Africa, 2011. 600
http://www.statssa.gov.za/census/census_2011/census_products/LP_Municipal_Report.pdf. 601
[37] Rogers DEC and Brent AC. Renewable rural electrification: Prediction of sustainability in South 602
Africa. Case study: Wind and solar photo-voltaic with lead acid battery sotorage. CSIR outcomes 603
conferences, Pretoria, 2009; pp 1-13. http://www.hdl.handle.net/10204/4156. 604
605 606