http://www.diva-portal.org
This is the published version of a paper published in Metals.
Citation for the original published paper (version of record):
Bjurenstedt, A., Seifeddine, S., Jarfors, A. (2016)
The effects of Fe-particles on the tensile properties of Al-Si-Cu alloys.
Metals, 6(12): 314
Access to the published version may require subscription.
N.B. When citing this work, cite the original published paper.
Open Access journal: http://www.mdpi.com/journal/metals
Permanent link to this version:
metals
Article
The Effects of Fe-Particles on the Tensile Properties of
Al-Si-Cu Alloys
Anton Bjurenstedt *, Salem Seifeddine and Anders E. W. Jarfors
Department of Materials and Manufacturing, Jönköping University, P.O. Box 1026, 551 10 Jönköping, Sweden; salem.seifeddine@ju.se (S.S.); anders.jarfors@ju.se (A.E.W.J.)
* Correspondence: anton.bjurenstedt@ju.se; Tel.: +46-36-101535
Academic Editor: Nong Gao
Received: 16 September 2016; Accepted: 5 December 2016; Published: 10 December 2016
Abstract: The effect of Fe-rich particles has been a topic for discussion in the aluminum casting industry because of the negative impact they exert on the mechanical properties. However, there are still contradictions on the effects of various morphologies of Fe-particles. In this study, microstructural characterization of tensile tested samples has been performed to reveal how unmodified and modified Fe-rich particles impact on the tensile behavior. Analysis of additions of Fe modifiers such as Mn and Cr, showed higher amounts of primary Fe-rich particles (sludge) with increased porosity and, as result, degraded tensile properties. From the fracture analysis of tensile tested hot isostatic pressed (HIPed) samples it could be concluded that the mechanical properties were mainly governed by the Fe-rich particles, which were fracturing through cleavage, not by the porosity.
Keywords: Fe-rich particles; sludge; tensile properties; fracture; casting; solidification; aluminum; silicon; recycling
1. Introduction
In cast aluminum components, Fe-rich particles are common constituents that normally degrade the mechanical properties. Fe may originate from tools and scrap and tend to settle towards furnace floors where it can accumulate into high levels. There is currently no economical way of removing Fe and it is, therefore, important to gain knowledge on the effect of Fe-rich particles on mechanical properties in order to expand the use of more environmental friendly secondary alloys.
Fe-rich particles are in general accused for having detrimental effects on mechanical properties [1]. However, Fe-rich particles have different morphologies and sizes depending upon chemical composition and thermal history [2] and different morphologies will affect properties in different ways. The plate-like β-particles in complex 3D structures [3] (Al5FeSi) are the most studied and their morphology has been shown to degrade mechanical properties [4,5]. Wang et al. [6] states that the β-particles are the most detrimental Fe-rich particles because they act as stress concentrations due to their sharp edges. Other morphologies have been given less attention, but are considered to be less harmful [7]. A reason for other morphologies to be considered as less harmful may lie in the term neutralization which is used when talking about promotion of other morphologies and inhibiting β-particles with the goal of improving properties; hence, a better term is modification. A common way to modify the morphology of β-particles is by addition of Mn, and an accepted rule of thumb is to have a Fe:Mn ratio of a maximum 2:1 in order to convert β-particles into α-particles (Al15(FeMnCr)3Si2). In castings with high cooling rates α-particles may form Chinese scripts, with a slower cooling rate, polyhedral shaped α-particles named sludge, may nucleate as primary particles [8,9]. The propensity of the nucleation of primary Fe-rich particles in an Al-Si alloy can be estimated by the sludge factor
Metals 2016, 6, 314 2 of 15
(SF) combining the effect of Fe, Mn, and Cr. The commonly accepted empirical equation of the SF presented by Dunn [10] is expressed as:
SF = wt. % Fe + 2×wt. % Mn + 3×wt. % Cr (1)
Modification of β-particles is a commonly accepted way to improve the mechanical properties, however, no literature is found that can prove that sludge is beneficial to mechanical properties. Hence, there could be misconceptions about the effects of sludge on mechanical properties.
Ji et al. [11] varied the Fe content between 0.09 wt. % and 2.5 wt. % in high pressure die-cast tensile test specimens. The most significant effect was on the elongation to fracture (ef) which was decreasing with increasing Fe content. The yield strength (YS) showed a slight increase and ultimate tensile strength (UTS) was constant at Fe levels below 0.6 wt. % and decreased at Fe levels above 0.6 wt. %. At each Fe-level two different Mn additions were used, 0.02 wt. % and 0.54 wt. %. This promoted cubic α-phase particles and suppressed the formation of β-particles. However, the ef did not show any improvement and YS and UTS were only slightly enhanced by the modification of the Fe-rich particles.
It is also possible to alter β-particles by increasing the cooling rate; it has been shown, that in terms of secondary dendrite arm spacing (SDAS), smaller SDAS will generate smaller β-particles [4,12,13].
The mode in which Fe-rich particles fracture has been discussed, e.g., both the matrix-particle interface and the inner surfaces of β-particles have been proposed as weak. Vorren et al. [12] suggested that the bonding between β-particles and the matrix is weak and that decohesion will lead to a reduction in mechanical properties. On the contrary, Cao and Campbell [14–16] have observed Fe-rich particles nucleating on the wetted outer surface of bifilms, and that the inner dry surface of the bifilm acts as a crack, and this is why β-particles are detrimental to mechanical properties. Later studies by Terzi et al. [17] demonstrate through in situ observations that β-particles nucleate both at an angle at the outer surface of a sample as well as along the outer surface where oxides are present. This is indicating nucleation on oxides and growth along the oxide and at an angle to the oxide skin. Their experiment also showed β-particles growing into complex 3D structures due to branching when in physical contact with dendrites. An analogous finding of nucleation on oxides was made earlier by Narayanan et al. [18] who proposed β-particle nucleation on a spherical Al2O3particle, at an angle of approximately 70◦to its surface.
The influence of Fe-rich particles on porosity is another issue to consider; there seems to be a common agreement about β-particles blocking feeding, hence increasing porosity, this have been reported in review papers by Crepeau [8] and Mbuya et al. [19]. However, Dinnis et al. [20] have shown that the relationship between Fe content and porosity is not straight forward, and state that the effect of Fe changes with Cu and Si content. Furthermore, Roy et al. [21] concluded that β-particles are active nucleation sites for porosity, and they found that β-particles and α-particles limit the growth of pores. In addition have Cao and Campbell [16] observed that primary α-particle rich metal is often associated with porosity. In a study by Ferraro and Timelli [22] no relation between the concentrations of Fe, Mn and Cr on the level of porosity was observed in high-pressure die-cast material.
The aim of this work was to assess the ambiguous effect of modification of Fe-rich particles on tensile properties. Additionally, the unclear mode of fracture of the Fe-rich particles will be studied together with their effect on porosity in Al-Si alloys.
2. Materials and Methods
The chemical compositions of the alloys were analyzed by optical emission spectroscopy (OES) (Spectro, Kleve, Germany) and are shown in Table1. The EN 46000 alloy, equivalent to alloy A380, was used as the base alloy. Si, Cu, Fe, Mn, and Cr were added as master alloys in order to produce three more alloys with variations in SFs and keeping the other elements constant. Sr was added to modify the Si morphology from flake-like to fibrous morphology. Alloys A and B were expected to
Metals 2016, 6, 314 3 of 15
have Fe-rich particles in the form of β-particles, whereas alloys C and D were expected to have sludge particles due to the chemical composition and the cooling rates.
Melts of about 4.5 kg were prepared in an electrical resistance furnace, master alloys and base metal material were heated to 1073 K (800 ◦C) to ensure homogeneity. For modification with Sr, the furnace was set to 1048 K (775◦C); 10 min after the addition of Sr, the furnace was set to 993 K (720◦C) which was the casting temperature. Holding time and temperature for the Sr modification was according to Gruzleski and Closset [23]. Cylindrical rods with a length of 18 cm and a diameter of 1 cm were cast in a copper mold, preheated to 523 K (250◦C). In order to produce samples with a consistent matrix and with less defects, the samples were then remelted in directional solidification equipment [24]. See Figure1a for a schematic image of the equipment. In the directional solidification equipment, the samples were remelted under an Ar gas atmosphere, the melting temperature was 993 K (720 ◦C). The samples were held for 30 min before directional solidification. As the molten samples were kept in a stationary position in the equipment, the furnace was raised at two different speeds in order to achieve samples with different levels of SDAS, 10 µm and 25 µm.
Table 1.Chemical composition of the alloys used in this study in wt. %, analyzed by OES.
Alloy Si Fe Cu Mn Mg Cr Ni Zn Pb Sn Sr Al SF Fe/Mn
A 9.30 0.74 2.79 0.25 0.05 0.03 0.04 0.96 0.06 0.03 0.022 Bal. 1.3 3.0
B 9.40 1.17 2.77 0.25 0.05 0.03 0.04 0.91 0.05 0.03 0.027 Bal. 1.8 4.7
C 9.23 1.29 2.65 0.53 0.04 0.15 0.04 0.86 0.05 0.03 0.025 Bal. 2.8 2.4
D 9.30 1.59 2.64 0.80 0.04 0.18 0.04 0.80 0.05 0.03 0.029 Bal. 3.7 2.0
Tensile test bars were prepared from directional solidified samples in a CNC lathe (HAAS, Oxnard, CA, USA). The tensile test bars had a diameter of 6 mm and the length of the reduced section was 36 mm, the test bars fulfil the requirements in ISO 6892-1 and ASTM B557M (see Figure1b).
Metals 2016, 6, 314 3 of 15
Melts of about 4.5 kg were prepared in an electrical resistance furnace, master alloys and base metal material were heated to 1073 K (800 °C) to ensure homogeneity. For modification with Sr, the furnace was set to 1048 K (775 °C); 10 min after the addition of Sr, the furnace was set to 993 K (720 °C) which was the casting temperature. Holding time and temperature for the Sr modification was according to Gruzleski and Closset [23]. Cylindrical rods with a length of 18 cm and a diameter of 1 cm were cast in a copper mold, preheated to 523 K (250 °C). In order to produce samples with a consistent matrix and with less defects, the samples were then remelted in directional solidification equipment [24]. See Figure 1a for a schematic image of the equipment. In the directional solidification equipment, the samples were remelted under an Ar gas atmosphere, the melting temperature was 993 K (720 °C). The samples were held for 30 min before directional solidification. As the molten samples were kept in a stationary position in the equipment, the furnace was raised at two different speeds in order to achieve samples with different levels of SDAS, 10 μm and 25 μm.
Table 1. Chemical composition of the alloys used in this study in wt. %, analyzed by OES.
Alloy Si Fe Cu Mn Mg Cr Ni Zn Pb Sn Sr Al SF Fe/Mn
A 9.30 0.74 2.79 0.25 0.05 0.03 0.04 0.96 0.06 0.03 0.022 Bal. 1.3 3.0 B 9.40 1.17 2.77 0.25 0.05 0.03 0.04 0.91 0.05 0.03 0.027 Bal. 1.8 4.7 C 9.23 1.29 2.65 0.53 0.04 0.15 0.04 0.86 0.05 0.03 0.025 Bal. 2.8 2.4 D 9.30 1.59 2.64 0.80 0.04 0.18 0.04 0.80 0.05 0.03 0.029 Bal. 3.7 2.0 Tensile test bars were prepared from directional solidified samples in a CNC lathe (HAAS, Oxnard, CA, USA). The tensile test bars had a diameter of 6 mm and the length of the reduced section was 36 mm, the test bars fulfil the requirements in ISO 6892‐1 and ASTM B557M (see Figure 1b). (a) (b) Figure 1. Schematic images of (a) the directional solidification equipment and (b) a tensile test sample. A T6 heat treatment cycle consisting of, 768 K (495 °C) for 3 h, quenching in 323 K (50 °C) water and 483 K (210 °C) for 2 h, was performed to gain a dissolution and homogenous microstructure in order to study the sole effect of Fe‐rich particles without the influence of Cu− and Mg− rich particles.
The heat treatment cycle was chosen after studying the work by Sjölander and Seifeddine [25]. These alloys are normally not heat‐treated because EN 46000 is commonly high pressure die cast. Tensile testing was performed at room temperature on 5–6 as‐cast samples per alloy and SDAS, (four alloys and two SDASs). A clip‐on extensometer (Zwick, Ulm, Germany) with a gauge length of 20 mm was used. The speed throughout the test was 0.54 mm/min, corresponding to a strain rate of 2.5 × 10⁻⁴ s−1, the test speed was according ISO 6892‐1 and ASTM B557M.
Since Fe‐rich particles are assumed to influence porosity, hot isostatic pressing (HIPing) was performed on 4–5 samples per alloy to minimize porosity and to be compared with as‐cast samples.
Figure 1.Schematic images of (a) the directional solidification equipment and (b) a tensile test sample.
A T6 heat treatment cycle consisting of, 768 K (495◦C) for 3 h, quenching in 323 K (50◦C) water and 483 K (210◦C) for 2 h, was performed to gain a dissolution and homogenous microstructure in order to study the sole effect of Fe-rich particles without the influence of Cu− and Mg− rich particles. The heat treatment cycle was chosen after studying the work by Sjölander and Seifeddine [25]. These alloys are normally not heat-treated because EN 46000 is commonly high pressure die cast.
Metals 2016, 6, 314 4 of 15
Tensile testing was performed at room temperature on 5–6 as-cast samples per alloy and SDAS, (four alloys and two SDASs). A clip-on extensometer (Zwick, Ulm, Germany) with a gauge length of 20 mm was used. The speed throughout the test was 0.54 mm/min, corresponding to a strain rate of 2.5×10⁻⁴s−1, the test speed was according ISO 6892-1 and ASTM B557M.
Since Fe-rich particles are assumed to influence porosity, hot isostatic pressing (HIPing) was performed on 4–5 samples per alloy to minimize porosity and to be compared with as-cast samples. HIPing was performed by Bodycoat (Densal®process, Haag-Winden, Germany) before heat treatment, machining and tensile testing.
Measurements of β-particle size by optical examination were performed on 20–30 areas distributed over the whole reduced section of the as-cast tensile test bars from alloys A and B. In each area was the largest β-particle measured. The measurements were conducted from top to bottom in order to detect variation in β-particle size along the sample. Measurements of the area fraction β-particles in alloys A and B were measured with assistance of an image analysis software (Stream Motion Desktop 1.9.1 Olympus, Shinjuku, Tokyo, Japan) on samples etched with H2SO4. Sixteen areas along the whole reduced section were measured.
3. Results
3.1. Tensile Properties of As-Cast Samples
The results from tensile testing of as-cast samples are shown in Figure2. The two alloys with the lowest sludge factor and the highest Fe:Mn ratio, alloys A and B, exhibit the highest UTS and the highest ef. These two alloys also have a clear trend of difference between the two SDAS levels. Increasing the SDAS reduces the UTS of alloys A and B by 13% (average) and efis reduced by 61% (average).
The two alloys with highest sludge factor and lowest Fe:Mn ratio, alloys C and D, have lower UTS and efthan alloys A and B. The properties of alloys C and D are similar, and they do not show significant variations between SDAS 10 and SDAS 25.
Typical tensile test curves for samples with SDAS 10 are shown in Figure3. On average the YS, with a 0.2% offset, was the highest for alloy B, both for SDAS 10 and SDAS 25, as it was 169±5 MPa, being between 11–20 MPa higher than alloy A, C, and D.
Metals 2016, 6, 314 4 of 15
HIPing was performed by Bodycoat (Densal® process, Haag‐Winden, Germany) before heat
treatment, machining and tensile testing.
Measurements of β‐particle size by optical examination were performed on 20–30 areas distributed over the whole reduced section of the as‐cast tensile test bars from alloys A and B. In each area was the largest β‐particle measured. The measurements were conducted from top to bottom in order to detect variation in β‐particle size along the sample. Measurements of the area fraction β‐ particles in alloys A and B were measured with assistance of an image analysis software (Stream Motion Desktop 1.9.1 Olympus, Shinjuku, Tokyo, Japan) on samples etched with H2SO4. Sixteen areas along the whole reduced section were measured. 3. Results 3.1. Tensile Properties of As‐Cast Samples The results from tensile testing of as‐cast samples are shown in Figure 2. The two alloys with the lowest sludge factor and the highest Fe:Mn ratio, alloys A and B, exhibit the highest UTS and the highest ef. These two alloys also have a clear trend of difference between the two SDAS levels.
Increasing the SDAS reduces the UTS of alloys A and B by 13% (average) and ef is reduced by 61% (average). The two alloys with highest sludge factor and lowest Fe:Mn ratio, alloys C and D, have lower UTS and ef than alloys A and B. The properties of alloys C and D are similar, and they do not show significant variations between SDAS 10 and SDAS 25. Typical tensile test curves for samples with SDAS 10 are shown in Figure 3. On average the YS, with a 0.2% offset, was the highest for alloy B, both for SDAS 10 and SDAS 25, as it was 169 ± 5 MPa, being between 11–20 MPa higher than alloy A, C, and D. (a) (b)
Figure 2. Tensile test results of as‐cast samples showing (a) UTS and (b) ef Error bars show one
standard deviation.
Figure 2. Tensile test results of as-cast samples showing (a) UTS and (b) ef Error bars show one standard deviation.
Metals 2016, 6, 314 5 of 15
Metals 2016, 6, 314 4 of 15
HIPing was performed by Bodycoat (Densal® process, Haag‐Winden, Germany) before heat
treatment, machining and tensile testing.
Measurements of β‐particle size by optical examination were performed on 20–30 areas distributed over the whole reduced section of the as‐cast tensile test bars from alloys A and B. In each area was the largest β‐particle measured. The measurements were conducted from top to bottom in order to detect variation in β‐particle size along the sample. Measurements of the area fraction β‐ particles in alloys A and B were measured with assistance of an image analysis software (Stream Motion Desktop 1.9.1 Olympus, Shinjuku, Tokyo, Japan) on samples etched with H2SO4. Sixteen areas along the whole reduced section were measured. 3. Results 3.1. Tensile Properties of As‐Cast Samples The results from tensile testing of as‐cast samples are shown in Figure 2. The two alloys with the lowest sludge factor and the highest Fe:Mn ratio, alloys A and B, exhibit the highest UTS and the highest ef. These two alloys also have a clear trend of difference between the two SDAS levels.
Increasing the SDAS reduces the UTS of alloys A and B by 13% (average) and ef is reduced by 61% (average). The two alloys with highest sludge factor and lowest Fe:Mn ratio, alloys C and D, have lower UTS and ef than alloys A and B. The properties of alloys C and D are similar, and they do not show significant variations between SDAS 10 and SDAS 25. Typical tensile test curves for samples with SDAS 10 are shown in Figure 3. On average the YS, with a 0.2% offset, was the highest for alloy B, both for SDAS 10 and SDAS 25, as it was 169 ± 5 MPa, being between 11–20 MPa higher than alloy A, C, and D. (a) (b)
Figure 2. Tensile test results of as‐cast samples showing (a) UTS and (b) ef Error bars show one
standard deviation.
Figure 3. Typical tensile test curves for the four alloys with SDAS 10. The alloys are having the following sludge factors; A = 1.3, B = 1.8, C = 2.8, and D = 3.7. The samples are in as-cast conditions.
3.2. Macroscopic Fracture Surface Investigation, As-Cast Samples
Examination of fracture surfaces in the stereo microscope revealed some distinct differences amongst the as-cast samples. The most apparent feature was the greater amount of porosity in alloys C and D compared to alloys A and B; SEM images of two fracture surfaces are seen in Figure4, illustrating the difference. The area of porosity and oxides visible at the fracture surfaces in the stereo microscope was measured. Identification of oxides was made from the black appearance and lack of fracture features, the visual oxide identification was subsequently confirmed by energy dispersive spectroscopy (EDS) (EDAX, Mahwah, NJ, USA) analysis in which oxygen (O) was detected, see Figure5. The clear oxide peak together with the appearance of an opaque surface was a confirmation of thick oxides [26]. The average percentage of area covered by porosity and oxides, with one standard deviation, of the fracture surface of as-cast samples was for alloys A and B 2.8%±7.2% compared to 12.3%±14.0% for alloys C and D. Large standard deviations indicate a large variation of area porosity and oxides at the fracture surfaces.
Metals 2016, 6, 314 5 of 15
Figure 3. Typical tensile test curves for the four alloys with SDAS 10. The alloys are having the following sludge factors; A = 1.3, B = 1.8, C = 2.8, and D = 3.7. The samples are in as‐cast conditions. 3.2. Macroscopic Fracture Surface Investigation, As‐Cast Samples
Examination of fracture surfaces in the stereo microscope revealed some distinct differences amongst the as‐cast samples. The most apparent feature was the greater amount of porosity in alloys C and D compared to alloys A and B; SEM images of two fracture surfaces are seen in Figure 4, illustrating the difference. The area of porosity and oxides visible at the fracture surfaces in the stereo microscope was measured. Identification of oxides was made from the black appearance and lack of fracture features, the visual oxide identification was subsequently confirmed by energy dispersive spectroscopy (EDS) (EDAX, Mahwah, NJ, USA) analysis in which oxygen (O) was detected, see Figure 5. The clear oxide peak together with the appearance of an opaque surface was a confirmation of thick oxides [26]. The average percentage of area covered by porosity and oxides, with one standard deviation, of the fracture surface of as‐cast samples was for alloys A and B 2.8% ± 7.2% compared to 12.3% ± 14.0% for alloys C and D. Large standard deviations indicate a large variation of area porosity and oxides at the fracture surfaces. Figure 4. The fracture surfaces of a tensile test sample from (a) alloy B SDAS 10 having an oxide defect indicated by the arrow and (b) alloy D SDAS 25 having visible round pores with a total area fraction of 2.5%.
Figure 5. Close‐up and analysis of the fracture surface seen in Figure 4 where (a) is showing a SEM image of oxide to the left and dimples to the right and (b) is showing an EDS analysis of the marked area which is indicating an oxygen peak. (a) (b)
Figure 4.The fracture surfaces of a tensile test sample from (a) alloy B SDAS 10 having an oxide defect indicated by the arrow and (b) alloy D SDAS 25 having visible round pores with a total area fraction of 2.5%.
Metals 2016, 6, 314 6 of 15
Metals 2016, 6, 314 5 of 15
Figure 3. Typical tensile test curves for the four alloys with SDAS 10. The alloys are having the following sludge factors; A = 1.3, B = 1.8, C = 2.8, and D = 3.7. The samples are in as‐cast conditions. 3.2. Macroscopic Fracture Surface Investigation, As‐Cast Samples
Examination of fracture surfaces in the stereo microscope revealed some distinct differences amongst the as‐cast samples. The most apparent feature was the greater amount of porosity in alloys C and D compared to alloys A and B; SEM images of two fracture surfaces are seen in Figure 4, illustrating the difference. The area of porosity and oxides visible at the fracture surfaces in the stereo microscope was measured. Identification of oxides was made from the black appearance and lack of fracture features, the visual oxide identification was subsequently confirmed by energy dispersive spectroscopy (EDS) (EDAX, Mahwah, NJ, USA) analysis in which oxygen (O) was detected, see Figure 5. The clear oxide peak together with the appearance of an opaque surface was a confirmation of thick oxides [26]. The average percentage of area covered by porosity and oxides, with one standard deviation, of the fracture surface of as‐cast samples was for alloys A and B 2.8% ± 7.2% compared to 12.3% ± 14.0% for alloys C and D. Large standard deviations indicate a large variation of area porosity and oxides at the fracture surfaces. Figure 4. The fracture surfaces of a tensile test sample from (a) alloy B SDAS 10 having an oxide defect indicated by the arrow and (b) alloy D SDAS 25 having visible round pores with a total area fraction of 2.5%.
Figure 5. Close‐up and analysis of the fracture surface seen in Figure 4 where (a) is showing a SEM image of oxide to the left and dimples to the right and (b) is showing an EDS analysis of the marked area which is indicating an oxygen peak. (a) (b)
Figure 5.Close-up and analysis of the fracture surface seen in Figure4where (a) is showing a SEM image of oxide to the left and dimples to the right and (b) is showing an EDS analysis of the marked area which is indicating an oxygen peak.
3.3. Fracture Surface Investigation by SEM-EDS, As-Cast Samples
Fracture surfaces of as-cast samples were examined in the SEM-EDS, and overview images of alloy A SDAS 25 and alloy D SDAS 25 are shown in Figure6. The fracture surfaces of alloys A and B showed a high degree of faceted features surrounded by dimpled structures. In alloys C and D similar patterns were observed in terms of faceted features in a matrix of dimpled fractures. The horizontally-projected Feret diameters of the faceted features were measured to be 50–100 µm in alloys A and B and 20–70 µm in alloys C and D.
Metals 2016, 6, 314 6 of 15 3.3. Fracture Surface Investigation by SEM‐EDS, As‐Cast Samples Fracture surfaces of as‐cast samples were examined in the SEM‐EDS, and overview images of alloy A SDAS 25 and alloy D SDAS 25 are shown in Figure 6. The fracture surfaces of alloys A and B showed a high degree of faceted features surrounded by dimpled structures. In alloys C and D similar patterns were observed in terms of faceted features in a matrix of dimpled fractures. The horizontally‐ projected Feret diameters of the faceted features were measured to be 50–100 μm in alloys A and B and 20–70 μm in alloys C and D. Figure 6. Overview images of fracture surfaces of (a) alloy A SDAS 25 and (b) alloy D SDAS 25.
EDS analysis with an acceleration voltage of 20 keV, was performed in order to identify the faceted features. Figure 7 presents a fracture surface from alloy B SDAS 25 at high magnification with two marked areas and two spectrums. The marked regions were analyzed with EDS and they exemplify a faceted feature and a ductile region. The spectrums are showing the elements that were detected in each area and their intensities. In the analysis of faceted surfaces Fe was detected, and in the ductile area were Al and Cu detected. Together with visual observations, also of polished cross‐ sections, it was concluded that the faceted features were cleaved β‐particles in alloys A and B and sludge in alloys C and D. In Figure 7 is the circular ductile area of a dendrite arm failing due to microvoid coalescence. Analyses were performed on opposite sides of the fracture surfaces, with similar results.
Figure 7. EDS analysis on the fracture surface of Alloy B SDAS 25 showing parts of a β‐particle in high magnification (a). Fe was detected in the (b) β‐particle which were identified together with visual (a) (b)
Figure 6.Overview images of fracture surfaces of (a) alloy A SDAS 25 and (b) alloy D SDAS 25.
EDS analysis with an acceleration voltage of 20 keV, was performed in order to identify the faceted features. Figure7presents a fracture surface from alloy B SDAS 25 at high magnification with two marked areas and two spectrums. The marked regions were analyzed with EDS and they exemplify a faceted feature and a ductile region. The spectrums are showing the elements that were detected in each area and their intensities. In the analysis of faceted surfaces Fe was detected, and in the ductile area were Al and Cu detected. Together with visual observations, also of polished cross-sections, it was concluded that the faceted features were cleaved β-particles in alloys A and B and sludge in alloys C and D. In Figure7is the circular ductile area of a dendrite arm failing due to microvoid coalescence. Analyses were performed on opposite sides of the fracture surfaces, with similar results.
Metals 2016, 6, 314 7 of 15 Metals 2016, 6, 314 6 of 15 3.3. Fracture Surface Investigation by SEM‐EDS, As‐Cast Samples Fracture surfaces of as‐cast samples were examined in the SEM‐EDS, and overview images of alloy A SDAS 25 and alloy D SDAS 25 are shown in Figure 6. The fracture surfaces of alloys A and B showed a high degree of faceted features surrounded by dimpled structures. In alloys C and D similar patterns were observed in terms of faceted features in a matrix of dimpled fractures. The horizontally‐ projected Feret diameters of the faceted features were measured to be 50–100 μm in alloys A and B and 20–70 μm in alloys C and D. Figure 6. Overview images of fracture surfaces of (a) alloy A SDAS 25 and (b) alloy D SDAS 25.
EDS analysis with an acceleration voltage of 20 keV, was performed in order to identify the faceted features. Figure 7 presents a fracture surface from alloy B SDAS 25 at high magnification with two marked areas and two spectrums. The marked regions were analyzed with EDS and they exemplify a faceted feature and a ductile region. The spectrums are showing the elements that were detected in each area and their intensities. In the analysis of faceted surfaces Fe was detected, and in the ductile area were Al and Cu detected. Together with visual observations, also of polished cross‐ sections, it was concluded that the faceted features were cleaved β‐particles in alloys A and B and sludge in alloys C and D. In Figure 7 is the circular ductile area of a dendrite arm failing due to microvoid coalescence. Analyses were performed on opposite sides of the fracture surfaces, with similar results. Figure 7. EDS analysis on the fracture surface of Alloy B SDAS 25 showing parts of a β‐particle in high magnification (a). Fe was detected in the (b) β‐particle which were identified together with visual (a) (b)
Figure 7.EDS analysis on the fracture surface of Alloy B SDAS 25 showing parts of a β-particle in high magnification (a). Fe was detected in the (b) β-particle which were identified together with visual observations. Al and Cu were mainly detected in the (c) aluminum dendrite, where dimples have formed in the center due to microvoid coalescence.
Figure8shows SEM images at higher magnification with cleavage of both β-particles and sludge in alloys A and B and alloys C and D, respectively. Opposite fracture surfaces in Figure8a,c shows the fracture of ductile dendrites through β-particles. In (b) and (d) the opposite sides of a fractured sludge particle are shown, characterized by smooth cleavage surfaces. On the contrary, the fracture surface of β-particles exhibit river marks, as observed in Figure9.
Metals 2016, 6, 314 7 of 15
observations. Al and Cu were mainly detected in the (c) aluminum dendrite, where dimples have formed in the center due to microvoid coalescence. Figure 8 shows SEM images at higher magnification with cleavage of both β‐particles and sludge in alloys A and B and alloys C and D, respectively. Opposite fracture surfaces in Figure 8a,c shows the fracture of ductile dendrites through β‐particles. In (b) and (d) the opposite sides of a fractured sludge particle are shown, characterized by smooth cleavage surfaces. On the contrary, the fracture surface of β‐particles exhibit river marks, as observed in Figure 9. (a) Alloy B, SDAS 25 (b) Alloy C, SDAS 10 (c) Alloy B, SDAS 25 (d) Alloy C, SDAS 10
Figure 8. The images show opposite fracture surfaces where (a,c) shows cleaved β‐particles and
ductile fracture of dendrites through the platelet. Image (b,d) shows a cleaved sludge particle.
Figure 9. Fracture surface of alloy B SDAS 25 showing a β‐particle with river marks.
Figure 8.The images show opposite fracture surfaces where (a,c) shows cleaved β-particles and ductile fracture of dendrites through the platelet. Image (b,d) shows a cleaved sludge particle.
Metals 2016, 6, 314 8 of 15
Metals 2016, 6, 314 7 of 15
observations. Al and Cu were mainly detected in the (c) aluminum dendrite, where dimples have formed in the center due to microvoid coalescence. Figure 8 shows SEM images at higher magnification with cleavage of both β‐particles and sludge in alloys A and B and alloys C and D, respectively. Opposite fracture surfaces in Figure 8a,c shows the fracture of ductile dendrites through β‐particles. In (b) and (d) the opposite sides of a fractured sludge particle are shown, characterized by smooth cleavage surfaces. On the contrary, the fracture surface of β‐particles exhibit river marks, as observed in Figure 9. (a) Alloy B, SDAS 25 (b) Alloy C, SDAS 10 (c) Alloy B, SDAS 25 (d) Alloy C, SDAS 10
Figure 8. The images show opposite fracture surfaces where (a,c) shows cleaved β‐particles and
ductile fracture of dendrites through the platelet. Image (b,d) shows a cleaved sludge particle.
Figure 9. Fracture surface of alloy B SDAS 25 showing a β‐particle with river marks.
Figure 9.Fracture surface of alloy B SDAS 25 showing a β-particle with river marks.
3.4. Microscopy of the Fracture Path
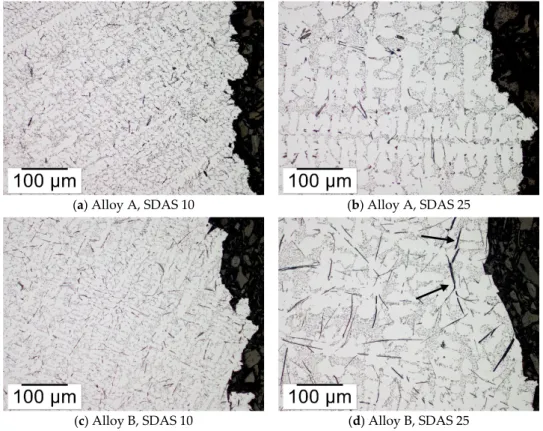
Figure10depicts the microstructure and the variation of Fe-rich particle morphologies towards the fracture in alloys A and B where the majority of Fe-rich particles were β-particles. The β-particles were revealed to influence the appearance of the fracture profile. In alloy B, having large β-particles, the crack profile was showing sections of straight segments. Additionally, cracked β-particles were also seen adjacent to the fracture surfaces as shown in Figure10d. The straight segments are due to the fracture of β-particles as seen in the SEM image in Figure11. The SEM image also shows a secondary crack towards the center of a β-particle together with cracks transverse to the β-particle. In the marked area a crack is extending in both the β-particle and the matrix, indicating a strong bond between the particle and the matrix. No secondary cracks propagating between the matrix and β-particles were observed. Metals 2016, 6, 314 8 of 15 3.4. Microscopy of the Fracture Path Figure 10 depicts the microstructure and the variation of Fe‐rich particle morphologies towards the fracture in alloys A and B where the majority of Fe‐rich particles were β‐particles. The β‐particles were revealed to influence the appearance of the fracture profile. In alloy B, having large β‐particles, the crack profile was showing sections of straight segments. Additionally, cracked β‐particles were also seen adjacent to the fracture surfaces as shown in Figure 10d. The straight segments are due to the fracture of β‐particles as seen in the SEM image in Figure 11. The SEM image also shows a secondary crack towards the center of a β‐particle together with cracks transverse to the β‐particle. In the marked area a crack is extending in both the β‐particle and the matrix, indicating a strong bond between the particle and the matrix. No secondary cracks propagating between the matrix and β‐ particles were observed. In alloy A with the lowest Fe:Mn ratio and smallest SDAS the fracture was exhibiting a more jagged profile and β‐particles were less influential in linking the crack. (a) Alloy A, SDAS 10 (b) Alloy A, SDAS 25
(c) Alloy B, SDAS 10 (d) Alloy B, SDAS 25
Figure 10. Micrographs of the microstructure towards the fracture surfaces of alloy A in (a,b) and alloy B in (c,d). In (d) are the arrows indicating secondary cracks of β‐particles. The samples are etched with H2SO4 in order to highlight the Fe‐rich particles. Examination of the bulk revealed that β‐particles parallel to the tensile test direction to a greater extend were cracked in comparison to particles transverse to the test direction. This is illustrated by Figure 12 showing a micrograph of β‐particles both parallel and transverse to the tensile test direction. The particle parallel to the test direction is having multiple cracks across its width, while the transverse particle is showing no signs of cracking.
The measurements of β‐particles showed that alloys A and B had a uniform length distribution of β‐particles along the reduced section of the samples. The average length of β‐particles is shown in Table 2; it can be observed that alloy A with SDAS 25 and alloy B with SDAS 10 have similar length of particles. In addition to the similar average β‐particle length, the mechanical properties were also Figure 10.Micrographs of the microstructure towards the fracture surfaces of alloy A in (a,b) and alloy B in (c,d). In (d) are the arrows indicating secondary cracks of β-particles. The samples are etched with H2SO4in order to highlight the Fe-rich particles.
Metals 2016, 6, 314 9 of 15
In alloy A with the lowest Fe:Mn ratio and smallest SDAS the fracture was exhibiting a more jagged profile and β-particles were less influential in linking the crack.
Examination of the bulk revealed that β-particles parallel to the tensile test direction to a greater extend were cracked in comparison to particles transverse to the test direction. This is illustrated by Figure12showing a micrograph of β-particles both parallel and transverse to the tensile test direction. The particle parallel to the test direction is having multiple cracks across its width, while the transverse particle is showing no signs of cracking.
The measurements of β-particles showed that alloys A and B had a uniform length distribution of β-particles along the reduced section of the samples. The average length of β-particles is shown in Table2; it can be observed that alloy A with SDAS 25 and alloy B with SDAS 10 have similar length of particles. In addition to the similar average β-particle length, the mechanical properties were also comparable for alloy A SDAS 25 and alloy B SDAS 10. The area fraction β-particles increased when the Fe content increased from 0.74 wt. % in alloy A to 1.17 wt. % in alloy B.
Metals 2016, 6, 314 9 of 15 comparable for alloy A SDAS 25 and alloy B SDAS 10. The area fraction β‐particles increased when the Fe content increased from 0.74 wt. % in alloy A to 1.17 wt. % in alloy B. Figure 11. SEM image towards the fracture surface of Alloy B SDAS 25 showing a secondary crack propagating within the β‐particle and a β‐particle along the fracture surface.
Figure 12. Cracks in a β‐particle parallel to the tensile test direction in alloy A SDAS 25, while β‐
particle transverse to test direction show no cracking.
Table 2. Measurement of β‐particle length and one standard deviation with corresponding UTS and ef.
Measured Feature Alloy A Alloy B
SDAS 10 SDAS 25 SDAS 10 SDAS 25
Average β‐particle length (μm) 1 40 ± 12 79 ± 26 74 ± 19 160 ± 45
UTS (MPa) 297 ± 14 258 ± 24 262 ± 50 228 ± 9
ef (%) 7.5 ± 2.6 3.4 ± 1.1 3.5 ± 2.4 1.1 ± 0.1
Area% β‐particles 1.12 ± 0.24 1.21 ± 0.58 2.08 ± 0.27 2.91 ± 0.57
1 average of the largest particle in 20–30 areas along the reduced section.
Ocular examination of alloys C and D showed variation in the morphology of the Fe‐rich particles along the reduced section of the samples; there were concentrations of sludge towards one end, and concentrations of β‐particles towards the other end. The variation was related to the vertical position of the sample in the directional solidification equipment. Towards the lower end of the samples sludge concentrations and area fractions porosity were higher and towards the top of the samples β‐particles were the dominating Fe‐rich particle. All fractures in alloys C and D were in the area where sludge was the main Fe‐rich particle. Figure 13 shows sludge particles near fractures in alloys C and D and no significant difference between the two alloys could be observed.
Away from the fracture surface cracked sludge particles were observed. The sludge particles predominantly cracked transversely to the tensile test direction; this is best depicted in Figure 13b,d.
Figure 11.SEM image towards the fracture surface of Alloy B SDAS 25 showing a secondary crack propagating within the β-particle and a β-particle along the fracture surface.
Metals 2016, 6, 314 9 of 15 comparable for alloy A SDAS 25 and alloy B SDAS 10. The area fraction β‐particles increased when the Fe content increased from 0.74 wt. % in alloy A to 1.17 wt. % in alloy B. Figure 11. SEM image towards the fracture surface of Alloy B SDAS 25 showing a secondary crack propagating within the β‐particle and a β‐particle along the fracture surface.
Figure 12. Cracks in a β‐particle parallel to the tensile test direction in alloy A SDAS 25, while β‐
particle transverse to test direction show no cracking.
Table 2. Measurement of β‐particle length and one standard deviation with corresponding UTS and ef.
Measured Feature Alloy A Alloy B
SDAS 10 SDAS 25 SDAS 10 SDAS 25
Average β‐particle length (μm) 1 40 ± 12 79 ± 26 74 ± 19 160 ± 45
UTS (MPa) 297 ± 14 258 ± 24 262 ± 50 228 ± 9
ef (%) 7.5 ± 2.6 3.4 ± 1.1 3.5 ± 2.4 1.1 ± 0.1
Area% β‐particles 1.12 ± 0.24 1.21 ± 0.58 2.08 ± 0.27 2.91 ± 0.57
1 average of the largest particle in 20–30 areas along the reduced section.
Ocular examination of alloys C and D showed variation in the morphology of the Fe‐rich particles along the reduced section of the samples; there were concentrations of sludge towards one end, and concentrations of β‐particles towards the other end. The variation was related to the vertical position of the sample in the directional solidification equipment. Towards the lower end of the samples sludge concentrations and area fractions porosity were higher and towards the top of the samples β‐particles were the dominating Fe‐rich particle. All fractures in alloys C and D were in the area where sludge was the main Fe‐rich particle. Figure 13 shows sludge particles near fractures in alloys C and D and no significant difference between the two alloys could be observed.
Away from the fracture surface cracked sludge particles were observed. The sludge particles predominantly cracked transversely to the tensile test direction; this is best depicted in Figure 13b,d.
Figure 12.Cracks in a β-particle parallel to the tensile test direction in alloy A SDAS 25, while β-particle transverse to test direction show no cracking.
Table 2.Measurement of β-particle length and one standard deviation with corresponding UTS and ef.
Measured Feature Alloy A Alloy B
SDAS 10 SDAS 25 SDAS 10 SDAS 25
Average β-particle length (µm)1 40±12 79±26 74±19 160±45
UTS (MPa) 297±14 258±24 262±50 228±9
ef(%) 7.5±2.6 3.4±1.1 3.5±2.4 1.1±0.1
Area% β-particles 1.12±0.24 1.21±0.58 2.08±0.27 2.91±0.57
1average of the largest particle in 20–30 areas along the reduced section.
Ocular examination of alloys C and D showed variation in the morphology of the Fe-rich particles along the reduced section of the samples; there were concentrations of sludge towards one end, and
Metals 2016, 6, 314 10 of 15
concentrations of β-particles towards the other end. The variation was related to the vertical position of the sample in the directional solidification equipment. Towards the lower end of the samples sludge concentrations and area fractions porosity were higher and towards the top of the samples β-particles were the dominating Fe-rich particle. All fractures in alloys C and D were in the area where sludge was the main Fe-rich particle. Figure13shows sludge particles near fractures in alloys C and D and no significant difference between the two alloys could be observed.
Away from the fracture surface cracked sludge particles were observed. The sludge particles predominantly cracked transversely to the tensile test direction; this is best depicted in Figure13b,d.
Metals 2016, 6, 314 10 of 15
(a) Alloy C, SDAS 10 (b) Alloy C, SDAS 25
(c) Alloy D, SDAS 10 (d) Alloy D, SDAS 25
Figure 13. Micrographs of the microstructure towards the fracture surfaces of alloy C in (a,b) and
alloy D in (c,d). The samples are etched with H2SO4 in order to highlight the Fe‐rich particles.
3.5. Effects of HIPing
Tensile testing was performed on 19 HIPed samples from alloys A to D with SDAS 10; the mechanical properties of as‐cast and HIPed samples are shown in Figure 14. The results show no significant differences between as‐cast and HIPed samples for either UTS or ef. (a) (b) Figure 14. Mechanical properties of as‐cast and HIPed samples where (a) is showing the variation in UTS and (b) is shows the variation in ef. Error bars are showing one standard deviation. After tensile testing the density of samples were measured and related to mechanical properties. The relation between the density and the UTS and ef is shown in Figure 15a,b, respectively. Alloys A and B were analyzed as one group and alloys C and D as another group, because the two groups have different morphologies of the Fe‐rich particles towards the fracture. Alloys A and B have β‐ particles and alloys C and D have sludge.
Figure 13.Micrographs of the microstructure towards the fracture surfaces of alloy C in (a,b) and alloy D in (c,d). The samples are etched with H2SO4in order to highlight the Fe-rich particles.
3.5. Effects of HIPing
Tensile testing was performed on 19 HIPed samples from alloys A to D with SDAS 10; the mechanical properties of as-cast and HIPed samples are shown in Figure14. The results show no significant differences between as-cast and HIPed samples for either UTS or ef.
Metals 2016, 6, 314 10 of 15
(a) Alloy C, SDAS 10 (b) Alloy C, SDAS 25
(c) Alloy D, SDAS 10 (d) Alloy D, SDAS 25
Figure 13. Micrographs of the microstructure towards the fracture surfaces of alloy C in (a,b) and
alloy D in (c,d). The samples are etched with H2SO4 in order to highlight the Fe‐rich particles.
3.5. Effects of HIPing
Tensile testing was performed on 19 HIPed samples from alloys A to D with SDAS 10; the mechanical properties of as‐cast and HIPed samples are shown in Figure 14. The results show no significant differences between as‐cast and HIPed samples for either UTS or ef. (a) (b) Figure 14. Mechanical properties of as‐cast and HIPed samples where (a) is showing the variation in UTS and (b) is shows the variation in ef. Error bars are showing one standard deviation. After tensile testing the density of samples were measured and related to mechanical properties. The relation between the density and the UTS and ef is shown in Figure 15a,b, respectively. Alloys A and B were analyzed as one group and alloys C and D as another group, because the two groups have different morphologies of the Fe‐rich particles towards the fracture. Alloys A and B have β‐ particles and alloys C and D have sludge.
Figure 14.Mechanical properties of as-cast and HIPed samples where (a) is showing the variation in UTS and (b) is shows the variation in ef. Error bars are showing one standard deviation.
Metals 2016, 6, 314 11 of 15
After tensile testing the density of samples were measured and related to mechanical properties. The relation between the density and the UTS and efis shown in Figure15a,b, respectively. Alloys A and B were analyzed as one group and alloys C and D as another group, because the two groups have different morphologies of the Fe-rich particles towards the fracture. Alloys A and B have β-particles
and alloys C and D have sludge.Metals 2016, 6, 314 11 of 15
Figure 15. Effect of HIPing on mechanical properties for alloys A and B combined and alloys C and D, combined. Both figures are showing the effect of HIPing and (a) is relating UTS to density and (b) is showing ef in relation to density. There is no increase in density when HIPing alloys A and B, but there is a trend of increased density for HIPed alloys C and D. For alloys A and B there is no significant difference in UTS or ef between the HIPed and as‐cast samples. For alloys C and D HIPing did not affect UTS, but there is a small trend of improved ef for HIPed samples.
Stereo microscopy of the HIPed samples showed a reduction in the number of samples containing porosity at the fracture surfaces of alloys C and D while the amount of oxides remained comparable for as‐cast and HIPed samples. For alloys A and B the number of samples containing porosity and oxides remained comparable for as‐cast and HIPed samples. Table 3 below shows the measurements and the standard deviations show a large variation, especially for the area fraction of oxides.
Alloys C and D had a higher number of samples with thick oxides on the fracture surface compared to alloys A and B. Therefore, in order to improve the evaluation of the effect of HIPing, only the samples without visible oxides on the fracture surfaces were compared to each other; see Table 4. For alloys A and B the UTS for the HIPed samples is slightly lower while the ef is comparable. For alloys C and D the UTS is comparable and there is a slight increase in ef of the HIPed samples. Microstructural examination of the bulk material did not show any variation between HIPed and as‐cast samples. Table 3. Results of measurements ± standard deviation, made at the fracture surface of images taken with a stereo microscope.
Measured Feature As‐Cast (SDAS 10) HIPed (SDAS 10)
A and B C and D A and B C and D
No of samples with porosity 1 of 12 9 of 11 2 of 9 4 of 10 Porosity area (%) 1.9 ± n/a 7.4 ± 5.7 1.5 ± 1.6 1.5 ± 0.5 Average No of pores 4 ± n/a 7.9 ± 5.3 1 ± 0 1.5 ± 0.6 Average size of pores (mm2) 0.13 ± 0.06 0.27 ± 0.26 0.42 ± 0.44 0.29 ± 0.16
No of samples with oxides 2 of 12 5 of 11 2 of 9 5 of 10 Oxides area (%) 15.7 ± 11.5 12.7 ± 12.7 29.9 ± 20.6 23.6 ± 12.5
Table 4. Mechanical properties with one standard deviation of samples not having any visible oxides at the fracture surface.
Tensile Property As‐Cast (SDAS 10) HIPed (SDAS 10)
A and B C and D A and B C and D
UTS (MPa) 295 ± 14 221 ± 22 273 ± 19 229 ± 14
ef (%) 6.4 ± 2.5 1.6 ± 0.6 7.0 ± 3.1 2.6 ± 0.8
(a) (b)
Figure 15.Effect of HIPing on mechanical properties for alloys A and B combined and alloys C and D, combined. Both figures are showing the effect of HIPing and (a) is relating UTS to density and (b) is showing efin relation to density.
There is no increase in density when HIPing alloys A and B, but there is a trend of increased density for HIPed alloys C and D. For alloys A and B there is no significant difference in UTS or ef between the HIPed and as-cast samples. For alloys C and D HIPing did not affect UTS, but there is a small trend of improved effor HIPed samples.
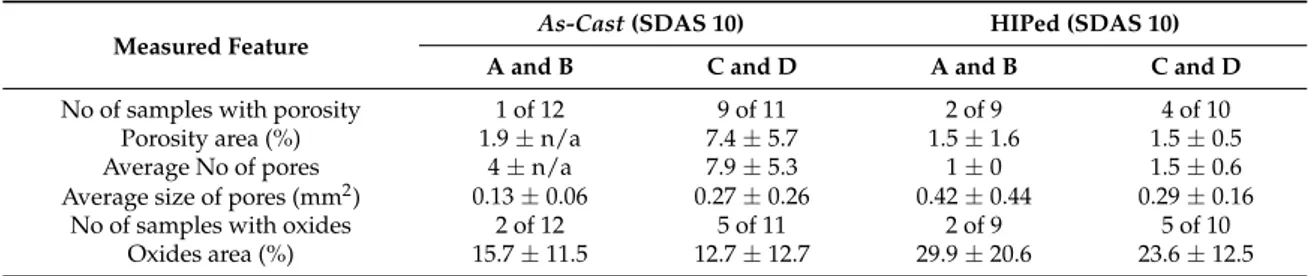
Stereo microscopy of the HIPed samples showed a reduction in the number of samples containing porosity at the fracture surfaces of alloys C and D while the amount of oxides remained comparable for as-cast and HIPed samples. For alloys A and B the number of samples containing porosity and oxides remained comparable for as-cast and HIPed samples. Table3below shows the measurements and the standard deviations show a large variation, especially for the area fraction of oxides.
Table 3.Results of measurements±standard deviation, made at the fracture surface of images taken with a stereo microscope.
Measured Feature As-Cast (SDAS 10) HIPed (SDAS 10)
A and B C and D A and B C and D
No of samples with porosity 1 of 12 9 of 11 2 of 9 4 of 10
Porosity area (%) 1.9±n/a 7.4±5.7 1.5±1.6 1.5±0.5
Average No of pores 4±n/a 7.9±5.3 1±0 1.5±0.6
Average size of pores (mm2) 0.13±0.06 0.27±0.26 0.42±0.44 0.29±0.16
No of samples with oxides 2 of 12 5 of 11 2 of 9 5 of 10
Oxides area (%) 15.7±11.5 12.7±12.7 29.9±20.6 23.6±12.5
Alloys C and D had a higher number of samples with thick oxides on the fracture surface compared to alloys A and B. Therefore, in order to improve the evaluation of the effect of HIPing, only the samples without visible oxides on the fracture surfaces were compared to each other; see Table4. For alloys A and B the UTS for the HIPed samples is slightly lower while the efis comparable. For alloys C and D the UTS is comparable and there is a slight increase in efof the HIPed samples.
Microstructural examination of the bulk material did not show any variation between HIPed and as-cast samples.
Metals 2016, 6, 314 12 of 15
Table 4.Mechanical properties with one standard deviation of samples not having any visible oxides at the fracture surface.
Tensile Property
As-Cast (SDAS 10) HIPed (SDAS 10)
A and B C and D A and B C and D
UTS (MPa) 295±14 221±22 273±19 229±14
ef(%) 6.4±2.5 1.6±0.6 7.0±3.1 2.6±0.8
4. Discussion
There were variations in tensile test results with various sludge factors and Fe:Mn ratios. The alloys having the lowest SF and highest Fe:Mn ratio and hence contained β-particles (alloys A and B) exhibited the highest UTS and ef. It was shown that either an increase in Fe:Mn ratio or longer solidification time, in terms of SDAS, will increase the length of β-particles. Similar length of β-particles could, therefore, be achieved in two alloys with different Fe content by having different solidification times. Similar UTS and efwere obtained in the two different alloys with similar length of β-particles, (regardless of the SDAS), hence, the β-particle length seems to be correlated to the UTS and ef. What further suggest a strong influence of β-particles on mechanical properties is the vast amount of particles at the fracture surfaces. The area fraction of β-particles in the bulk was seen to increase with higher Fe content. The area fractions β-particles in the two alloys with similar average β-particle length were 1.21%±0.58% and 2.08%±0.27%, respectively. Hence, the particle length appears more important than the area fraction in these ranges.
Comparing the YS of alloy A with alloy B, the latter exhibits on average approximately 12 MPa higher YS. This difference in YS may be attributed to larger β-particles as well as their area fraction. The β-particles are expected to have significantly higher yield strength because they are significantly harder than the matrix. β-particles have been measured to have a microhardness value of 650±60 HV compared to the aluminum matrix with a hardness value of 74±5 HV [27]. The higher yield strength of alloy B is therefore assumed to be due secondary particle strengthening where the matrix transfers a portion of the load onto the complex 3D structures of β-particles [28]. In addition to this the mismatch in thermal expansion between the β-particles and the matrix phase [29]. These two effects are both originating from dispersion hardening effects [30].
The lack of variations in UTS and ef between alloys C and D with sludge particles towards the fracture could be explained by the randomness in distribution and size of sludge particles, in which no significant difference was concluded. No measurements of area fractions or sizes of sludge were conducted because the inconsistent distribution of particles would render results which are not appropriate for analysis. The reason for not detecting any differences is linked to the manufacturing of samples and the fact that the precipitation of sludge starts in the molten metal. When the samples are molten in a vertical position, as in directional solidification equipment, nucleated particles can settle towards the bottom. Sludge particles are thought to settle to a greater extent than β-particles due to different nucleation temperatures and Stokes velocities. Sludge particles nucleate at higher temperature and have more time to settle. Their lower aspect rations, compared to β-particles, makes the drag factor lower and Stokes velocities higher. The settlement of sludge particle and nucleation was not possible to control in the equipment, hence, the distribution and particle sizes became random. The differences in settling between sludge and β-particles also explain the morphology variation along the reduced section in samples containing sludge.
HIPed samples of alloys A and B had similar density as as-cast samples. Hence, the porosity in alloys A and B was relatively low already in the as-cast condition. This is due to nucleation and growth of the β-particles in alloys A and B at lower temperatures, in comparison to the sludge in alloys C and D [31]. At the lower temperature the hydrogen content is lower and the β-particles do not nucleate porosity to the same extent as the sludge particles in alloys C and D. The analysis of the fracture surfaces from alloys C and D showed that as-cast samples had significantly higher amount
Metals 2016, 6, 314 13 of 15
of porosity compared to the HIPed; the area of porosity was reduced from 7.4% to 1.5% with HIPing. The higher level of porosity in as-cast samples from alloys C and D made the effect of HIPing more pronounced in those alloys, in terms of density. It is believed that the primary formed sludge may act as nucleation sites for hydrogen porosity and/or hinder pores to escape.
In terms of UTS and ef, the differences between alloys were less pronounced. The UTS was not improved by the HIPing process; however, the efshowed an indication of improvement for alloys C and D increasing from 1.1% to 1.8% after HIPing. However, the fact that alloys C and D still are the two alloys having the lowest mechanical properties remain. According to measurements by Surappa et al. [32] there is a significant reduction in efand also a trend of reduction of UTS in samples with an area fraction of porosity greater than 1%. This is in agreement with the results in this paper where HIPed samples from alloys C and D showed reduction in porosity and a small increase in ef, compared to as-cast samples.
When excluding samples with thick oxides on the fracture surfaces the same trends were seen; HIPing cause a slight improvement of the ef but the UTS was not improved for alloys C and D. It can, therefore, be concluded that the lower UTS and efin alloys C and D, compared to alloys A and B, are mainly linked to the difference in the morphology of Fe-rich particles that was achieved by increasing the SF and not to thick oxides or porosity.
Through SEM it was confirmed that the fracture surface had β-particles on either side of the fracture, showing a strong particle-matrix bonding and cleavage of the particles. In addition, fracture patterns, such as river marks, were seen on the surfaces of β-particles. Examination of polished cross-sections of the fracture path showed a fracture linked by β-particles. Secondary cracks towards the center of β-particles and secondary cracks stretching from the matrix into the particles and not being diverted at the particle-matrix interface indicate a strong particle-matrix bonding.
Transverse cracks in β-particles seen in the bulk samples are due to the strain in the sample during tensile testing, and not from sample preparation. This is concluded from the fact that β-particles oriented parallel to the test direction are more prone to cracks than β-particles transverse to the test direction and during sample preparation are the samples ground and polished at random directions. β-particles parallel to the test direction are more easily cracked due to the lower energy required to create the fracture surface which is smaller than the surface generated when a transverse particle fracture. Similar cracks parallel to the fracture surface were observed in sludge particles. Due to the predominant orientation of the cracks parallel to the fracture surface where they assessed as cracks and not effects of bifilms. However, the morphology of sludge particles makes them less affected by orientation.
Due to similar chemical composition in all alloys, except the additions of Fe, Mn, and Cr, followed by the same procedure for sample production, it is assumed that the Al-matrix has similar strength in all alloys studied. The alloys containing sludge particles had lower tensile properties than alloys containing β-particles. This is believed to be due to sludge particles having contributed to the larger surface area of cracked particles and coalescence of fractured particles is what causes the fracture of tensile samples. One explanation to why the surface area of fractured sludge would be larger is because sludge does not have the orientation effect that β-particles do, making more or less every sludge particle susceptible to cracking. It is also important to remember that it is not only the morphology that differs between β-particles and sludge, but the chemical composition and crystal structures are also different. Hence, mechanical properties of the two Fe-rich particles needs to be studied further.
The fracture surface examined in SEM showed that crack propagation occurs through cleavage. In the case of a “pre-cracked” central axis no fracture surface would have been expected since the surfaces would be separated by a bifilm. The fracture features hence indicate that β-particles nucleating on oxides do so preferentially in an angle towards oxides, in accordance with in situ observations by Terzi et al. [17].
Metals 2016, 6, 314 14 of 15
5. Conclusions
From examinations of tensile-tested EN 46000 alloy, with variations in Fe, Mn, and Cr, the following can be concluded:
• Two alloys with different chemical compositions and different solidification rates (SDAS), but with similar β-particles size, exhibited similar UTS and ef.
• Mn and Cr additions to the Al-Si alloy modified the morphology of β-particles into sludge particles and decreased mechanical properties. Hence, the use of these modifiers should be used with care.
• Sludge governs, to some extent, the formation of porosity in the directional solidified samples. The porosity at the fracture surfaces increased in alloys where the Fe-rich particles were modified into sludge.
• Fe-rich β-particles and sludge fracture preferably through cleavage without influence of oxides, but not by particle-matrix decohesion.
Acknowledgments:The Swedish Knowledge Foundation for financial support of the CompCAST profile and Bodycote Heiß-Isostatisches Pressen GmbH are highly acknowledged.
Author Contributions: Anton Bjurenstedt and Salem Seifeddine conceived and designed the experiments; Anton Bjurenstedt performed the experiments; Anton Bjurenstedt, Salem Seifeddine and Anders E. W. Jarfors analyzed the data; Anton Bjurenstedt wrote the paper.
Conflicts of Interest:The authors declare no conflict of interest
References
1. Taylor, J.A. Iron-containing intermetallic phases in Al-Si based casting alloys. Procedia Mater. Sci. 2012, 1, 19–33. [CrossRef]
2. Backerud, L.; Chai, G.; Tamminen, J. Solidification Characteristics of Aluminum Alloys, Vol. 2: Foundry Alloys; AFS-Skanaluminium: Stockholm, Sweden, 1990; p. 266.
3. Dinnis, C.M.; Taylor, J.A.; Dahle, A.K. As-cast morphology of iron-intermetallics in Al–Si foundry alloys. Scr. Mater. 2005, 53, 955–958. [CrossRef]
4. Seifeddine, S.; Svensson, I.L. The influence of Fe and Mn content and cooling rate on the microstructure and mechanical properties of A380-die casting alloys. Metall. Sci. Technol. 2009, 27, 11–20.
5. Zahedi, H.; Emamy, M.; Razaghian, A.; Mahta, M.; Campbell, J.; Tiryakio ˘glu, M. The effect of Fe-rich intermetallics on the Weibull distribution of tensile properties in a cast Al-5 pct Si-3 pct Cu-1 pct Fe-0.3 pct Mg alloy. Metall. Mater. Trans. A 2007, 38, 659–670. [CrossRef]
6. Wang, L.; Apelian, D.; Makhlouf, M.M. Iron-bearing compounds in Al-Si diecasting alloys: Morphology and conditions under which they form. Trans. Am. Found. Soc. 1999, 107, 231–238.
7. Hwang, J.Y.; Doty, H.W.; Kaufman, M.J. The effects of Mn additions on the microstructure and mechanical properties of Al–Si–Cu casting alloys. Mater. Sci. Eng. A 2008, 488, 496–504. [CrossRef]
8. Crepeau, P.N. Effect of iron in Al-Si casting alloys: A critical review. AFS Trans. 1995, 103, 361–366. 9. Shabestari, S.G. The effect of iron and manganese on the formation of intermetallic compounds in
aluminum–silicon alloys. Mater. Sci. Eng. A 2004, 383, 289–298. [CrossRef]
10. Dunn, R. Aluminum melting problems and their influence on furnace selection. Die Cast. Eng. B 1965, 9, 8–30.
11. Ji, S.; Yang, W.; Gao, F.; Watson, D.; Fan, Z. Effect of iron on the microstructure and mechanical property of Al–Mg–Si–Mn and Al–Mg–Si diecast alloys. Mater. Sci. Eng. A 2012, 564, 130–139. [CrossRef]
12. Vorren, O.; Evensen, J.; Pedersen, T. Microstructure and mechanical properties of AlSi(Mg) casting alloys. AFS Trans. 1984, 92, 84–462.
13. Samuel, A.M.; Samuel, F.H.; Doty, H.W. Observations on the formation of β-Al5FeSi phase in 319 type Al-Si alloys. J. Mater. Sci. 1996, 31, 5529–5539. [CrossRef]
14. Cao, X.; Campbell, J. The nucleation of Fe-rich phases on oxide films in Al-11.5Si-0.4Mg cast alloys. Metall. Mater. Trans. A 2003, 34A, 1409–1420. [CrossRef]