INOM
EXAMENSARBETE BIOTEKNIK,
AVANCERAD NIVÅ, 30 HP ,
STOCKHOLM SVERIGE 2017
Automation of manual Hepatitis E
(HEV) and Hepatitis A (HAV) PCR
analysis to Tecan FreedomEVO 150
SOFIE ALBINSSON
KTH
Automation of manual Hepatitis E (HEV)
and Hepatitis A (HAV) PCR analysis to
Tecan Freedom EVO 150
Sofie Albinsson
Degree project in biotechnology, second cycle, 30 credits KTH Royal Institute of Technology
1 (93)
1. Abstract
Automation of the hepatitis E virus (HEV) PCR analysis at Octapharma AB has been developed as a part of this degree project from KTH Royal Institute of Technology in Stockholm. The manual pipetting procedures utilized in the HEV PCR analysis of human blood plasma have been automated in the Tecan Freedom EVO 150 laboratory robot and the resulting programs could also be applied for TaqMan based detection of hepatitis A virus (HAV). Four scripts corresponding to different stages of the manual HEV pipetting procedure were programmed in the EVOware software. The programs were first developed with water as sample matrix and were thereafter adapted to the more viscous plasma matrix and were finally tested with PCR amplification of virus containing plasma samples of varying concentrations. The results from the automated experiments were compared to results from equivalently performed manual experiments. Finally, the automated and manual HEV pipetting procedures were statistically evaluated in a Probit analysis of HAV samples in the statistical computer program CombiStat. The method sensitivity for the automated procedure calculated in the Probit analysis was determined to 2.23 IU/mL and the method sensitivity for the manual pipetting procedure was determined to 3.61 IU/mL. The results from the comparative manual and automated experiments revealed no significant differences in viral detection of positive samples nor in fluorescence levels or crossing point values in the amplification. The automated approach was therefore assessed to have no negative impact on the analysis and based on the improved method sensitivity and the equivalence of the automated and manual amplification parameters, the automated the HEV- and HAV PCR analyses were judged as viable and comparable replacements of the established manual pipetting procedures.
2 (93)
2. Sammanfattning
Automatisering av Octapharma AB:s PCR baserade analysmetod för detektion av hepatit E virus (HEV) har utvecklats som en del av detta examensarbete från Kungliga Tekniska Högskolan i Stockholm. De manuella pipetteringssteg som idag används vid HEV PCR analyser av human blodplasma har automatiserats i pipetteringsroboten Tecan Freedom EVO 150 och de slutgiltiga programmen kunde även användas för TaqMan-baserad detektion av hepatit A virus (HAV). Fyra program som motsvarar olika steg i den etablerade manuella pipetteringsmetoden utvecklades i Tecans mjukvara EVOware. Programmen utvecklades först med vatten som provmatris och anpassades därefter till en mer viskös plasmamatris och testades slutligen med PCR amplifiering av virusinnehållande plasmaprover av olika koncentrationer. Resultaten från de automatiserade experimenten jämfördes med resultat från motsvarande manuellt utförda experiment. Slutligen utvärderades de automatiserade och manuella metoderna i en Probitanalys med HAV prover i det statistiska datorprogrammet CombiStats. Metodkänsligheten för den automatiserade metoden beräknades i Probitanalysen till 2,23 IU/mL och metodkänsligheten för det manuella tillvägagångssättet beräknades till 3,61 IU/mL. Resultaten från de jämförande manuella och automatiserade experimenten medförde inga framstående skillnader i virusdetektion av positiva prov, i fluorescensvärde eller i värden för crossing point (startpunkten på en amplifieringskurva) i PCR-analysen. Den automatiserade metoden bedömdes därav inte ha någon negativ påverkan på analysen och baserat på den förbättrade metodkänsligheten samt de likvärdiga resultat som erhölls från de automatiserade och manuella processerna bedömdes de automatiserade HEV- och HAV PCR analyserna vara fungerande och jämförliga ersättningsmetoder för de etablerade manuella pipetteringsmetoderna.
3 (93)
Table of Contents
1. Abstract ... 1
2. Sammanfattning ... 2
3. Introduction ... 4
4. Materials and method ... 8
4.1 Programming ... 8
4.2 Experimental procedures ... 11
4.2.1 HEV analysis method ... 11
4.2.2 Method evaluation ... 17
5. Results ... 21
5.1 Comparative tests of programs for the HEV method ... 21
5.1.1 Test of automation for 96-pools ... 21
5.1.2 Test of automation for secondary pooling ... 24
5.2 Probit evaluation ... 27
6. Discussion ... 30
7. Future perspectives ... 35
8. Acknowledgements ... 35
9. References ... 36
Appendix A – Raw data from experiments ... 39
Appendix B – Probit reports ... 48
Appendix C – Program code ... 51
C.1 Program P1 ... 51
C.2 Program P1_secpool ... 62
C.3 Program P2 ... 81
4 (93)
3. Introduction
Blood plasma is one of the main components of blood and it constitutes approximately 55% of the total blood volume. The plasma contains various components with different functions including water, mineral salts and ions, carbohydrates, amino acids, ATP, hormones, peptides, (glyco)-proteins and much more [1]. Plasma proteins exhibit diverse functions and structures and can e.g. have functions within the immune system, the complement system and in blood coagulation [2]. Proteins derived from human blood plasma are a valuable raw material for pharmaceutical drug development and the pharmaceutical company Octapharma AB specializes in this domain of pharmaceutical production. Octapharma AB is currently one of the four largest companies of the global market that produce drugs from donations of human plasma. The company utilize plasma proteins such as coagulation factors, immunoglobulins, and albumin to produce pharmaceutical drugs designed for treatment of blood-clotting disorders including haemophilia and von Willebrand disease, for immunotherapy and, for critical care of e.g. heavy burns, injuries and surgery [3, 4]. Prior to the pharmaceutical production the plasma donations are tested for presence of Hepatitis A, Hepatitis B, Hepatitis C, HIV, Parvovirus B19, and in some instances also Hepatitis E, to guarantee safety of the drugs [3]. The viral detection is performed via the polymerase chain reaction (PCR), a DNA amplification method with a variety of applications [5, 6]. In PCR, predefined DNA is amplified by utilizing oligonucleotide primers specially designed to hybridize to the target DNA which are subsequently elongated by a heat stable, DNA dependent DNA polymerase that inserts nucleotide bases to the annealed primers to form new, complementary DNA strands. The three phases of PCR, denaturation into single DNA strands, primer annealing and elongation, are regulated by cyclic temperature changes. The entire temperature cycle is repeated a preset amount of times and after each cycle the newly synthesized DNA strands function as templates for replication in the succeeding cycles [7].
The analysis method for detection of Hepatitis E virus (HEV) at the Octapharma AB PCR laboratory in Stockholm, Sweden, is based on qualitative reverse transcription-PCR (RT-PCR) of extracted viral nucleic acid. Each sample is tested with an internal control (IC) of Bovine Viral Diarrhoea Virus (BVDV) and amplification of BVDV is required for the acceptance of a HEV negative result. The nucleic acids in the sample and IC mix are extracted by magnetic silica particles on a NucliSens easyMAG instrument (bioMerieux) which has the capacity to extract 24 samples (including positive and negative controls) per run. The RT-PCR reaction of the extracted eluates is performed in a LightCycler 480 instrument (Roche) where 96 samples
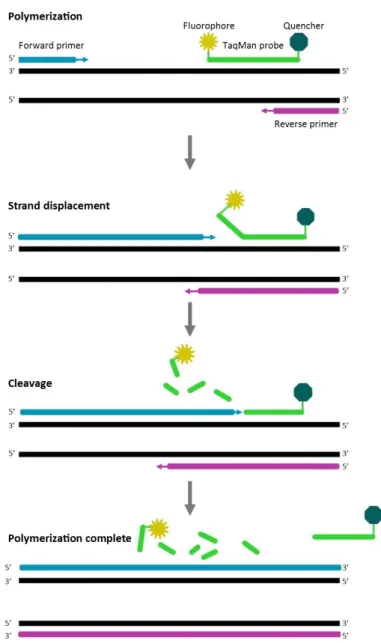
5 (93) can be analyzed simultaneously. In the RT-PCR analysis viral RNA is converted into cDNA in a reverse transcription step prior to the cyclic amplification and real-time detection is enabled by fluorophore conjugated TaqMan probes [8]. The TaqMan probes specifically bind the extracted and reverse-transcribed HEV DNA and are equipped with a reporter dye on the 5’ end and a quencher dye on the 3’ end. The close proximity of quencher and reporter dye on the intact probe results in a reduction of fluorescence emitted from the reporter dye. When the viral target sequence is present the hybridized TaqMan probe becomes cleaved during elongation by the DNA polymerase enzyme, thereby separating the quencher and reporter dyes which removes the blockade of the fluorescence and thus enables detection [7, 9].
Figure 1: Principle for detection in PCR amplification with TaqMan probes. Primers and probes specifically bind to the DNA strands. The primers are elongated by DNA polymerase, the probe becomes displaced and is subsequently cleaved by the DNA polymerase. The cleavage disrupts the proximity of fluorophore and quencher which enables detection of the fluorescence.
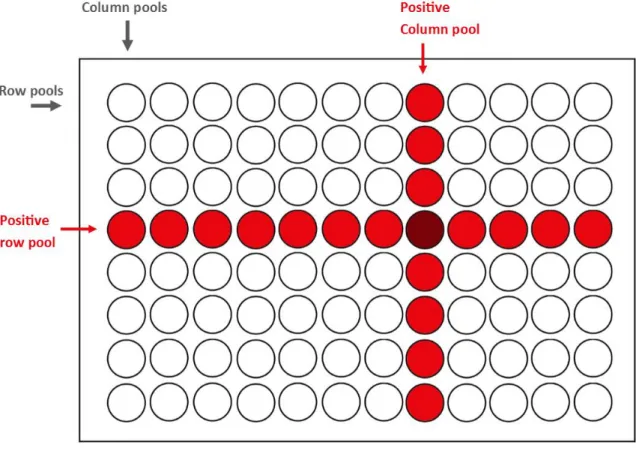
6 (93) The HEV analysis at Octapharma AB is performed on 96-pools where one 96-pool consists of a mix of 96 separate plasma donations [8]. If a negative results is obtained from the analysis of the 96-pool, the individual 96 donations are classified as HEV negative. If the analysis result is positive further PCR analyses are performed on the 96-pool by utilizing a secondary pooling procedure. Samples from each well in the corresponding 96-well microtiter plate containing the individual donations are pooled in row- and column-pools (R-pools and C-pools) and are subsequently analyzed by PCR. Eight R-pools are made by pooling the twelve samples in each row in the 96-well microtiter plate and twelve C-pools are made by pooling the donations in each column (Figure 2). Each donation is thus tested in two additional PCR analyses and the positive donations can be identified at the intersection of rows and columns. The identified donations are thereafter individually analyzed in a confirmation test [8]. Viral detection of Hepatitis A virus (HAV) can be tested based on the same principle as in the HEV analysis method.
Figure 2: Secondary pooling of the individual plasma donations. The samples in each row of the 96-well microtiter plate are pooled in row pools (R-pools) and the samples in each column are pooled in column pools (C-pools). The positive donations can be identified at the intersection of the positive R- and C-pools. The positive donation is demonstrated with a dark red color.
7 (93) HEV is a small, non-enveloped virus that can cause liver infection in humans [10, 11]. The symptoms of hepatitis E are usually very mild, but symptoms similar to other types of acute viral hepatitis can occur such as fever, fatigue, loss of appetite, jaundice (the skin and the whites of the eyes get a yellow hue) and sore and swollen liver [10, 12, 13]. Hepatitis E is usually self-limiting but some individuals may develop acute liver failure. This is most common during pregnancy where the fatality rates have been reported to reach 20-25% [14]. The hepatitis E virus belong to the Hepeviridae family and its genome consist of 7.2 kb positive-sense, single stranded RNA [11, 15]. There are four main HEV genotypes that cause infection in humans [8]. Infections of genotype 1 and 2 are most common in developing countries in Asia and Africa where the virus is predominantly transmitted via contaminated water due to its spread via the fecal-oral route [10, 16]. Infections caused by genotype 3 and 4 are primarily found in developed countries where zoonotic transmission and foodborne transmission are thought to be the main causes [10, 16].
HAV is a small, non-enveloped, single stranded RNA virus from the family Picornaviridae, which is the cause for the liver disease hepatitis A [17, 18]. Hepatitis A symptoms can vary in severity and can include fever, loss of appetite, abdominal pain, jaundice and diarrhea [18, 19]. Infection of HAV mainly occurs via the fecal-oral route, either by ingestion of contaminated water and food or by close physical contact with an HAV infected individual [17, 18, 19]. Infections can also occur via anal-oral sexual contact and via blood transfusions [17]. Most individuals recover without treatment and among the otherwise healthy individuals less than 1% develop acute liver failure [18, 20].
The Tecan Freedom EVO instrument is a platform for automation of general laboratory procedures such as routine pipetting. Different robotics, devices and pipetting steps can be combined to provide a customized automation procedure [21]. The robotics included in the Tecan Freedom EVO 150 instrument at the Octapharma AB PCR laboratory are a robotic arm called the liquid handling arm that utilizes disposable pipette tips to perform all the different pipetting steps in each program and a robotic barcode scanner, PosID-3. The Tecan Freedom EVO 150 instrument contains an empty worktable that can be filled with specified carries and labware. The “labware” corresponds to laboratory material such as microtiter plates, pipette tips and tubes and “carries” are specially designed vessels that hold the labware [22]. Different worktables and automated pipetting procedures can be programmed into the pipetting instrument with the Freedom EVOware software. The EVOware software has a graphical user interface in which the programming process is executed [21]. The programmed scripts can be
8 (93) run in virtual tests by utilizing the 3D simulation tool EVOsim where the movements of the robotic arm and other devices of the Freedom EVO pipetting instrument can be visualized [22]. To further customize and improve the pipetting procedures multiple predefined liquid classes for different types of liquids can be altered and included for each individual pipetting step [22]. In this degree project automated pipetting procedures for the HEV- and HAV analysis methods have been developed and tested on the laboratory pipetting robot Tecan Freedom EVO 150. Four scripts have been developed to correspond to four different stages of the HEV analysis method. Two programs were designed for the transfer of either 96-pool samples or samples from the secondary pooling into easyMAG sample cassettes as a preparation for the following nucleic acid extraction. In these programs internal control (IC), positive control, negative control and samples are pipetted from their respective tubes into the easyMAG sample cassettes. The final two programs have been developed for the transfer of the easyMAG-extracted nucleic acid (eluate) into 96-well microtiter plates and for the subsequent PCR preparation where a master mix of enzymes, primers, probes etc. and the extracted eluates are pipetted into a 96-well microtiter plate used for PCR amplification. Each of the developed programs were submitted to substantial laboratory tests and finally a statistical Probit evaluation in CombiStats for HAV was performed to estimate the method sensitivity, i.e. the lowest viral concentration that can be detected with a 95% probability. The method sensitivity for the current, not TaqMan based, HAV analysis method at Octapharma AB is 26 IU/mL and the method sensitivity for the TaqMan based HEV analysis method is 15 IU/mL [8, 23].
The project has been structured around the hypothesis that “based on established manual pipetting procedures and acquired knowledge regarding instruments and the HEV analysis method, effective and reliable automated pipetting can be introduced to the Tecan Freedom EVO 150 laboratory robot in such a way that the quality of the analysis and work environment are improved”.
4. Materials and method
4.1 Programming
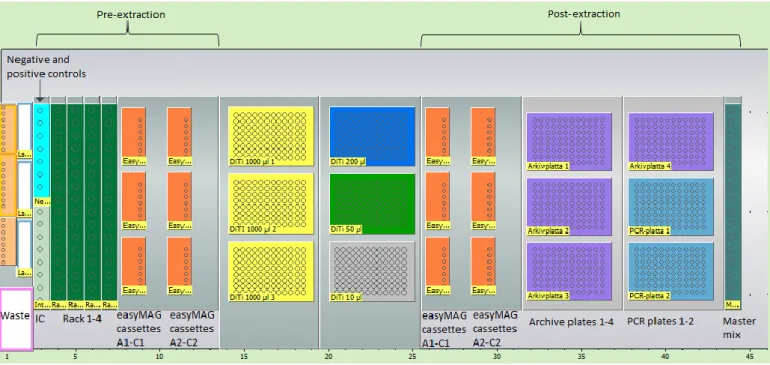
Initially a worktable with all the correct carriers and labware was physically set up in the Tecan Freedom EVO 150 instrument. Thereafter, the same layout was designed in the EVOware software and the result was set as a template worktable to serve as a standard layout for all the programs (Figure 3). Not all carriers and labware were present as defaults in the Freedom EVOware program, therefore new templates were created for the easyMAG cassettes and a
9 (93) divided carrier tube rack was designed for the negative- positive- and internal controls. Two empty tubes with permanent barcodes were placed in the first two positions of rack 1 and rack 3 in order to enable scanning of positive and negative controls since these tubes are physically positioned in an adapter in the tube carrier and cannot be scanned by the built in PosID-3 scanner. After the completion of the layout the dimensions (lengths, depth, center etc.) of the wells of each corresponding labware equipment was taught to the Tecan 150 robot. The teaching was performed by manually moving the robotic liquid handling arm with the keyboard to the desired positions and thereafter saving the resulting coordinates as specific positions, such as the desired dispensing position and the position for the bottom of the wells. Thereafter so called “safe pathways” were introduced for all carriers except for the pipette tip carriers. The “safe pathway” function is a setting that decreases the contamination risk by eliminating movements of the pipette tips directly over any wells after the aspiration.
Four programs, P1, P1_secpool, P2 and P3, were created based on the set worktable. P1 and P1_secpool were created to correspond to the manual pre-extraction pipetting procedures with distribution of internal control, positive controls, negative controls and samples into easyMAG sample cassettes. P1 was created for the “normal” 96-pool samples and P1_secpool was
Figure 3: Worktable for program P1, P1_secpool, P2 and P3 in the Tecan Freedom EVO 150 instrument as presented in EVOware. Negative and positive controls and internal controls are placed in a joint but divided tube rack. The plasma samples for extraction 1 are placed in rack 1-2 and the samples for extraction 2 are placed in rack 3-4. The controls and samples are transferred into easyMAG cassettes A1-C1 and A2-C2 located in the pre-extraction part of the worktable in program P1 and P1_secpool. In P2 the eluates are transferred from easyMAG cassettes A1-C1 and A2-C2 on the post-extraction side of the worktable into archive plate 1 or archive plates 1 and 2. In P3 master mix is distributed into one PCR plate (PCR plate 1) and eluates from archive plates 1-4 are transferred to the same PCR plate. Pipette tips of sizes in the range from 10-1000 µl are placed in the middle of the worktable and serve as a natural divider for the two parts of the worktable.
10 (93) developed for the analysis of secondary pooling with R- and C-pools and confirmation test samples. P2 was developed as a post elution program for the transfer of eluate from easyMAG sample cassettes to 96-well microtiter archive plates. Programs P1, P1_secpool and P2 were created to enable two simultaneous and separate easyMAG extractions. The maximum number of samples per easyMAG extraction is 24 and therefore the maximum number of samples handled in programs P1, P1_secpool and P2 was set to 48 samples. The two controls, one positive and one negative control, used per easyMAG extraction were programmed to occupy the first two wells in the first easyMAG sample cassettes and the plasma samples were programmed to be pipetted into the subsequent wells. Rack 1 and 2 were designated to the samples used in extraction 1 and rack 3 and 4 were designated for extraction 2. Program P3 was developed as a PCR preparation program (post-elution) with distribution of master mix and pipetting of eluates from separate archive plates to one common 96-well microtiter PCR plate. In P3 the contents from up to four 96-well microtiter archive plates, i.e. a total of four easyMAG extractions, can be pipetted onto one 96-well microtiter PCR plate for the LightCycler 480 PCR analysis.
Initially the basics of the programs were programmed to yield functional pipetting procedures without any optimization of user function. Thereafter, the four programs were individually fine-tuned and constantly improved to include more details and functions for improved use. Automated scanning of sample tubes with the PosID-3 (which simultaneously counts the number of samples) and manual scanning of easyMAG cassettes and 96-well plates with a hand scanner to improve traceability were introduced. In conjuncture with the introduction of the manual scanning procedures vast controls of the scanned labware were introduced to minimize the possibility for scanning errors. This included the introduction of user prompts to alert the laboratory personnel of correct or incorrect scanning or scanning order. Thereafter, all programs were consecutively linked to each other by introducing an export of variables at the end of programs P1, P1_secpool and P2, and subsequent import of variables from the preceding program based on the scanned labware. This implies that either P1 or P1_secpool has to be run in order to execute P2, and P1/P1_secpool and P2 have to be executed to run P3. Furthermore, the scrips were altered to provide result files from each program run where all scanned labware and pipetting movements are included.
Each programmed script was first tested in the EVOsim simulator to detect, and subsequently correct, major programming errors. Thereafter, each program was tested with tap water and caramel color. During these tests minor errors were sought and corrected and the pipetted
11 (93) volumes were visually controlled by aspirating the dispensed volumes with manual pipettes. After the water based test had been performed new liquid classes were created in the EVOware based on templates and previously entered liquid classes. Liquid classes for plasma, eluate and master mix were optimized to improve the pipetting. The accuracy of the pipetting within each liquid class was thereafter visually controlled by aspirating the Tecan-dispensed liquids with a manual pipette. In the eluate and master mix liquid classes the liquid detection feature was turned off due to the small volumes used in the analysis and the aspiration of liquid was set to occur from the bottom of these wells instead of at the liquid surface. The plasma liquid class was extensively altered to enable correct function of the liquid level detection and after the initial experiments and the first experiment for the Probit analysis the liquid class was altered once more by lowering the submerge depth of the pipette tips from 2 mm under the surface to 1 mm and by neutralizing the calibration factor by setting it to 1 so no additional liquid other than the specified volume would be pipetted and subsequently discarded. In conjunction with the plasma based experiments the programs were further corrected of any remaining errors.
4.2 Experimental procedures
The developed programs were tested and compared to the established manual procedures to ensure correct pipetting and function of the programs in general. After the tests of the Tecan based automated procedure, an experiment investigating a dilution series for a following Probit analysis was performed to find the proper interval for the statistical analysis. Finally, three experiments were performed as a foundation for the statistical Probit analysis and based on these results a method sensitivity was determined. For all experiments separate protocols were produced that were filled in during the experiments which were subsequently archived. Experimental summaries for the laboratory procedures were written and uploaded in a specific program, FileMaker, for easy access.
4.2.1 HEV analysis method
1.4 mL 2D Data-Matrix coded pushcap tubes containing 700 µl HEV in-house standard positive control “Pos Q795” (75 IU/mL), 1.4 mL 2D Data-Matrix coded pushcap tubes with 700 µl internal control “IC-A” (Bovine Viral Diarrhea Virus: 0.5*105.5 TCID50, Porcine Parvo Virus: 0.5*105 TCID50) and 1.4 mL 2D Data-Matrix coded pushcap tubes with negative control (aliquoted negative plasma, confirmed as negative for hepatitis A virus, hepatitis B virus, hepatitis C virus, hepatitis E virus, HIV-1 and parvovirus B19) were thawed in a biological safety cabinet. The thawed samples were thereafter vortexed with a shaker to remove potential clots and spun down in a low speed micro centrifuge to collect the material at the bottom of the
12 (93) tube. From the positive controls two additional dilutions were manually prepared in a biological safety cabinet to yield three different concentrations that were tested in the experiment: Pos Q795 diluted 1:1, Pos Q795 diluted 1:3 and Pos Q795 diluted 1:5. For the 1:3 dilution 10 mL negative plasma that had been thawed overnight in a refrigerator and subsequently vortexed was pipetted into a clearly labeled 15 mL Falcon tube and then 5 mL positive control was pipetted into the same labeled tube. The 1:5 dilution was prepared according to the same procedure with 12 mL negative plasma and 3 mL positive control. The finished dilutions were thereafter vortexed to properly mix the contents.
In a biological safety cabinet, 20 µl IC-A was manually added to each well in the easyMAG cassettes with a dispensing pipette. The sample dilutions were vortexed and thereafter the specific volumes of sample and negative control stated in Table 1 were manually pipetted into their respectively designated wells in the easyMAG sample cassette according to a predetermined order. A duplicate of the sample layout was created in a second set of easyMAG sample cassettes.
Table 1: Sample and control volumes for the easyMAG extraction for the different sample types.
Sample/control Volume (µl)
96-pool 600
R-pool 600
C-pool 480
Confirmation test 100 Positive and negative controls 600
The sample cassettes were thereafter transferred to two separate NucliSens easyMAG instruments and a 10 minutes long on board lysis program was started that utilized a lysis buffer containing > 50% guanidine thiocyanate and > 1% Triton X-100 to lyse the cells. During the lysis silica for the extraction was manually prepared with a programmed multichannel pipette in a biological safety cabinet. 550 µl room temperate DNase/RNase free water was added to a tube with 600 µl magnetic silica which was subsequently vortexed until homogenized. 125 µl of the diluted silica was thereafter pipetted into 8 separate wells in a microtiter plate and once the lysis was finished 100 µl silica was transferred from the microtiter plate to the wells in the sample cassettes. The sample volume was then set to 0.600 mL (or 0.480 mL for C-pools or 0.100 mL for confirmation tests) in the easyMAG software and the eluate volume was set to 25 µl. The two separate extractions were thereafter run with the Generic 2.0.1 protocol where extraction buffers 1, 2, and 3 were used. After the extraction a pipette programmed to aspirate
13 (93) and dispense 38 µl was used to transfer the 25 µl eluates from the sample cassettes into one clearly labeled 96-well microtiter archive plate and the plate was subsequently covered with an adhesive seal. The archive plate was then stored at +2 to +8 °C.
After the manual procedure the laboratory steps were repeated in an automated fashion. Tubes with HEV positive control Q795, IC-A and negative control were thawed in a biological safety cabinet and were thereafter vortexed and centrifuged. The previously prepared dilutions were vortexed and 700 µl (or 480 µl for C-pools or 100 µl for confirmation samples) of each dilution and of the negative controls were pipetted in a predetermined order into separate and labeled 3 ml cryotubes that were placed in the carrier tube holders called Rack 1-4. Two negative controls and one IC-A per easyMAG extraction were placed at their specified locations in the mutual carrier tube holder and their lids were removed with a pincer. New easyMAG sample cassettes were placed in the easyMAG carriers. The three different carrier types were placed in the Tecan EVO Freedom 150 instrument and program P1 (or P1_secpool for secondary pooling and confirmation samples) was started. The laboratory robot preceded to scan the sample tubes in Rack 1-4 and then, based on the instructions in the program, the easyMAG sample cassettes were manually scanned with a hand scanner. After the scanning, the automated pipetting was initiated by accepting a user prompt. First 20 µl IC-A was dispensed into the easyMAG sample cassette wells, thereafter the two negative controls were pipetted from the 2D Data-Matrix coded pushcap tubes into the two first wells in the sample cassette. The volume stated in Table 1 was thereafter pipetted from the samples in Rack 1-4 to the following empty wells in the sample cassette. After the program had finished the sample cassettes were transferred to the easyMAG instrument where lysis, silica preparation, silica addition and the extraction were performed as in the manual procedure. After the extraction the sample cassettes were placed in the second cassette carrier in the Tecan instrument and one 96-well microtiter archive plate per extraction were placed in refrigerated Tecan-cooling blocks that were placed on the microtiter plate carrier. Program P2 was started and the instructions for scanning of easyMAG sample cassettes and 96-well archive plates were followed. The pipetting was thereafter initiated after accepting a user prompt. In the program, the 25 µl eluates were pipetted from the sample cassettes into the archive plates by aspirating and dispensing 30 µl eluate to ensure that all eluate was properly transferred. After the program run the archive plates were covered with an adhesive seal and were stored at +2 to +8 °C.
Two separate master mixes, one for the automated procedure and one for the manual procedure, were prepared simultaneously according to Table 2 in two 2 mL polypropylene tubes. Each
14 (93) master mix was prepared for approximately 5-10 more samples than the actual sample number as a safety margin. The reagents were thawed in a cooling block in a refrigerator and after the betaine had been vortexed and the TaqMan Fast Virus 1-Step Master Mix (TAQ 1-step mix (4x)) had been gently inverted all reagents were the spun down in a low speed micro centrifuge. Just before pipetting the TaqMan enzyme and the primers and probes the reagents were gently mixed with a pipette. The finished master mixes were vortexed 2 times for 2 seconds and were thereafter spun down to collect all material in the bottom of the tubes. The master mixes were kept cool and protected from light until the PCR preparation.
Table 2: Recipe for the master mix.
Reagent Volume per sample (µl) Concentration in PCR reaction
DNase/RNase free water 5.8 N/A
TAQ 1-step mix (4x) 5.0 1x
Betaine 3.0 0.75
HEV primer and probe mix • Forward primer • Reverse primer • Probe 1 • Probe 2 1.0 300 nM 500 nM 300 nM 300 nM BVDV primer and probe mix
• Forward primer • Reverse primer • Probe 1 0.20 60 nM 60 nM 30 nM
The first step of the PCR preparation was to centrifuge the archive plates at 3000 rpm for 1 second in order to concentrate the eluates at the bottom of the wells. Thereafter the eluates from the automated procedure and an empty 96-well microtiter PCR plate were placed in refrigerated Tecan-cooling blocks positioned on their designated places on the microtiter plate carrier (Figure 3). The master mix was spun down in a low speed micro centrifuge and was subsequently manually mixed with a pipette of suitable size to homogenize the solution and was placed in the designated carrier tube rack. Program P3 was started and the programmed instructions for scanning of archive plates and PCR plate were followed. The pipetting was started by accepting a user prompt after correct scanning of the labware. 15 µl master mix were dispensed by the Tecan instrument in the designated wells and thereafter 5 µl of the eluates were aspirated from the archive plates and were subsequently dispensed into the wells of the PCR plate. Directly after the automated PCR preparation the PCR plate was transferred to a
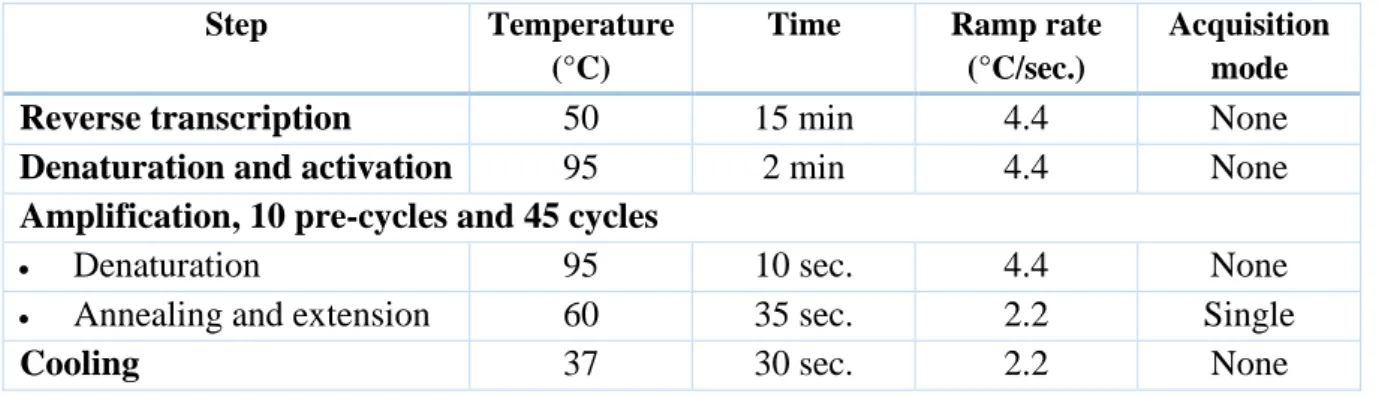
15 (93) refrigerated cooling block in a biological safety cabinet for the manual PCR preparation. The master mix was spun down in a low speed micro centrifuge and was thereafter mixed with a pipette of suitable size to homogenize the solution. 15 µl master mix was added to the designated wells in the PCR plate with a dispensing pipette and thereafter 5 µl cold eluate was transferred from the archive plates to the PCR plate with a multichannel pipette. The plate was thoroughly sealed with adhesive film and was centrifuged in an Eppendorf centrifuge 5430 at 3000 rpm for 2 minutes. The RT-PCR was thereafter run according to Table 3 in a Roche LightCycler 480 instrument. The results from the PCR were obtained with the LightCycler 480 software (version 1.5.1) where modules for the HEV analysis and the IC analysis were automatically created with the color compensation file Universal CC
FAM(510)-Yellow555(580).
Table 3: PCR layout for the HEV LightCycler 480 amplification.
Step Temperature
(°C)
Time Ramp rate (°C/sec.)
Acquisition mode
Reverse transcription 50 15 min 4.4 None
Denaturation and activation 95 2 min 4.4 None
Amplification, 10 pre-cycles and 45 cycles
• Denaturation 95 10 sec. 4.4 None • Annealing and extension 60 35 sec. 2.2 Single
Cooling 37 30 sec. 2.2 None
4.2.1.1 Experimental layouts
Five different experiments were performed in order to test the developed pipetting programs and each experiment suffered from slight alterations from the general experimental procedure in section 4.2.1. In experiment 1 separate dilutions of Pos Q795 were created for the manual and the automated procedures. In this experimental setup the two 1:3 dilutions were each prepared in labeled 15 mL Falcon tubes from 6 mL thawed negative plasma and 3 mL positive control Pos Q795. The 1:5 dilutions were prepared by pipetting 8 mL thawed negative plasma and 2 mL positive control Pos Q795 into labeled 15 mL Falcon tubes. The dilutions for the manual procedure were prepared prior to the sample addition in easyMAG sample cassettes and the dilutions for the automated procedure were prepared before the addition of sample into 3 mL cryotubes placed in Rack 1-4. Additionally, in this experiment 1000 µl of samples were manually pipetted into the 3 mL cryotubes instead of 700 µl for the automated procedure. A third deviation from the stated protocol in experiment 1 was that the eluates were not concentrated at the bottom of the archive plate wells by centrifugation at 3000 rpm for 1 second.
16 (93) Experiment 2 was performed after supplementary changes of the dispensing speed in the eluate liquid class, an alteration of the submerge depth for the plasma liquid class to allow 700 µl as sample volume and other minor programming improvements such as removal of redundant washing steps of the pipettes that were discovered in experiment 1. The only deviation from the experimental protocol in experiment 2 was that the archive plates were not centrifuged at 3000 rpm for 1 second in order to concentrate the eluates at the bottom of the wells.
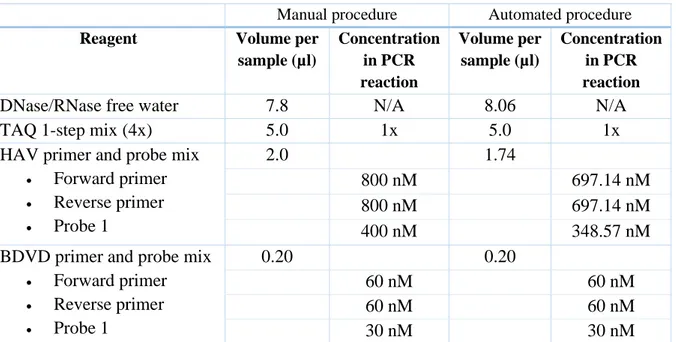
Experiment 3 was performed with HAV instead of HEV as a response to the inadequate results obtained from previous HEV runs. HAV positive control Pos Q675 (78 IU/mL) was used instead of HEV positive control Pos Q795 in all samples and dilutions. Due to the change of positive control an alteration of the reagents in the master mix was required. The master mixes for the manual and automated procedures were prepared according to Table 4 where less HAV primer and probe mix was used for the automated procedure because of reagent shortage. The final alteration in experiment 3 was that the 96-well PCR plate was vortexed prior to the 2 minute centrifugation at 3000 rpm in order to homogenize the TAQ 1-step mix (4x).
Table 4: Master mix recipe for experiment 3 with HAV.
Manual procedure Automated procedure Reagent Volume per
sample (µl) Concentration in PCR reaction Volume per sample (µl) Concentration in PCR reaction
DNase/RNase free water 7.8 N/A 8.06 N/A TAQ 1-step mix (4x) 5.0 1x 5.0 1x HAV primer and probe mix
• Forward primer • Reverse primer • Probe 1 2.0 1.74 800 nM 697.14 nM 800 nM 697.14 nM 400 nM 348.57 nM
BDVD primer and probe mix • Forward primer • Reverse primer • Probe 1 0.20 0.20 60 nM 60 nM 60 nM 60 nM 30 nM 30 nM
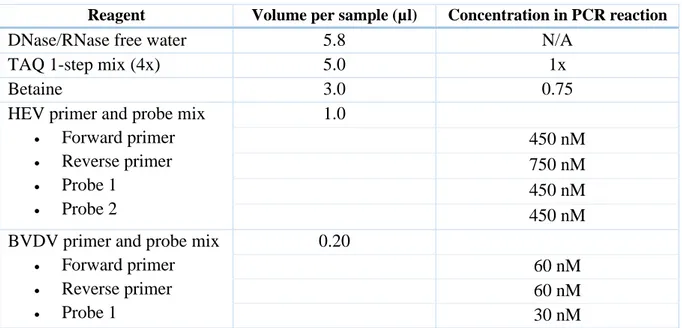
Experiment 4 and experiment 5 were used to test the developed program P1_secpool together with P2 and P3 for simulated HEV R-pools, C-pools and confirmation test samples. In these experiments the 96-well PCR plate was also vortexed before the 2 minute centrifugation at 3000 rpm to homogenize the TAQ 1-step mix (4x). Experiment 5 only included master mix preparation, PCR preparation and a PCR run and was developed as an experiment to test a new set of HEV primers and probes in the master mix. The recipe for the master mix used in
17 (93) experiment 5 is presented in Table 5. The fifth experiment was carried out with the eluates from experiment 4.
Table 5: Master mix recipe for the new set of HEV primers and probes.
Reagent Volume per sample (µl) Concentration in PCR reaction
DNase/RNase free water 5.8 N/A
TAQ 1-step mix (4x) 5.0 1x
Betaine 3.0 0.75
HEV primer and probe mix • Forward primer • Reverse primer • Probe 1 • Probe 2 1.0 450 nM 750 nM 450 nM 450 nM BVDV primer and probe mix
• Forward primer • Reverse primer • Probe 1 0.20 60 nM 60 nM 30 nM 4.2.2 Method evaluation
The programs developed for 96-pool HEV analysis were evaluated in a statistical Probit analysis based on three equivalent experiments performed on three separate days in order to estimate the method sensitivity. The experiments were performed according to the instructions for the HEV method but HAV was utilized instead of HEV due to the unstable results acquired by the HEV method. Before the experiments for the Probit analysis were performed a preparative investigation of a suggested ½-log dilution series was performed to locate the proper concentration interval.
4.2.2.1 Preparative investigation of dilution series
For the preparative investigation, four 1.4 mL 2D Data-Matrix coded pushcap tubes containing 700 µl HAV in-house standard positive control “Pos Q675” (78 IU/mL) and one 1.4 mL 2D Data-Matrix coded pushcap tube of 700 µl internal control “IC-A” were thawed in a biological safety cabinet. The thawed samples were vortexed with a shaker to remove clots and spun down in a low speed micro centrifuge to collect the material at the bottom of the tube. The positive controls and negative plasma, which had been thawed overnight in a refrigerator, were used to prepare a ½-log dilution series according to Table 6.
18 (93)
Table 6: Dilution series used in the preparative investigation. The Pos Q675 50 IU/mL sample was prepared from positive controls Pos Q675 (78 IU/mL) and the remaining samples were prepared from the preceding dilution.
Sample Volume positive sample from preceding dilution (mL) Negative plasma (mL) Total volume (mL) Final concentration (IU/mL) Pos Q675 50 IU/mL 2.564 1.436 4 50.00 Pos Q675 15.8 IU/mL 1.265 2.735 4 15.81 Pos Q675 5 IU/mL 1.265 2.735 4 5.00 Pos Q675 1.6 IU/mL 1.265 2.735 4 1.58 Pos Q675 0.5 IU/mL 1.265 2.735 4 0.50
20 µl IC-A was manually added to the wells of three easyMAG sample cassettes and 600 µl of vortexed negative plasma and of each vortexed dilution were dispensed into the wells. Four replicates of each sample type were dispensed in a predetermined order. The sample cassettes were transferred to a NucliSens easyMAG extraction instrument and the lysis was started. Silica was prepared and distributed into the sample cassettes after the lysis. The extraction was run with the Generic 2.0.1 protocol and the sample and eluate volume were set to 0.600 mL and 25 µl respectively. After the extraction the eluates were manually pipetted from the sample cassette into a labeled 96-well archive plate which was subsequently covered with an adhesive seal and stored at +2 to +8 °C. A master mix was prepared in one 2 mL polypropylene tube according to Table 7.
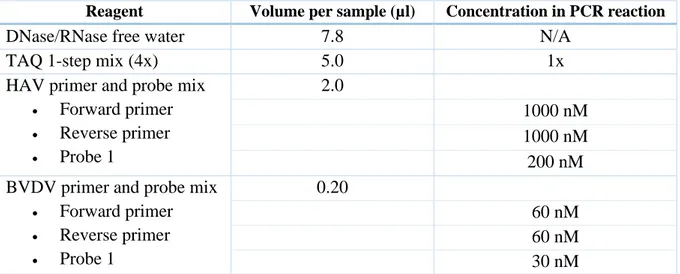
Table 7: Recipe for master mix with HAV primers and probes.
Reagent Volume per sample (µl) Concentration in PCR reaction
DNase/RNase free water 7.8 N/A
TAQ 1-step mix (4x) 5.0 1x
HAV primer and probe mix • Forward primer • Reverse primer • Probe 1 2.0 1000 nM 1000 nM 200 nM BVDV primer and probe mix
• Forward primer • Reverse primer • Probe 1 0.20 60 nM 60 nM 30 nM
The archive plate was centrifuged at 3000 rpm for 1 second to concentrate the eluates at the bottom of the wells. The master mix was spun down in a low speed micro centrifuge and was
19 (93) manually mixed with a pipette of suitable size to homogenize the mix. 15 µl master mix was dispensed into the designated wells of the 96-well PCR plate placed in a cooling block and 5 µl of each eluate was pipetted from the archive plate to the PCR plate. The PCR plate was sealed and centrifuged (2 minutes, 3000 rpm) and thereafter the PCR was started (program according to Table 3). The amplification results were thereafter obtained in the LightCycler 480 software.
4.2.2.2 Probit evaluation
The statistical Probit analysis was based on three equivalent experimental procedures where both the manual and the automated processes were evaluated.
In each experiment four 1.4 mL 2D Data-Matrix coded pushcap tubes of 700 µl HAV in-house standard positive control “Pos Q675” (78 IU/mL), two 1.4 mL 2D Data-Matrix coded pushcap tubes of 700 µl internal control “IC-A” and eight 1.4 mL 2D Data-Matrix coded pushcap tubes of negative controls were thawed in a biological safety cabinet. The thawed, vortexed and spun down positive controls and thawed and vortexed negative plasma were used to create a ½-log dilution series according to Table 8.
Table 8: Dilution series for used in the experiments for the Probit analysis. The Pos Q675 20 IU/mL sample was prepared from positive controls Pos Q675 (78 IU/mL) and the remaining samples were prepared from the preceding dilution.
Sample Volume positive sample from preceding dilution (mL) Negative plasma (mL) Total volume (mL) Final concentration (IU/mL) Pos Q675 20 IU/mL 2051 5949 8 20.00 Pos Q675 6.32 IU/mL 2530 5470 8 6.32 Pos Q675 2 IU/mL 2530 5470 8 2.00 Pos Q675 0.63 IU/mL 2530 5470 8 0.63 Pos Q675 0.2 IU/mL 2530 5470 8 0.20
Two of the negative controls were manually pipetted into 3 mL cryotubes and 700 µl of the dilutions were manually pipetted into four 3 mL cryotubes each and were placed in Tecan carrier tube rack 1 and 2 as a preparation for the automated procedure. Thereafter, the manual procedure was performed by dispensing 20 µl IC-A into three easyMAG sample cassettes. 600 µl negative control were dispensed in four wells in the sample cassette and 600 µl of each dilution were pipetted into four wells each (resulting in a total of 24 occupied wells). The sample cassettes were transferred to the easyMAG instrument and the extraction procedure was performed according to the HEV method in section 4.2.1. During the extraction the automated procedure was started. The 3 mL cryotubes were individually vortexed, their lids removed and
20 (93) the racks were placed in the Tecan instrument. The two remaining negative controls and the IC-A were placed in their allocated positions in the tube rack and three easyMIC-AG sample cassettes were placed in their specified positions. The lids of the controls were removed, the rack was placed in the Tecan instrument and program P1 was started. Thereafter, the sample cassettes were transferred to the easyMAG instrument and the extraction procedure was executed as described in section 4.2.1.The sample cassettes were subsequently transferred to the Tecan instrument where the eluates were transferred into one archive plate in program P2. The archive plate was sealed and stored at +2 to +8 °C.
A master mix for all 48 samples was prepared in one 2 mL polypropylene tube according to Table 7 and its contents were then split into two separate 2 mL polypropylene tubes (one for the automated procedure and one for the manual procedure).
The two archive plates were centrifuged (3000 rpm, 1 second) to concentrate the eluates at the bottom of the wells and the archive plate for the automated procedure was placed in a cooling block in the Tecan instrument. The master mix for the automated procedure was spun down and manually mixed with a pipette before it was inserted into the master mix rack and program P3 was started. After the automated PCR preparation the PCR plate was transferred to a cooling block in a biological safety cabinet and 15 µl spun down and mixed master mix was added to the designated wells. 5 µl of the eluates were added from the archive plate for the manual procedure and the PCR plate was sealed and centrifuged before the PCR was started according to the program in Table 3. The results from the experiments were obtained in the LightCycler 480 software.
The 12 acquired data points for each dilution in the ½-log dilution series in the manual procedure were used to calculate the manual method sensitivity in a half statistical Probit analysis using CombiStats (version 5.0) and the 12 obtained data points for the automated procedure were used to calculate the method sensitivity for the automated procedure in another half statistical Probit analysis. The combined results with 24 data points for each dilution were thereafter used to calculate a method sensitivity for the TaqMan based HAV analysis in a full statistical Probit analysis.
21 (93)
5. Results
The programs that were developed were named P1, P1_secpool, P2 and P3 and the complete scripts for all the programs are included in Appendix C.
5.1 Comparative tests of programs for the HEV method
5.1.1 Test of automation for 96-pools
The programs P1, P2 and P3 for the HEV method at 96-pool level were tested in three separate experiments that are summarized in Table 9. In experiment 1 the manual procedure show predominantly better results than the automated procedure. The Roche LightCycler 480 software detected 19 of 24 positive samples for the manual procedure and 9 of 24 positive samples for the automated procedure. Furthermore, in the automated procedure one of the internal controls was not approved. Experiment 2 was performed after some adjustments in EVOware regarding the liquid classes. After these adjustments the automated procedure resulted in detection of 13 of 24 positive samples and the manual procedure led to the detection of 16 of 24 positive samples. In experiment 3 where HAV was used both procedures led to the detection of all positive samples.
The amplification curves for experiment 1-3 are presented in Figure 4, Figure 5 and Figure 6 respectively. In Figure 4 and Figure 5, where HEV positive samples and HEV primers and probes have been used, three types of curves are present. These curves are differently classified by the Roche LightCycler 480 software, where the red curves are deemed as positive, the blue curves are judged as uncertain and the green curves are judged as negative. Regardless of the negative assessment multiple of the green curves in Figure 4 and Figure 5 exhibit signs of amplification. Additionally, the majority of the curves in Figure 4 and Figure 5 have an unsteady and wobbly character. In experiment 3 HAV was used instead of HEV and in these amplifications (Figure 6) all samples have all been judged as either positive or completely negative by the software. In addition, these curves exhibit a more stable appearance compared to previous experiments.
Positive and uncertain curves are assigned a crossing point (CP) value together with the measured fluorescence. The calculations of CP mean, fluorescence mean and the number of positive samples in Table 9 are based on these positive and uncertain curves and the negative results have been excluded from the calculations.
22 (93)
Table 9: Summary of the results from the three experimental procedures performed to investigate the automated pipetting procedure of the HEV method. The crossing point (CP) values and fluorescence have been calculated based on samples that have been deemed “positive” or “uncertain” by the Roche LightCycler 480 software.
Automated procedure Manual procedure
CP mean Fluorescence mean Number of positive samples CP mean Fluorescence mean Number of positive samples Ex p er im en t 1 Pos Q795 1:1 24.31 16.28 7/8 25.21 19.46 8/8 Pos Q795 1:3 25.39 13.71 2/8 25.52 12.48 7/8
Pos Q795 1:5 N/A N/A 0/8 25.53 14.85 4/8
Internal control 16.45 4.96 27/28 16.69 5.45 28/28 Ex p er im en t 2 Pos Q795 1:1 25.01 20.49 8/8 25.34 24.87 8/8 Pos Q795 1:3 25.55 11.53 2/8 25.92 15.02 4/8 Pos Q795 1:5 25.16 13.79 3/8 25.80 14.25 4/8 Internal control 17.33 4.61 28/28 17.53 5.24 28/28 Ex p er im en t 3 Pos Q675 1:1 23.78 47.29 8/8 23.48 53.03 8/8 Pos Q675 1:3 24.70 37.48 8/8 24.49 37.13 8/8 Pos Q675 1:5 25.14 35.39 8/8 25.05 39.21 8/8 Internal control 13.60 7.03 28/28 13.51 6.84 28/28
Figure 4: Amplification curves from experiment 1. The two topmost diagrams are from the manual procedures and the two bottom diagrams are the results from the automated procedures.
23 (93)
Figure 5: Amplification curves from experiment 2. The two topmost diagrams are from the manual procedures and the two bottom diagrams derive from the automated procedures.
Figure 6: Amplification curves from experiment 3 where HAV has been used instead of HEV. The two upper diagrams are the results from the manual procedures and the two bottom diagrams are from the automated procedures.
24 (93)
5.1.2 Test of automation for secondary pooling
The program for secondary pooling, P1_secpool, was tested together with programs P2 and P3. The results from these experiments (experiment 3 and experiment 4) are presented in Table 10. The calculations of CP mean, fluorescence mean and the number of positive samples in the table are based on the positive and uncertain amplification curves and any negative results have been excluded from the calculations.
In experiment 4 the manual procedure led to the detection of 11 of 36 positive samples and the automated procedure led to the detection of 12 of 36 positive samples. In experiment 5 the manual procedure gave 28 of 36 positive samples and the automated procedure gave 27 of 36 positive samples. The manual and automated procedures thus provide similar results in this matter. In experiment 5 a different set of HEV primers and probes have been used compared to previous experiments, including experiment 1 and experiment 2. The change of primers and probes greatly improved the viral detection of the same eluates.
The amplification curves corresponding to experiment 4 and experiment 5 are presented in Figure 7 and Figure 8. In addition to the improvement of the number of detected positive samples in experiment 5 the amplification curves are generally more smooth and the general shape of the curves are better.
25 (93)
Table 10: Summary of the results from the two experimental procedures performed to investigate the automated pipetting procedure for the secondary pooling of the HEV method. The crossing point (CP) values and fluorescence have been calculated based on samples that have been deemed “positive” or “uncertain” by the Roche LightCycler 480 software. In the table the word confirmation tests have been shortened to Conf.
Automated procedure Manual procedure
CP mean Fluorescence mean Number of positive samples CP mean Fluorescence mean Number of positive samples Ex p er im en t 4 Pos Q795 1:1 R-pools 24.32 16.53 3/4 24.32 19.60 3/4 Pos Q795 1:1 C-pools 24.04 12.10 3/4 24.51 16.13 3/4 Pos Q795 1:1 Conf. 26.31 14.25 3/4 26.72 24.79 3/4 Pos Q795 1:3 R-pools 23.97 15.53 1/4 24.68 11.89 1/4
Pos Q795 1:3 C-pools N/A N/A 0/4 N/A N/A 0/4
Pos Q795 1:3 Conf. 25.91 12.96 2/4 N/A N/A 0/4
Pos Q795 1:5 R-pools N/A N/A 0/4 N/A N/A 0/4
Pos Q795 1:5 C-pools N/A N/A 0/4 N/A N/A 0/4
Pos Q795 1:5 Conf. N/A N/A 0/4 27.30 13.35 1/4
Internal control 16.22 5.89 40/40 16.68 5.66 40/40 Ex p er im en t 5 Pos Q795 1:1 R-pools 25.73 33.37 4/4 25.67 33.79 4/4 Pos Q795 1:1 C-pools 25.55 30.88 4/4 25.72 24.34 4/4 Pos Q795 1:1 Conf. 29.81 28.52 2/4 29.15 27.32 4/4 Pos Q795 1:3 R-pools 26.48 19.82 4/4 26.29 17.58 4/4 Pos Q795 1:3 C-pools 26.60 20.51 4/4 27.37 24.69 3/4 Pos Q795 1:3 Conf. 29.07 16.76 2/4 28.45 31.19 2/4 Pos Q795 1:5 R-pools 26.70 19.08 3/4 26.10 15.15 3/4 Pos Q795 1:5 C-pools 26.59 17.38 3/4 26.40 21.09 3/4 Pos Q795 1:5 Conf. 29.10 26.76 1/4 29.61 9.70 1/4 Internal control 16.76 4.18 40/40 17.00 4.28 40/40
26 (93)
Figure 7: Amplification curves from experiment 4. The two upper diagrams are the results from the manual procedures and the two bottom diagrams are the results from the automated procedures.
Figure 8: Amplification curves from experiment 5 where a new set of HEV primers and probes have been tested. The two upper diagrams are the results from the manual procedures and the two bottom diagrams are the results from the automated procedures.
27 (93)
5.2 Probit evaluation
The results from the preparative investigation of the dilution series in Table 6 are presented in Table 11 and in Figure 9. All samples with the concentrations 5 IU/mL and above were detected and for the lowest concentration level of 0.5 IU/mL 4 out of 8 positive samples were identified. None of the concentrations led to the detection of 0 positive samples that is required for an effective Probit analysis.
Table 11: Summary of the results from the manually performed preparative investigation of the dilution series for the Probit analysis. The crossing point (CP) values and fluorescence have been calculated based on samples that have been deemed “positive” by the Roche LightCycler 480 software.
Sample CP mean Fluorescence mean Number of positive
samples Pos Q675 50 IU/mL 23.56 26.10 8/8 Pos Q675 15.8 IU/mL 24.61 17.69 8/8 Pos Q675 5 IU/mL 25.64 12.15 8/8 Pos Q675 1.6 IU/mL 26.35 8.66 6/8 Pos Q675 0.5 IU/mL 26.39 6.35 4/8 Internal control 13.05 7.16 48/48
Figure 9: Amplification curves from the preparative experiment for the Probit analysis.
The amplification results from the three separate experiments used in the Probit analysis are summarized in Table 12 and the amplification curves are displayed in Figure 10, Figure 11, and Figure 12. The experimental results show similar values for the CP mean and the fluorescence mean for the automated and manual procedures and the amplification curves for the different procedures exhibit concordance.
28 (93)
Table 12: Summary of the results from the Probit analysis with HAV. The crossing point (CP) values and fluorescence have been calculated based on samples that have been deemed “positive” by the Roche LightCycler 480 software.
Automated procedure Manual procedure
CP mean Fluorescence mean Number of positive samples CP mean Fluorescence mean Number of positive samples Pro b it e x p er im en t 1 Pos Q675 20 IU/mL 24.21 20.93 4/4 25.35 23.32 4/4 Pos Q675 6.32 IU/mL 25.41 11.84 4/4 25.85 17.53 4/4 Pos Q675 2 IU/mL 26.03 9.25 4/4 27.29 12.35 2/4 Pos Q675 0.63 IU/mL 25.34 7.43 3/4 28.09 7.16 1/4 Pos Q675 0.2 IU/mL NA NA 0/4 26.98 15.10 1/4 Internal control 12.43 3.24 24/24 12.74 3.45 24/24 Pro b it e x p er im en t 2 Pos Q675 20 IU/mL 24.03 20.91 4/4 24.52 21.00 4/4 Pos Q675 6.32 IU/mL 24.96 12.98 4/4 25.61 11.36 4/4 Pos Q675 2 IU/mL 25.31 13.28 3/4 26.10 10.54 4/4 Pos Q675 0.63 IU/mL 26.75 3.73 1/4 26.33 8.39 2/4 Pos Q675 0.2 IU/mL NA NA 0/4 NA NA 0/4 Internal control 12.41 3.26 24/24 12.55 3.36 24/24 Pro b it e x p er im en t 3 Pos Q675 20 IU/mL 24.01 19.87 4/4 24.72 23.05 4/4 Pos Q675 6.32 IU/mL 24.72 15.50 4/4 25.58 16.07 4/4 Pos Q675 2 IU/mL 25.84 8.92 4/4 26.57 10.90 4/4 Pos Q675 0.63 IU/mL NA NA 0/4 26.57 7.87 1/4 Pos Q675 0.2 IU/mL NA NA 0/4 NA NA 0/4 Internal control 12.39 3.17 24/24 12.60 3.28 24/24
Table 13 shows the number of positive samples per concentration. The number of positive samples decreases for the lower concentrations in a stepwise manner and for the lowest concentration of 0.2 IU/mL only 1 of 24 samples results in viral detection.
Table 13: Summary of the number of positive samples for each concentration in the Probit experiments. The results are calculated for the automated procedure, the manual procedure and for the combination of both procedures.
Sample Number of positive samples (automated procedure) Number of positive samples (manual procedure) Number of positive samples (combined results) Pos Q675 20 IU/mL 12/12 12/12 24/24 Pos Q675 6.32 IU/mL 12/12 12/12 24/24 Pos Q675 2 IU/mL 11/12 10/12 21/24 Pos Q675 0.63 IU/mL 4/12 4/12 8/24 Pos Q675 0.2 IU/mL 0/12 1/12 1/24
29 (93)
Figure 10: Amplification curves from Probit experiment 1. The left diagram derives from the manual procedure and the right diagram is the result from the automated procedure.
Figure 11: Amplification curves from Probit experiment 2. The left diagram derives from the manual procedure and the right diagram is the result from the automated procedure.
Figure 12: Amplification curves from Probit experiment 3. The left diagram derives from the manual procedure and the right diagram is the result from the automated procedure.
30 (93) The results of the Probit analysis calculated for the automated procedure, the manual procedure and for the method in general by a combination of the two procedures are summarized in Table 14. The method sensitivity for the HAV method based on the combined laboratory experiments was calculated to approximately 3 IU/mL and the overall lowest method sensitivity was achieved for the automated procedure.
Table 14: Results from the Probit calculations for the automated procedure, the manual procedure and for the combined results. Automated procedure (IU/mL) Manual procedure (IU/mL) Combined results (IU/mL) IU/ED95 2.23 3.61 2.93 Confidence interval 1.43 – 7.49 2.02 – 13.73 1.96 – 6.00
6. Discussion
In this project four different pipetting programs corresponding to manual pipetting steps in the HEV PCR analysis method of human plasma have been developed, tested and evaluated. Experiment 1 in Table 9 was the first comparative test of the Tecan-based automated pipetting procedure and the manual pipetting procedure for the HEV method. The results in Table 9 and Figure 4 indicate that in the first trial the viral detection of the automated procedure was inferior to the manual procedure. A probable cause for this occurrence is that in program 2 the eluates were dispensed into the archive plates with too high speed which resulted in a visibly notable splash of the eluate, which consequently led to a loss of eluate and a risk of contamination. Furthermore, after the eluate transfer to the archive plate no attempt to concentrate the eluates into the bottom of the wells by centrifugation was performed. As a consequence it is possible that a lower amount of eluate than 5µl was transferred to the PCR plate in program 3, thus leading to the substandard result. Additionally, there may have been differences in the separate dilutions prepared for the different procedures that could have contributed to the results. Experiment 2 in Table 9 was performed after some additional programming adjustments and updates of the eluate and plasma liquid classes in the Tecan instrument, and in general the results for the automated procedure were improved compared to the results in experiment 1. Unfortunately, both the manual and automated HEV analyses in experiment 1 and experiment 2 show inconsistent results and the appearance of green curves, i.e. negative results according to the Roche software, with a noteworthy increase in fluorescence was a common occurrence which indicates that there is something amiss with the current HEV method and that it needs to be improved. Experiment 3 in Table 9 was therefore performed with HAV instead of HEV to
31 (93) investigate the difference between the methods. Due to a reagent shortage the master mix for the automated procedure contained a slightly lower concentration of HAV primers and probes than the master mix for the manual procedure, approximately 700 nM compared to 800 nM, which could be a possible contributing factor to the slightly lower fluorescence signals detected in the automated procedure. In this experiment the results were vastly improved compared to in the HEV analysis, all samples containing any concentration of virus were judged as positive by the Roche LightCycler 480 software and the graphs for the different extractions manifested a good concordance. The only difference between the HEV analysis and the HAV analysis are the positive control and the master mix. It is therefore possible to conclude that the inferior results obtained by the HEV method are not a result of improper or malfunctioning extractions or PCR amplifications.
Experiment 4 and 5 were performed to investigate the program P1_secpool for simulated C-pools, R-pools and confirmation tests. Normally the viral concentrations are higher in R- and C- pools and confirmation test samples compared to in the 96-pool since the single donations become less diluted. In this experiment the concentrations remained the same as in previous experiments but the volumes for C-pools and confirmation test samples were lower which can explain why only a few low concentration samples were detected. Despite this, the experiment indicates that the manual and automated procedures are more or less tantamount. In experiment 4 and 5 an additional vortex of the 96-well microtiter PCR plate was added before the 2 minute 3000 rpm centrifugation. Compared to the results in experiment 1 and 2 no obvious improvement from this additional step could be observed. On the contrary, in experiment 4 fewer samples that had a sample volume of 600 µl were judged as positive by the LightCycler 480 software and it is possible that the additional vortex could have been damaging for the sensitive primers and probes. This argument is however not entirely credible since the finished master mix is vortexed in another step of the laboratory procedure. Additionally, the layout of experiment 1 and 2 differ from the experimental layout for experiment 4 and 5 and therefore no definite conclusions can be made regarding this step. The tests of P1_secpool for the secondary pooling also included HEV analysis with two different master mixes to further investigate the poor results obtained by the HEV method. The second mix contained a second set of HEV and IC primer and probe reagents that were not yet approved for official use in the department at the time of the experiment. The viral detection was visibly improved with the new reagents where more viral samples were judged as positive by the Roche software and the curves exhibit a more smooth form. Even though the shape of the curves was improved with the new master
32 (93) mix they are still shaky compared to the results in experiment 3 where HAV was analyzed. The differences resulting from the use of different master mixes and by using HAV indicate that the current problem with the HEV method probably is related to the primers and probes. The concentration of HEV primers and probes in the two master mixes differ and the improvement from mix 2 may only be due to the altered concentrations rather than the new batch of primers and probes. One possibility is therefore that the reagents manufactured by the current distributer are of a lower quality than the reagents used in the method development.
As a result of the current problems with the HEV method the Probit evaluation was performed with the HAV method. This was judged to be the wisest manner of investigating the automated procedure compared to the manual procedure as the reagents in the HEV method introduces an aspect of ambiguity that could be a confounding factor in any given results. Additionally the statistical analysis of the automated procedure was only performed with program P1, P2 and P3 developed for analysis of 96-pools. Program P1_secpool was not included in any statistical evaluations since the secondary pooling is only an additional part of the HEV method and the statistical evaluation of developed methods rarely includes tests of the secondary pooling procedure. Furthermore, the program was originally not intended to be included in the project, but was developed as an extra supplement.
In the preparative experiment a ½-log dilution series of positive in-house standard, Pos Q675, in the range from 50 IU/mL to 0.5 IU/mL was tested. The objective of this experiment was to find an appropriate concentration range for the Probit analysis by finding a concentration where no virus is detected in the analysis. Zero viral detection was not achieved in this experiment where 4 of 8 positive samples were detected in the 0.5 IU/mL concentration samples which demonstrated that an even lower concentration was required. Based on these results another ½-log dilution series of in-house standard, Pos Q675, in the range from 20 IU/mL to 0.2 IU/mL was used in the experiments for the Probit analysis. This concentration was appropriate for the Probit analysis and only 1 of 24 positive samples was detected at 0.2 IU/mL.
The Probit analysis of the combined results from Probit experiment 1-3 revealed an astonishing method sensitivity of 2.93 IU/mL for the HAV method. The achieved sensitivity of 2.93 IU/mL is a proper improvement compared to the method sensitivity of the current method which is 26 IU/mL. The half Probit analyses of the automated and manual procedures resulted in a better method sensitivity for the automated procedure (2.23 IU/mL) than for the manual procedure (3.61 IU/mL) which indicates that the automation was successful. Both procedures also demonstrated similar fluorescence intervals for the amplified samples which shows that the
33 (93) fluorescence signal was not altered by the automated process. These results therefore demonstrate that the TaqMan based HAV method is superior to the current method and that the automated process provides reliable results.
An error in the accuracy of the pipetting was introduced after Probit experiment 1 by the altered settings for the plasma liquid class. With these altered settings the dispensed volume was approximately 550-580 µl instead of the desired 600 µl. The changes were made to allow pipetting of 600 µl from a sample volume of 700 µl without receiving error messages concerning the liquid level detection which states that the sample volume is insufficient. This error in volume was not observed until after the completion of the Probit analysis and therefore the two final experiments in the Probit analysis of the automated procedure were performed with less sample volume than what was used in the manual procedure. Despite this, the results from the Probit analysis demonstrate a slightly better sensitivity for the automated procedure than for the manual procedure. The probable cause for the pipetting error is the changes that were made regarding the calibration settings since the calibration factor is used to aspirate some extra volume from the sample tube to ensure an absolutely correct dispensing volume. A future possibility is to once more add a calibration factor and increase the sample volume to 800 µl. The larger sample volume would allow for a proper calibration factor and thus a correct pipetting volume whilst receiving less or no errors concerning the liquid level detection. With a larger sample volume the submerge depth of the pipette tips could also be altered to approximately 2 mm instead of the current 1 mm to avoid pipetting of potential foam at the top of the samples. However, in order to get a larger sample volume for the analysis, this change needs to be implemented in the preceding pooling procedure which is performed by another department.
In the automated procedure the eluates and master mix were pipetted from the bottom of their corresponding wells since the liquid level detection was turned off. The liquid level detection was turned off because the eluate volumes are very small and because of the small extra reaction volume present in the master mix tube, which compromises the ability of the liquid level detection. This has no impact on the pipetting accuracy and the only consequence of this action is that the pipette tips are lowered deeper into the liquid, which could result in remaining liquid on the pipette tips after aspiration. This is preferably avoided with the handling of plasma samples and other potentially reactive or contaminating materials but for the pipetting of master mix no real contamination of the labware by the pipetted material can occur since the same master mix is distributed into all of the different wells. The risk of contamination by the pipetted