March 2008
EDR 08-05
Department of Agricultural and Resource Economics, Fort Collins, CO 80523-1172
http:/ /d are.colostate.edu /pubsBACKGROUND
Chaffee County’s location in Colorado’s cen-tral mountains, along with its abundant natural resources including the Arkansas River and 15 of Colorado’s 54 “fourteeners” (14,000 foot peaks) have led to increased tourism to the area in recent years. Much of the tourism in the area is related to outdoor recreation including activities such as whitewater raft-ing, fishraft-ing, off-road vehicle (jeep and ATV) recrea-tion, and hiking. This recent growth in tourism, com-bined with substantial population growth has led to increased development pressure in the area.
Private land use in Chaffee County has histori-cally been centered on ranching and farming, with around 71 percent of private land in agricultural uses. These ranchlands or “working landscapes” can provide aesthetic benefits that may be enjoyed by residents of the county as well as tourists. This study was under-taken to provide information on the value that visitors to Chaffee County place on the natural resources in the area, specifically the local working landscapes and local water quality in the upper Arkansas River. This is a companion study to a similar report addressing the values that residents place on natural resources in Chaffee County (Cline and Seidl 2008).
This report provides a profile of the type of tourist that visits Chaffee County in the summer
months based on survey data. In addition to demo-graphic information, we also present an overview of the activities and expenditures of tourists during their visit.Finally, we analyze information provided by visi-tors about how their behavior might change with increased urbanization and decreased water quality as well as what they might be willing to pay to help pro-tect these resources.
VISITOR SURVEY
The sample population for the visitor survey was tourists visiting Chaffee County during the sum-mer of 2007. The survey was conducted during the summer since most Chaffee County tourists visit in the summer (a previous study found 86% of tourists vis-ited in the summer months) (Leisure Trends Group 2006). In addition, many of the popular outdoor recrea-tion activities that draw visitors to the area, such as whitewater rafting, fishing and hiking, are undertaken primarily in the summer.
In order to reach a diverse sample of tourists, visitors were contacted on seven alternating weekends throughout the summer at various places throughout the county, including locations in Buena Vista and Salida. The survey method was a combination in-person and mail/Internet survey. Visitors were con-tacted in person and asked to take part in the survey.
VALUING CHAFFEE COUNTY’S WORKING LANDSCAPES AND WATER QUALITY: AN ANALYSIS OF SUMMER TOURISTS
If they agreed to participate, they were provided with a survey packet that could be returned by mail (which included a cover letter, the questionnaire and a self-addressed stamped envelope) or a card describing the project and explaining how to fill out the survey on-line. The survey type was alternated among respon-dents to ensure that the same number of each type was distributed, and that the survey type received was ran-dom among the survey respondents.
Paper surveys were distributed to 446 individu-als and Internet survey cards were distributed to 456 individuals, for a total of 902 surveys distributed. A total of 219 paper surveys were returned for a response rate of 49 percent. The response rate for the Internet surveys was somewhat lower, with 158 surveys filled out for a response rate of 35 percent. Overall, 377 sur-veys were returned for a total response rate of 42 per-cent. When on-site refusals are included, the overall response rate falls to 36 percent.
SURVEY RESULTS
Demographics
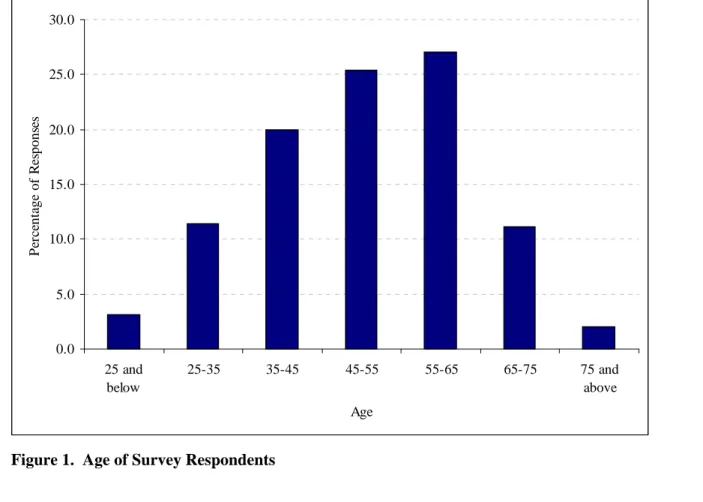
The average age of survey respondents was 52 years. Individuals between 55 and 65 years of age made up the largest age group, with 27 percent of the respon-
dents (Figure 1). Respondents between 45 - 55 and 35- 45 also made up a large portion of the sample, mak-ing up 25 and 20 percent of the sample, respectively. These results were similar to a previous study of visi-tors to Chaffee County that found an average age of 50 (Leisure Trends Group 2006). Respondents were fairly evenly split by gender, with males accounting for a slightly higher percentage of the total sample at 52 per-cent, compared to 48 percent for females. The sample of this survey had a higher percentage of female respondents than the previous visitor survey, in which males made up 65 percent of the sample (Leisure Trends Group 2006).
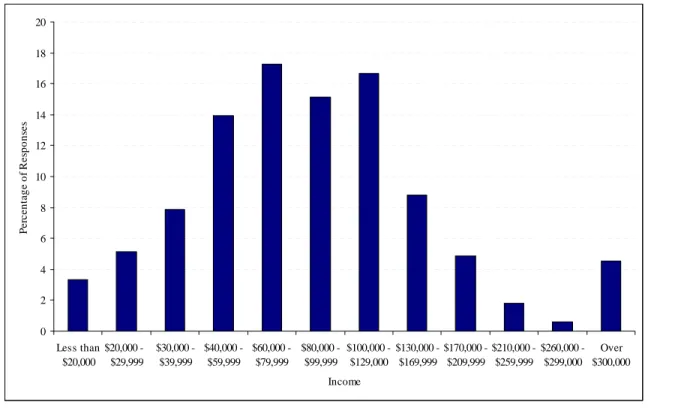
Most of the respondents were employed at the time of the survey, with 68 percent of all respondents indicating that they were employed. Retirees also made up a fairly large portion of total respondents, at 25 per-cent. The remaining categories, unemployed individuals and those who work in the home made up the remaining 7 percent of respondents (Figure 2). Survey respondents tended to be in the middle-income range. Most respon-dents reported an income between $40,000 and $130,000, with 14 percent between $40,000 and $59,999, 17 percent between $60,000 and $79,999, 15 percent between $80,000 and $99,999, and 17 percent between $100,000 and $129,999 (Figure 3).
0.0 5.0 10.0 15.0 20.0 25.0 30.0 25 and below 25-35 35-45 45-55 55-65 65-75 75 and above Age P er ce n ta ge o f R es p on se s
Figure 1. Age of Survey Respondents
Unemployed Work in Home
Employed
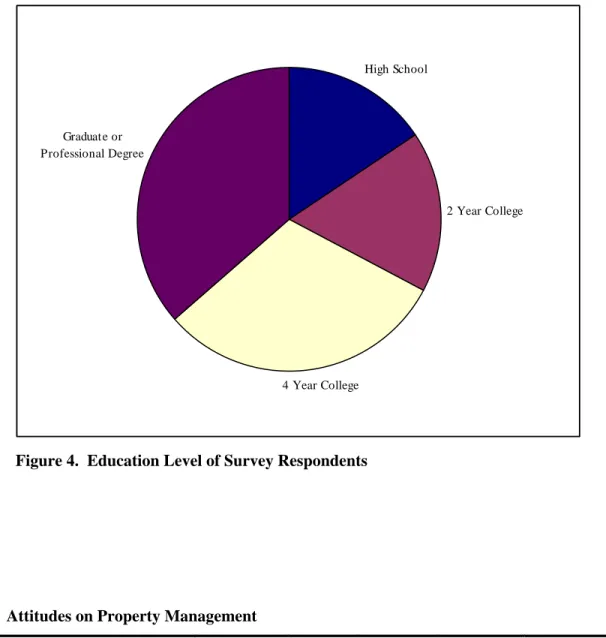
Individuals responding to the survey were also highly educated. Thirty-six percent of respondents re-ported having a graduate or professional degree, while another 31 percent have a Bachelor’s degree. A similar proportion of respondents reported finishing high school (16 percent) or a 2 year college degree (17 per-cent). No respondents reported having less than a high school education. These results were very similar to the education levels found in a 2006 survey of visitors, where 69 percent of respondents had a college degree or higher (Leisure Trends Group 2006).
Attitudes
Several questions were included on the survey regarding visitor’s attitudes about property ownership and the environment. Since the open space variable is specifically addressing privately-owned working land-scapes, respondent’s attitudes about property owner-ship may help to provide additional insights into their willingness to pay for this resource. Visitors to the area were asked four questions related to their attitudes on property management. The first two questions dealt with rights of individuals to do anything they want with their land. The first statement said “I should be able to do anything I want with my land”. Overall, most
respondents disagreed with this question, with 49.57 percent of individuals stating that they disagreed or strongly disagreed to the statement (Table 1). A similar response was found to the statement “My neighbors should be able to do anything they want to with their land”, with 53.01 percent choosing disagree or strongly disagree. The remaining questions related to property management addressed attitudes about management and property values. Respondents tended to agree that prop-erty values depend in part on their neighbor’s manage-ment, and that neighbors should consider each other’s property values when making management decisions. In response to the statement that “My property values depend in part on my neighbor’s property management” 94.57 percent of respondents agreed or strongly agreed, while 91.41 percent of respondents agreed or strongly agreed to the statement “Neighbors need to consider each other’s property values when managing their prop-erty”.
In addition to the questions about attitudes on property management, several statements were presented to examine the respondent’s attitudes about the environ-ment. These statements were adapted from the New Environmental Paradigm (NEP), a commonly used set of
0 2 4 6 8 10 12 14 16 18 20 Less than $20,000 $20,000 - $29,999 $30,000 -$39,999 $40,000 -$59,999 $60,000 -$79,999 $80,000 -$99,999 $100,000 -$129,000 $130,000 -$169,999 $170,000 -$209,999 $210,000 -$259,999 $260,000 -$299,000 Over $300,000 Income P e rc e n ta ge of R e sp on se s
High School
2 Year College
4 Year College Graduate or
Professional Degree
Figure 4. Education Level of Survey Respondents
Strongly
agree
Agree Neutral Disagree Strongly
disagree
Not
Sure
I should be able to do anything
I want to with my land
9.17 22.92
17.48 34.67
14.90 0.86
My neighbors should be able
to do anything they want to
with their land
8.02 22.35
15.76 34.67
18.34 0.86
My property values depend in
part on my neighbor’s
property management
42.57
52.00
2.57 1.71 0.57 0.57
Neighbors need to consider
each other’s property values
when managing their property
44.13
47.28
5.44 2.01 0.57 0.57
statements utilized to measure environmental attitudes. In general, the responses tended to show
pro-environment attitudes. The first two statements had a large percentage of support from respondents, with 52 percent strongly agreeing with the statement “The bal-ance of nature is very delicate and easily upset by hu-man activities” and 41 percent strongly agreeing with the statement “Plants and animals have as much right as humans to exist”. The remaining three statements are stated in such a way that disagreeing responses would indicate positive environmental attitudes. The majority of respondents disagreed with the statement “Modify- ing the environment for human use seldom causes seri-ous problems”, with 45 percent choosing disagree and an additional 34 percent choosing strongly disagree. Thirty-nine percent of respondents strongly disagreed with the statement “There are no limits for growth for nations like the United States”, and another 35 percent disagreed with the statement. The final statement, “Humankind was created to rule over the rest of nature”, also had a significant negative response, with 38 percent of respondents choosing strongly disagree and another 24 percent choosing disagree.
Trip Information
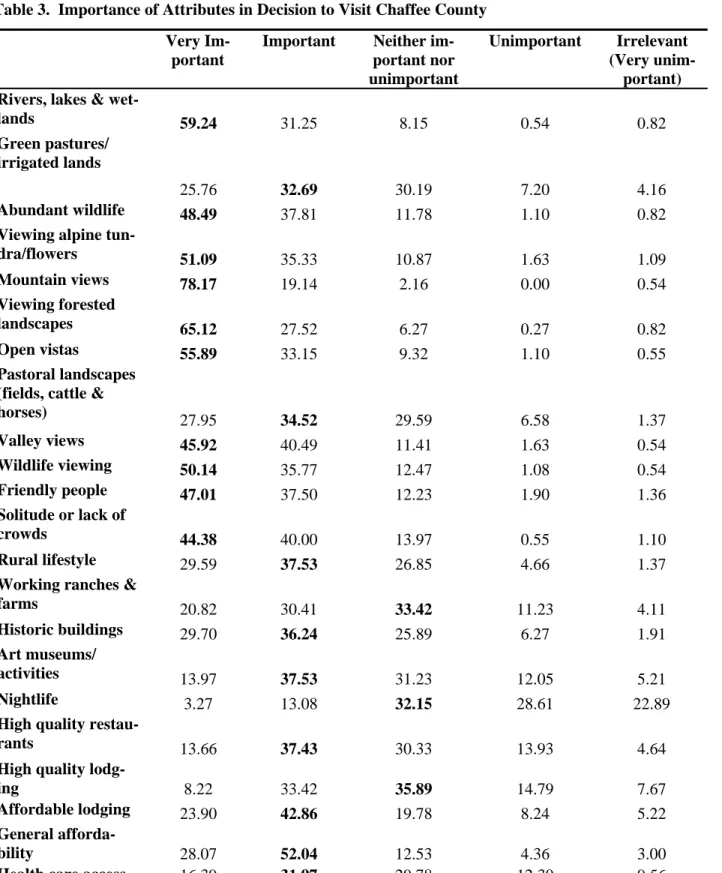
In addition to collecting information about the demographics and attitudes of respondents, detailed information was collected about the respondent’s trip to the area, including the importance of various attributes and activities as well as trip expenditures. The first question provided a series of different natural and
human attributes and asked respondents to rank how im-portant each attribute was to their decision to visit Chaf-fee County. Importance was ranked on a five-point scale ranging from very important to irrelevant. Many of the natural attributes listed were ranked as the most impor-tant, with mountain views (78 percent), viewing forested landscapes (65 percent), and rivers, lakes and wetlands (59 percent) having the largest percentage of respondents choosing very important (Table 3). Several other natural attributes were ranked as very important by a large per-centage of respondents. Open vistas (56 percent), viewing alpine tundra/flowers (51 percent), wildlife viewing (50 percent), abundant wildlife (48 percent), and valley views (46 percent) were all rated as very important by the larg-est percentage of respondents. The attributes related more to agriculture were generally ranked as somewhat less important by most respondents. Green pastures/irrigated lands, pastoral landscapes and rural lifestyle were all ranked as important by the largest percentage of respon-dents, while working farms and ranches were ranked as neither important nor unimportant by the largest percent-age of respondents.
Human attributes tended to be ranked as less important by the majority of respondents. Among these attributes, friendly people and solitude were ranked as the most important, with 47 and 44 percent of respon-dents, respectively, ranking these attributes as very important. Cultural attributes tend to be ranked some-what lower than natural attributes, with historic build-ings and art museums ranked as important by the largest
Strongly
agree
Agree Neutral
Disagree Strongly
disagree
Not
Sure
The balance of nature is very
delicate and easily upset by human
activities 52.29
36.29 6.29 4.00 0.86 0.29
Plants and animals have as much
right as humans to exist
41.03
36.18 10.26 8.83 1.99 1.71
Modifying the environment for
human use seldom causes serious
problems
3.70 5.98 10.83 45.01
34.19 0.28
There are no limits for growth for
nations like the United States
2.30 9.48 10.06 35.06 39.08
4.02
Humankind was created to rule
over the rest of nature
8.55 16.52 11.11 24.22 38.46
1.14
Very Im-portant
Important Neither im-portant nor unimportant
Unimportant Irrelevant (Very
unim-portant) Rivers, lakes &
wet-lands 59.24 31.25 8.15 0.54 0.82 Green pastures/
irrigated lands
25.76 32.69 30.19 7.20 4.16
Abundant wildlife 48.49 37.81 11.78 1.10 0.82 Viewing alpine
tun-dra/flowers 51.09 35.33 10.87 1.63 1.09 Mountain views 78.17 19.14 2.16 0.00 0.54 Viewing forested landscapes 65.12 27.52 6.27 0.27 0.82 Open vistas 55.89 33.15 9.32 1.10 0.55 Pastoral landscapes
(fields, cattle &
horses) 27.95 34.52 29.59 6.58 1.37 Valley views 45.92 40.49 11.41 1.63 0.54 Wildlife viewing 50.14 35.77 12.47 1.08 0.54 Friendly people 47.01 37.50 12.23 1.90 1.36 Solitude or lack of crowds 44.38 40.00 13.97 0.55 1.10 Rural lifestyle 29.59 37.53 26.85 4.66 1.37 Working ranches &
farms 20.82 30.41 33.42 11.23 4.11 Historic buildings 29.70 36.24 25.89 6.27 1.91 Art museums/
activities 13.97 37.53 31.23 12.05 5.21 Nightlife 3.27 13.08 32.15 28.61 22.89 High quality
restau-rants 13.66 37.43 30.33 13.93 4.64 High quality
lodg-ing 8.22 33.42 35.89 14.79 7.67
Affordable lodging 23.90 42.86 19.78 8.24 5.22 General
afforda-bility 28.07 52.04 12.53 4.36 3.00
Health care access 16.39 31.97 29.78 12.30 9.56
percentage of respondents. Affordability ranks higher than quality when considering lodging for the majority of respondents. Forty-three percent of respondents ranked affordable lodging as important, while 36 per-cent of respondents ranked high quality lodging as nei-ther important nor unimportant. General affordability was ranked as important by 52 percent of respondents. Restaurants and nightlife were less important to most respondents than many other attributes, with 37 percent of respondents considering high quality restaurants as important, and 32 percent of respondents ranking night-life as neither important nor unimportant.
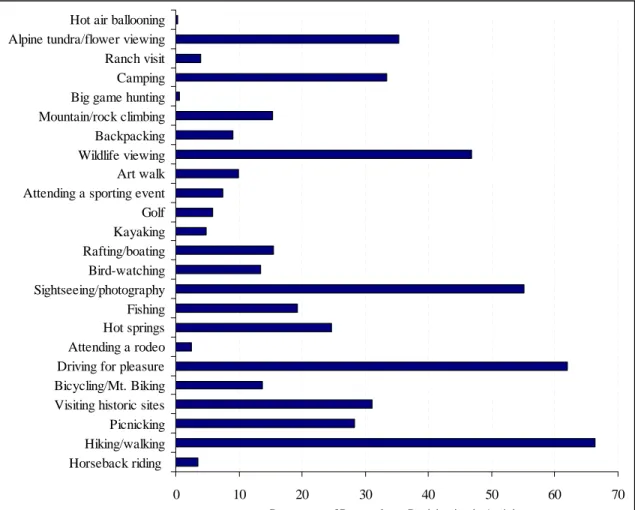
Respondents were also asked to select the activities that they participated in during their most recent trip to Chaffee County. As shown in Figure 5, the most common activities included hiking and walk-ing, driving for pleasure, sightseeing and photography, wildlife viewing, camping, and alpine tundra and flower viewing. Other activities that were selected by a large number of respondents included picnicking, visit-ing historic sites, govisit-ing to hot sprvisit-ings, and fishvisit-ing.
Survey respondents were also asked the number of trips they have taken to Chaffee County in the past year. Most respondents made a relatively low number of trips, with an average of 6 trips in the past year over the entire sample. The majority of respondents had only made one trip to Chaffee County in the past year, with 47 percent of the respondents stating that they had made one trip. Seventy-eight percent of respondents had spent 14 days or less in Chaffee County over the past year, with an average of 14 days across the sample.
Respondents were also asked about the character-istics of their current trip to Chaffee County. Approxi-mately 25 percent of the respondents were taking a day trip to Chaffee County (spending 24 hours or less in the county), while another 22 percent were weekend visitors (spending less than three days but more than one day in the county). The majority of visitors were spending a week or less in the county, with 84 percent of all respon-dents staying 7 days or less. Most visitors were traveling in small groups, with 56 percent of respondents traveling in a group of two or by themselves. The remaining
0 10 20 30 40 50 60 70
Horseback riding Hiking/walking Picnicking Visiting historic sites Bicycling/Mt. Biking Driving for pleasure Attending a rodeo Hot springs Fishing Sightseeing/photography Bird-watching Rafting/boating Kayaking Golf Attending a sporting event Art walk Wildlife viewing Backpacking Mountain/rock climbing Big game hunting Camping Ranch visit Alpine tundra/flower viewing Hot air ballooning
Percentage of Respondents Participating in Activity
respondents were also traveling in relatively small groups with 91 percent of all respondents traveling in a group of six or fewer people.
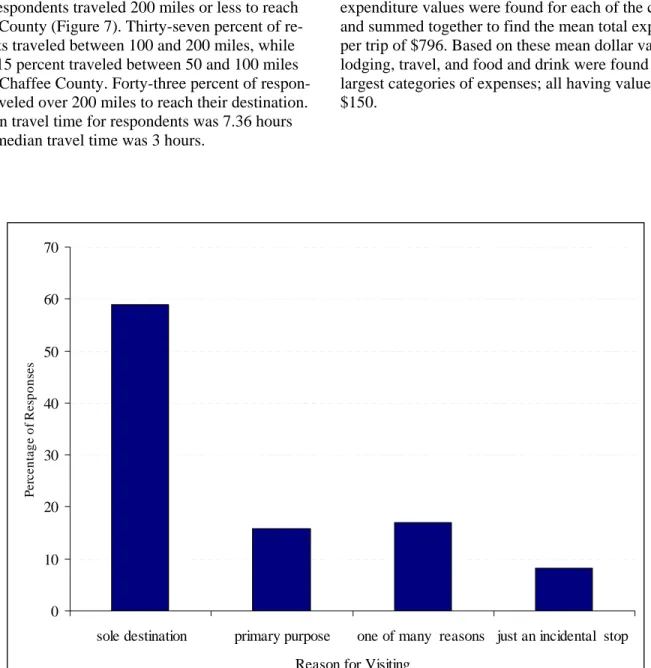
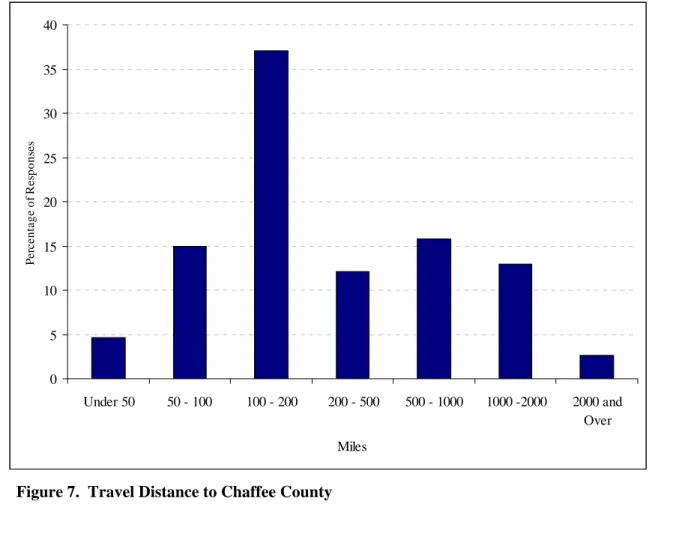
Most respondents stated that Chaffee County was their sole destination (Figure 6). Fifty-nine percent of all respondents said Chaffee County was their sole destination, 16 percent said visiting Chaffee County was the primary purpose of their trip, 17 percent said it was one of many equally important reasons for their trip, and 8 percent of respondents said it was just an incidental stop on a trip to another destination. Most survey respondents traveled 200 miles or less to reach Chaffee County (Figure 7). Thirty-seven percent of re-spondents traveled between 100 and 200 miles, while another 15 percent traveled between 50 and 100 miles to reach Chaffee County. Forty-three percent of respon-dents traveled over 200 miles to reach their destination. The mean travel time for respondents was 7.36 hours and the median travel time was 3 hours.
In order to help assess the economic impact of tourists in Chaffee County, survey respondents were asked about their expenditures while in Chaffee County. They were asked to provide their estimated expenditures during the trip for several different categories including travel, lodging, food and drink, outdoor recreation fees, other retail purchases and gifts, and other expenditures not specifically mentioned in another category. The visi-tors were asked to provide the total amount spent in each category during their entire trip for themselves or their group. Total expenditures per group for the entire trip are shown in the second column of Table 4. The mean expenditure values were found for each of the categories and summed together to find the mean total expenditures per trip of $796. Based on these mean dollar values, lodging, travel, and food and drink were found to be the largest categories of expenses; all having values over $150. 0 10 20 30 40 50 60 70
sole destination primary purpose one of many reasons just an incidental stop Reason for Visiting
P e rc e n ta ge of R e spons e s
The total expenditure data was then used along with other information collected (the number of people in the group and the number of days spent on the trip) to calculate the amount spent per person for the entire trip, and the amount spent per person per trip day (shown in columns 3 and 4 of Table 4). When calcu-lated as expenditures per person, lodging was again
the biggest expense at an average of $86 per person, followed by food and drink at approximately $84, and travel at $80. Total per person expenditures were found to be around $386 per trip. When expenditures are calculated on a daily basis, tourists are found to spend around $111 per day on average, of which $30 is spent on travel, $28 on food and drink,$19 on
0 5 10 15 20 25 30 35 40 Under 50 50 - 100 100 - 200 200 - 500 500 - 1000 1000 -2000 2000 and Over Miles P e rc e n ta ge o f R e sp ons e s
Figure 7. Travel Distance to Chaffee County
Per Group Per Trip
Per Person Per Trip
Per Person Per Trip Day
Expenditure Category (Mean Value) (Mean Value) (Mean Value)
Travel expenses $165.64 $79.99 $30.15
Lodging $182.68 $86.27 $19.13
Food and Drink $163.67 $83.58 $28.39
Outdoor recreation fees $63.35 $25.68 $7.92
Other retail purchases/gifts $131.72 $64.72 $17.03
Other $88.64 $45.74 $8.00
Total (of mean values) $795.70 $385.98 $110.62
lodging, $17 on retail purchases/gifts, and the remain-ing $16 was spent on outdoor recreation fees and other items.
Willingness to Pay and Contingent Behavior In order to determine what might happen to tourism if conditions in Chaffee County were to
change, respondents were asked several questions about how their visitation and expenditures might change with changes in various aspects of their visit. Respon-dents were asked about increased costs as well as spe-cific changes in the natural environment. The first change addressed is how the respondent’s behavior would change if the costs of their trip were to change due to increases in travel costs, such as gasoline and related expenses. Respondents were asked if they would still have made the visit to Chaffee County if their expenses were to increase by a given amount. The bid amounts were randomly selected bid from among 12 different alternatives ($1, $5, $10, $25, $50, $75, $100, $150, $200, $300, $400, and $500). The percent-age of respondents stating that they would still visit with the price increase declined with larger increases in price (Figure 8). Bid values between $1 and $50 had over 90 percent of respondents stating that they would still visit, the percentage that would still visit declines with values over $50, to the lowest percentage agree-ment of 28 percent for the $500 bid.
Local Working Landscapes
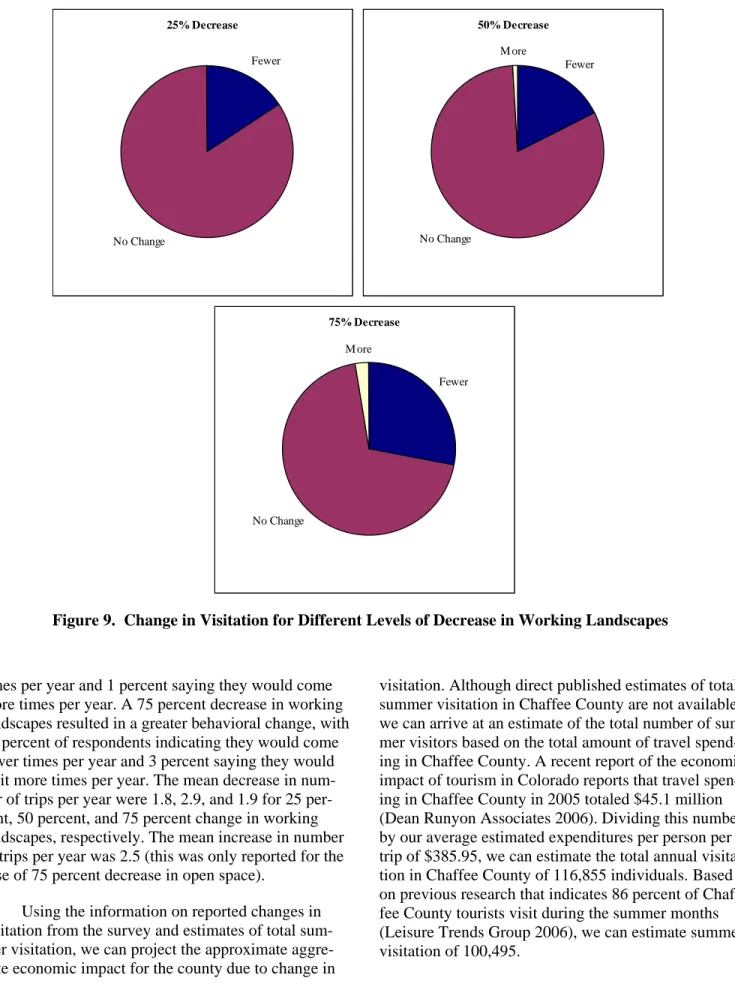
In order to determine how a decrease in the amount of ranchlands would affect tourists’ trips to Chaffee County, respondents were asked how their visi-tation might change if current ranchlands were converted to more urban uses. First, respondents were presented with a description of the current situation in the county and a definition of working landscapes. They were then presented with a scenario that described a situation in which the amount of local working landscapes decreased but local water quality remained the same. The surveys were randomly assigned one of three different levels of decrease in working landscapes, 25 percent, 50 percent, and 75 percent, in order to see how different levels of change would impact the responses. Based on the sce-nario presented to them, the respondents were asked how the number of trips taken per year would change given the change in land use. If they stated that they would make more or fewer trips, they were asked by how many trips their behavior would change. Figure 9 shows the responses for the different levels of land use change. With a 25 percent decrease in working landscapes, only 16 percent of respondents indicated that they would visit Chaffee County fewer times per year, and no one indi-cated that this change would result in more visits per year. The results were very similar for the scenario with a 50 percent decrease in working landscapes, with 17 percent of respondents stating they would come fewer
0 10 20 30 40 50 60 70 80 90 100 1 5 10 25 50 75 100 150 200 300 400 500 Increase in Costs ($) P er ce n ta g e tha t w o ul d s til l v is it
times per year and 1 percent saying they would come more times per year. A 75 percent decrease in working landscapes resulted in a greater behavioral change, with 28 percent of respondents indicating they would come fewer times per year and 3 percent saying they would visit more times per year. The mean decrease in num-ber of trips per year were 1.8, 2.9, and 1.9 for 25 per-cent, 50 perper-cent, and 75 percent change in working landscapes, respectively. The mean increase in number of trips per year was 2.5 (this was only reported for the case of 75 percent decrease in open space).
Using the information on reported changes in visitation from the survey and estimates of total sum-mer visitation, we can project the approximate aggre-gate economic impact for the county due to change in
visitation. Although direct published estimates of total summer visitation in Chaffee County are not available, we can arrive at an estimate of the total number of sum-mer visitors based on the total amount of travel spend-ing in Chaffee County. A recent report of the economic impact of tourism in Colorado reports that travel spend-ing in Chaffee County in 2005 totaled $45.1 million (Dean Runyon Associates 2006). Dividing this number by our average estimated expenditures per person per trip of $385.95, we can estimate the total annual visita-tion in Chaffee County of 116,855 individuals.Based on previous research that indicates 86 percent of Chaf-fee County tourists visit during the summer months (Leisure Trends Group 2006), we can estimate summer visitation of 100,495. 25% Decrease Fewer No Change 50% Decrease Fewer No Change M ore 75% Decrease Fewer No Change M ore
We can then project the local average eco-nomic impact of change in visitation by multiplying the mean change in expenditures per trip day by the total estimated number of summer visitors. Using the mean projected change in visitation (number of trips) and the percentage of tourists indicating that they would change their current level of visitation as shown in Table 5, we can calculate the average economic impact for the esti-mated number of summer visitors for the various levels of change in open space. We obtain an average aggre-gate economic impact of $3.77 million across all three levels of change in open space, with values ranging from $1.87 million for a 25 percent decrease in work-ing landscapes to approximately $7.1 million for a 75 percent decrease.
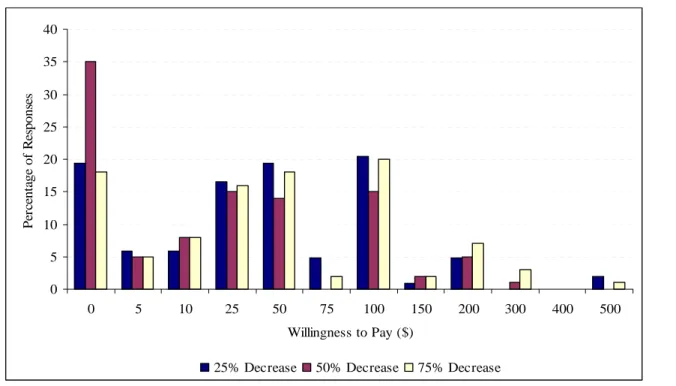
In addition to the question asking if the individ-ual’s visitation would change with a change in the amount of local working landscapes, another question was asked to determine their willingness to pay to avoid the quality change. This question followed the question about behavior change and asked respondents to state their willingness to pay to avoid the decrease in working landscapes if they stated they would visit less often or the same amount with the land use change. Respondents were provided 12 different dollar amounts ($0, $5, $10, $25, $50, $75, $100, $150, $200, $300, $400, and $500) and asked to choose the one that revealed the maximum increase in total costs per per-son per trip they would be willing to pay to ensure that the scenario described did not occur. Figure 10 shows the percentage of respondents that chose each amount for the three different levels of land use change. The
mean willingness to pay value for a 25 percent decrease in local working landscape area is $59.61, $42.80 for a 50 percent decrease, and $66.55 for a 75 percent decrease.
Using the estimate of summer visitors to Chaffee County described previously, we can extrapolate the will-ingness to pay values to total visitor population. Using the combined average mean willingness to pay for all three options (25, 50 and 75 percent decrease) of $56.00, we can estimate a total willingness to pay for the entire tourist population of $5.6 million. Calculating the total willingness to pay for the three different mean values, we see a range from approximately $4.3 million to $6.7 mil-lion (Table 6). One should note that these estimates should be viewed as a lower bound estimate of the total willingness to pay since the mean willingness to pay val-ues reported are per trip valval-ues. The estimates reported here are assuming one trip per individual.
Water Quality
A second scenario was presented to respondents that had a change in water quality with no change in local working landscapes, in order to determine the impact of potential changes in water quality on visitors’ behavior. Water quality was described using three cate-gories based on the type of activity that is safe in that quality of water. The three categories include swimma-ble water which is safe to swim in and ingest in small amounts, fishable water which is sufficient quality for trout and other game fish to survive but not safe for swimming, and boatable water which is safe for boating and sailing but not for swimming or fishing (Figure 11).
Change in Working Landscape Area
25%
50%
75%
Average
Mean Change in Visitation (Days)
1.05
1.09
2.28
1.7
Mean Expenditures per Trip Day
$ 110.62
$ 110.62
$ 110.62
$ 110.62
Decrease in Expenditures per Person
$ 116.15
$ 120.58
$ 252.21
$ 184.74
Percentage of Visitors Changing
Visits
16% 17% 28% 20%
Total Visitors
100,495 100,495 100,495 100,495
Aggregate Economic Impact
$1,867,615 $2,059,935 $7,096,938 $3,774,880
Table 5. Aggregate Economic Impact from Change in Visitation due to a Decrease in Working Landscapes
0 5 10 15 20 25 30 35 40 0 5 10 25 50 75 100 150 200 300 400 500 Willingness to Pay ($) P er ce n ta ge of R es p ons es
25% Decrease 50% Decrease 75% Decrease
Figure 10. Visitors’ Willingness to Pay to Avoid a Decrease in Local Working Landscapes
Change in Level of Working Landscapes
25% 50% 75% Average
Mean WTP $ 59.61 $ 42.80 $ 66.55 $ 56.00
Number of Visitors 100,495 100,495 100,495 100,495
Aggregate WTP $ 5,990,507 $ 4,301,186 $ 6,687,942 $ 5,627,720
Table 6. Aggregate Willingness to Pay to Avoid Decrease in Working Landscapes
Swimmable Fishable Boatable
Best Worst
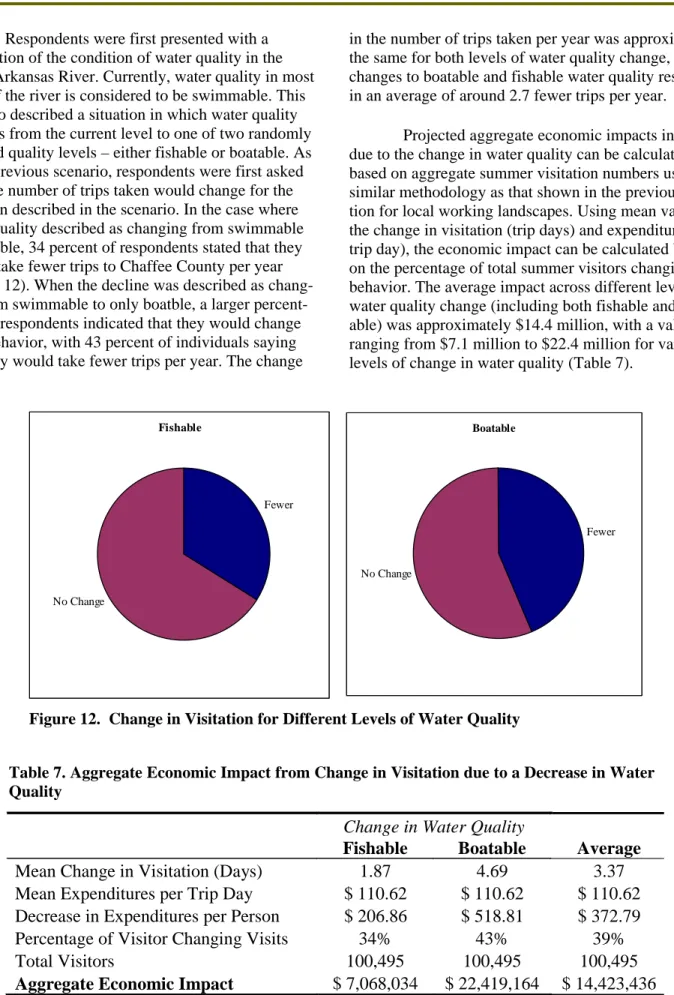
Respondents were first presented with a description of the condition of water quality in the upper Arkansas River. Currently, water quality in most parts of the river is considered to be swimmable. This scenario described a situation in which water quality declines from the current level to one of two randomly selected quality levels – either fishable or boatable. As in the previous scenario, respondents were first asked how the number of trips taken would change for the situation described in the scenario. In the case where water quality described as changing from swimmable to fishable, 34 percent of respondents stated that they would take fewer trips to Chaffee County per year (Figure 12). When the decline was described as chang-ing from swimmable to only boatble, a larger percent-age of respondents indicated that they would change their behavior, with 43 percent of individuals saying that they would take fewer trips per year. The change
in the number of trips taken per year was approximately the same for both levels of water quality change, with changes to boatable and fishable water quality resulting in an averageof around 2.7 fewer trips per year.
Projected aggregate economic impacts incurred due to the change in water quality can be calculated based on aggregate summer visitation numbers using a similar methodology as that shown in the previous sec-tion for local working landscapes. Using mean values for the change in visitation (trip days) and expenditures (per trip day), the economic impact can be calculated based on the percentage of total summer visitors changing their behavior. The average impact across different levels of water quality change (including both fishable and boat-able) was approximately $14.4 million, with a values ranging from $7.1 million to $22.4 million for varying levels of change in water quality (Table 7).
Fishable Fewer No Change Boatable Fewer No Change
Figure 12. Change in Visitation for Different Levels of Water Quality
Change in Water Quality
Fishable
Boatable
Average
Mean Change in Visitation (Days)
1.87
4.69
3.37
Mean Expenditures per Trip Day
$ 110.62
$ 110.62
$ 110.62
Decrease in Expenditures per Person
$ 206.86
$ 518.81
$ 372.79
Percentage of Visitor Changing
Visits
34% 43% 39%
Total
Visitors
100,495 100,495 100,495
Aggregate Economic Impact
$ 7,068,034
$ 22,419,164
$ 14,423,436
Table 7. Aggregate Economic Impact from Change in Visitation due to a Decrease in Water Quality
After the respondents were asked about how their behavior would change with the change in quality, they were presented with another question asking their willingness to pay to avoid the change in water quality. As in the previous scenario, respondents were asked to respond to the question if they said they would take fewer or the same amount of trips, and were provided 12 different dollar amounts ($0, $5, $10, $25, $50, $75, $100, $150, $200, $300, $400, and $500) from which they chose the one that revealed the maximum increase in total costs per person per trip they would be willing to pay to ensure that the scenario did not occur. Figure 13 shows the percentage of respondents that chose each of the different payment amounts for their willingness to pay. Overall, the willingness to pay to avoid a decrease to a boatable water quality level was higher,
with a mean willingness to pay of $72.40. The mean willingness to pay to avoid a decrease to fishable water quality was $45.14.
An aggregate willingness to pay can be calcu-lated for water quality as was shown for working land-scapes in the previous section. Taking an average of the mean willingness to pay for the fishable and boatable scenarios, we find a mean willingness to pay of $59.00 per person per trip. Based on the estimated number of summer tourists to Chaffee County, we estimate an aggregate willingness to pay of $5.9 million to avoid a decrease in water quality. Using the individual means for a decrease to fishable and boatable water, we esti-mate a range in aggregate willingness to pay from ap-proximately $4.5 million to $7.3 million (Table 8).
0 5 10 15 20 25 0 5 10 25 50 75 100 150 200 300 400 500 Willingness to Pay ($) P er ce n ta ge of R es p o n se s Fishable Boatable
Figure 13. Visitors’ Willingness to Pay to Avoid a Decrease in Water Quality
Change in Water Quality
Fishable Boatable Average
Mean WTP
$ 45.14
$ 72.40
$ 59.00
Number of Visitors
100,495
100,495
100,495
Aggregate WTP
$ 4,536,344
$ 7,275,838
$ 5,929,205
Working Landscapes and Water Quality
A third scenario was also included on the survey that incorporated both changes simultaneously. The changes in quality for working landscapes and water quality were included in all of the possible combina-tions (as shown in Table 9). Respondents were ran-domly presented with one of the six resulting scenarios and asked to assess the change in visitation (if any) that would result from the scenario as well as their willing-ness to pay to avoid the changes. As shown in Figure 5, all combinations of the variables in this scenario re-sulted in a larger percentage of the respondents stating that they would take fewer trips (no respondents indi-cated that they would take more trips under this sce-nario) than in the case where a single quality variable was changed. All different combinations resulted in at least 45 percent of the respondents stating that they would reduce the number of trips taken to Chaffee County given the quality change. The mean change in the number of trips taken ranged from approximately 2 to 5. The mean willingness to pay to avoid the changes described ranged from around $39 to a high of $106.
SUMMARY AND CONCLUSIONS
Based on the survey results, summer tourists to Chaffee County tend to be 52 years of age and male. Tourists are highly educated, generally with a graduate degree, and have an average household income between $60,000 and $79,999.
The natural attributes of Chaffee County were the most important factors in tourists’ decision to visit. In particular, mountain views, forested landscapes and rivers, lakes and wetlands were the most important. Ranches were ranked as less important to tourists’ deci-sion to visit than many natural attributes. Many of the amenities related to lodging and other services were ranked as less important that natural amenities. High
quality lodging and nightlife ranked particularly low among these attributes, while attributes related to affordability tended to be ranked higher.
The average visitor comes to Chaffee County as their sole destination and stays for about a week. Tour-ists tend to come in small groups, with an average of 3 people per group. The average visitor travels around 7.4 hours or 445 miles to reach Chaffee County. Outdoor activities are important to summer tourists, with the most important activities being hiking and walking, driving, sightseeing/photography, and wildlife viewing. Only around 4 percent of visitors participate in a ranch visit during their stay in the county. Tourists spend around $111 per day in Chaffee County, with the majority of expenditures on travel and food and drink.
Increased urbanization would not change the length of stay for most respondents, with only around 20 percent stating that they would reduce the number of trips to Chaffee County. The average reduction due to increased urbanization is slightly more than 2.5 trips. Decreased water quality would have a larger impact on visitation, with around 39 percent of respondents indi-cating they would decrease the number of trips per year. Decreased water quality would cause the average visitor to decrease visitation by 2.7 trips per year.
The projected decreases in visitation due to changes in the natural environment are likely to have a significant effect on the local economy. Decreased visita-tion due to a reducvisita-tion in working landscape areas is expected to lead to an economic impact ranging from $1.8 million to $7.1 million depending on the level of urbanization. Decreased water quality is expected to have an even larger effect, with an estimated economic impact ranging from $7.1 million to $22.4 million depending on the level of decrease in water quality.
Working Landscapes
25%
Decrease
25%
Decrease
50%
Decrease
50%
Decrease
75%
Decrease
75%
Decrease
Water Quality
Fishable Boatable
Fishable Boatable Fishable Boatable
Change
in
Visitation
Fewer Trips (%)
58.82 45.61 47.17 50.91 50.00 66.67
Mean Change in Trips
2.38 2.55 4.34 5.58 3.31 2.26
Table 9. Change in Visitation and Willingness to Pay with Change in Working Landscapes and Water Quality
Visitors are willing to pay to avoid decreased ranchland areas and water quality, however. On aver-age, tourists are willing to pay $56 per person per trip to avoid decreases in privately owned open space. The willingness to pay to avoid a decrease in water quality was similar, with an average of $59 per person per trip. These mean values translate to a significant annual willingness to pay to protect Chaffee County’s natural resources when aggregated to the entire summer visitor population. Tourist willingness to pay to protect working landscapes ranges from $4.3 million to $6.7 million, depending upon the percentage of working landscapes converted to urban land uses. The willing-ness to pay to maintain current levels of water quality is similar, with aggregate annual values ranging from $4.5 million to $7.3 million to avoid different levels of reduction in water quality.
These results show that while a significant decrease in tourism and economic impact can be expected in Chaffee County due to a change in the quality of the area’s natural resources, visitors also have a significant willingness to pay to ensure these resources are protected. A decrease in water quality is projected to lead to a substantially greater decrease in visitation than a decrease in local working landscapes, while the willingness to pay to avoid a quality change is only slightly higher for water quality than for local working landscapes.
While these values provide evidence of a will-ingness of tourists to protect the natural resources in Chaffee County, additional analysis should be under-
taken to determine the appropriate policy instruments to help ensure the protection of these natural resources. In addition, a previous survey of the resident population (Cline and Seidl 2008) indicates that residents are also willing to pay to protect working landscapes and water quality in the county. Results from both studies should be taken into consideration when determining the appro-priate local policy measures to be taken.
REFERENCES
Cline, Sarah and Andy Seidl. 2008. Chaffee County Ranchlands Survey – Preliminary Results. Economic Development Report, Colorado State University Extension, EDR 08-01. http://dare.colostate.edu/ pubs/edr08-01.pdf
Dean Runyon Associates. 2006. The Economic Impact of Travel on Colorado, 1995-2006. Report prepared for the Colorado Tourism Office, Office of Develop-ment and International Trade, Denver Colorado. Leisure Trends Group. 2006. Chaffee County Visitor
Bureau Visitation Survey.
ACKNOWLEDGEMENTS
This research was financially supported by Chaffee County and the Colorado Conservation Trust. The authors would like to gratefully acknowledge Ellen Olson, Lee Rooks and Cara Russell for their support of this project, and the assistance of several individuals that helped with the survey implementation during the sum-mer of 2007.