Department of Real Estate and Construction Bachelor Thesis nr. 316
Real Estate and Finance Bachelor level, 15 credits
Real Estate Economics
Author: Supervisor:
Pegah Ahmarinejad
Stockholm 2015-06-12 Han-Suck Song
Real Estate Bonds
The pricing of Secured vs. Unsecured Bonds on a growing SEK Capital
Market for Real Estate Bonds
Bachelor of Science thesis
Title: Real Estate Bonds - The pricing of
Secured vs. Unsecured bonds on a growing SEK Capital Market for Real Estate Bonds
Author: Pegah Ahmarinejad
Department: Department of Real Estate and
Construction
Bachelor Thesis number: 316
Supervisor: Han-Suck Song
Keywords: Capital markets, corporate bonds, real
estate bonds, real estate financing, bond pricing, secured bonds, unsecured bonds
Abstract
After the recent financial crisis real estate companies in Sweden faced problems obtaining funding for their development and growth as well as for the refinancing of existing investments, which made many companies diversify their funding sources. As a result of this, issuance activity in the real estate bond market has experienced a significant growth during the last five years (2010-YTD2015).
Swedish real estate companies have almost exclusively been issuing unsecured bonds as a substitute for bank loans. Since unsecured bonds do not offer any form of collateral in the case of a default, investors require higher yields for these bonds compared to bonds with any type of collateral. However, secured bonds entered the market in 2012 and contributed as an additional form of substitute to bank loans for real estate companies, as well as an additional bond investment option for investors.
This paper aims to highlight how secured bonds further enhance real estate companies’ debt structures by comparing the dominating unsecured bonds with the emerged secured bonds with focus on pricing. The research concludes that the amount of secured real estate bonds issued in the Swedish capital market has been small. Although, the market is forecasted to keep on experiencing secured bonds. It is also concluded that the pricing difference between secured and unsecured bonds mainly depends on the difference between the issuing company’s secured and unsecured creditworthiness packages.
Acknowledgement
This essay has been conducted at the School of Architecture and the Built Environment at the Royal Institute of Technology in Stockholm, Sweden.
First of all I would like to thank Louis Landeman at Danske Bank Markets who gave me the inspiration to write my thesis on this subject.
I would like to thank Louis Landeman, Emil Hjalmarsson and the rest of the team at Danske Bank Markets for their participation in the study and their help and guidance with the essay.
Also, I would like to thank my supervisor Han-Suck Song for guidance and assistance with the essay.
Stockholm, Spring of 2015 Pegah Ahmarinejad
Examensarbete
Titel: Fastighetsobligationer – Prissättningen
av säkerställda kontra icke-säkerställda obligationer på en växande
kapitalmarknad för fastighetsobligationer
Författare: Pegah Ahmarinejad
Avdelning: Institutionen för Fastigheter och
Byggande
Examensarbete nummer: 316
Handledare: Han-Suck Song
Nyckelord: Kapitalmarknaden, företagsobligationer,
fastighetsobligationer,
fastighetsfinansiering, prissättning obligationer, säkerställt, icke-säkerställt,
Sammanfattning
Efter den senaste finanskrisen, har fastighetsbolagen i Sverige upplevt svårigheter med att erhålla finansiering för sin utveckling och tillväxt samt för refinansiering av befintliga investeringar. Detta har bidragit till att fastighetsbolagen diversifierat sina finansieringskällor, vilket I sin tur har lett till att emissionsnivåerna för fastighetsobligationer har haft en markant tillväxt de senaste åren (2010-YTD2015).
Svenska fastighetsbolag har nästan enbart emitterat icke-säkerställda obligationer som substitut för banklån. Eftersom dessa obligationer inte erbjuder någon form av säkerheter vid eventuell konkurs, kräver investerare högre avkastning för dessa jämfört med obligationer med någon typ av säkerhet. 2012 tillkom säkerställda obligationer på marknaden, vilket bidrog till ytterligare ett alternativt substitut för banklån samt ett nytt investeringsalternativ för investerare.
Denna studie syftar till att belysa hur säkerställda obligationer används för att ytterligare förbättra fastighetsbolagens diversifierade finansieringsstruktur, genom att jämföra de dominerande icke-säkerställda obligationerna med de tillkomna säkerställda obligationerna med fokus på prissättning. Studien konstaterar att volymen av säkerställda fastighetsobligationer på den svenska kapitalmarknaden
varit låg. Däremot tros marknaden se mer av säkerställda obligationer och skillnaden i prissättning mellan säkerställda och icke säkerställda obligationer konstateras huvudsakligen bero på skillnaden mellan bolagets säkerställda och icke-säkerställda kreditvärdighetspaket.
Förord
Denna studie har gjorts på skolan för arkitektur och samhällsbyggnad vid Kungliga Tekniska Högskolan i Stockholm, Sverige.
Först och främst vill jag rikta ett stort tack till Louis Landeman på Danske Bank Markets som gav mig inspirationen till att skriva denna uppsats.
Jag skulle vilja tacka Louis Landeman, Emil Hjalmarsson samt resterande personer på Danske Bank Markets för medverkandet i studien och hjälp och vägledning under arbetet med uppsatsen.
Jag skulle även vilja tacka min handledare, Han-Suck Song, för råd och vägledning med uppsatsen.
Stockholm, våren 2015 Pegah Ahmarinejad
Table of Contents
1. Introduction
1
1.1 Background 1
1.2 Purpose and research question 2
1.3 Delimitation 3
1.4 Relevance 3
1.5 Disposition 3
2. Method
5
2.1 Design 5
2.2 Data and interviews 6
2.3 Secondary data 6
2.4 Validity 7
2.5 Reliability 7
3. Fundamentals of the bond market
8
3.1 Purpose and participants of the capital market 8
3.1.1 Capital Market Trading 8
3.1.2 Types of Bonds 8
3.2 The Swedish bond market 9
3.3 The corporate bond market 10
3.3.1 Ratings 11
3.3.2 Risk factors 12
3.3.3 Corporate bond characteristics 13
3.3.4 Capital structure 14
3.3.5 Medium Term Note Program 16
3.3.6 Pricing theory 16
3.3.7 Asset swap 18
4. Real estate financing - description and analysis
19
4.1 Real estate bond market 19
4.2 Recent pricing development trends 22
4.3 Case companies 24
4.3.1 Vasakronan 24
4.3.2 SvenskFastighetsFinansiering (SFF) 26
4.3.3 Wihlborgs 32
4.3.4 Klövern 34
5. Analysis of empirical material
36
5.1 Behavior and outlook of the real estate bond market 36 5.2 The split between unsecured and secured bonds 37 5.3 The pricing difference between secured and unsecured bonds 38 5.4 The future appearance of unsecured and secured bonds 40
6. Conclusion
41
7. References
42
7.1 Written sources 43
7.2 Web based sources 44
7.3 Verbal sources 45
8. Appendix
47
8.1 Interview questions 47
1. Introduction
1.1 Background
The Swedish corporate bond market has been underdeveloped as Swedish corporate companies traditionally obtain debt through bank loans. Although, in recent years the market for Swedish corporate bonds has grown rapidly. From investors' perspective, corporate bonds offered a higher interest rate than the low-yielding Swedish government bonds, while also being perceived as a safer investment than stocks. Likewise, the issuing corporate companies have experienced the interest paid for capital market financing attractive compared to for example bank loans. Additionally, the financial crisis sought to a diversified funding with a better distribution of debt maturities over time, which can be provided by issuing corporate bonds. This has meant that over the last few years we have seen a trend in the Swedish credit market, with an increasing number of new companies in the market. (Danske Bank Markets 2014)
The Swedish real estate bond market is somewhat immature and the market standards are in the process of taking form and being set. In recent years, banks have been both more restrictive as well as more generous in their lending due to the financial crisis, recession, lack of liquidity and changes in regulatory requirements. In connection to the introduction of the Basel III rules, the banks' capital requirements and liquidity coverage of loans changed. The restrictions on how they should structure their lending activities got tighter which affected the bank's cost of lending out the capital, which resulted in more expensive loans for real estate companies.
During the last years, banks' leverage ratios (the proportion of loans in relation to the value of the properties) had a downward trend. From previously having leverage ratios of 75%, it became more common with 70%, 65% and sometimes even 60% depending on the collateral. In 2014 we saw slightly increasing leverage ratios on the market and it was not impossible to get up to a 70% loan to value. Alternative forms of financing such as bonds are an interesting source of funds for achieving higher loan to value ratios on top of bank loans. Funding through bonds have not only been
used to cover the difference between banks' maximum limit for borrowing and real estate companies preferences, or to obtain debt for the most beneficial price, but also to make rapid interesting acquisitions when the lead time for bank financing has been slow. (Klövern 2014)
In order for corporate bonds to be an alternative to bank loans, rationally secured bonds would have to be issued. However, unsecured bonds significantly dominate the Swedish real estate bond market and are seen as a complement to existing bank loans, primarily in order to gain higher loan-to-value ratios. Until 2012 the market consisted solely of unsecured bonds. Before secured bonds entered the market, there was some uncertainty regarding how such bonds would be priced. Although, today some (very few) real estate companies have started issuing secured bonds in addition to unsecured bonds, which enables an analysis between spread differences. This difference, among some other factors, determines how the market will set itself towards secured real estate bonds.
1.2 Purpose and research question
Swedish real estate companies have almost exclusively been issuing unsecured bonds as a substitute for bank loans. Since unsecured bonds do not offer any form of collateral in the case of a default, investors require higher yields for these bonds compared to bonds with any type of collateral. However, secured bonds entered the market in 2012 and contributed as an additional form of substitute to bank loans for real estate companies, as well as an additional bond investment option for investors.
The interaction between secured and unsecured real estate bonds, regarding the pricing difference, is an interesting new and immature behavior to examine. A diversified funding structure that covers any economic situation and environment is very important to maintain and achieve for real estate companies. This paper aims to highlight how secured bonds are used to further enhance real estate companies’ debt structures by comparing the dominating unsecured bonds with the emerged secured bonds with focus on pricing.
The following questions are intended to be answered; how has the market developed and how does the market stand today regarding secured vs. unsecured bonds? Why does the pricing difference look the way it does? Are unsecured bonds here to stay?
1.3 Delimitation
This study will be restricted to Sweden and the Swedish real estate bond market. The focus of the study is on the pricing differences of secured and unsecured bonds issued by a real estate company. Therefor, thoughtfully selected case companies have been chosen to focus on through the study (read more about this in section 2.1 Design). In addition to the data on pricing, other important surrounding factors have been discussed with neutral analysts, hence this study is limited and does not take into account the specific companies or specific investors point of view. Neither is the main focus of the study based on the total Swedish real estate bond market due to the delimitation on the pricing of specifically elected bonds and companies. The study will also be restricted to the time period 2010 - April 15 2015.
1.4 Relevance
The Swedish real estate bond market has evolved the last five years, although it is still immature, it is also in a phase of maturity. The investor base is created and portfolios are filled with real estate bonds. In addition, a great proportion of real estate companies have entered the bond market. Therefor it is highly relevant to study the appearance of new substitutes in market, thus it will determine how the market will continue to mature.
1.5 Disposition
Section 1 provides a background to the subject and describes the current real estate
funding and bond situation for Swedish real estate companies. This section also describes the purpose of this thesis, as well as the limitations of the study.
Section 2 describes how and why the specific method was chosen.
Section 3 provides the academic background needed to be able to understand
corporate bonds as well as the capital market.
Section 4 starts with describing the real estate bond market and its recent pricing
development and then provides information and data of the case companies combined with an analysis of the information collected in this section.
Section 5 provides analysis of the information collected from the whole study with
interviews added. The section discusses the current status of the real estate bond market, the split between secured and unsecured bonds with regards to the case companies, the differences in pricing with regards to the case companies and the outlook of secured and unsecured real estate bonds.
Section 6 presents conclusions that can be drawn from the study and answers to the
research questions of this thesis.
Section 7 specifies the sources used in the thesis.
Section 8 includes the interview questionnaires used and a list of all bonds used in
2. Method
2.1 Design
The approach of the essay is to examine the pricing difference of some specific real estate companies’ secured and unsecured bonds through number-based data combined with company figures and other relevant information.
To create this type of multifaceted thesis, thoughtfully selected case companies have been chosen to focus on through the study. The criteria for the case companies have been to have a high level of activity on the Swedish capital markets for real estate bonds, as well as a considerable role in the market for either secured bonds, unsecured bonds or desirably in both. In addition to the number-based data on pricing, other important surrounding factors have been discussed with neutral analysts. The case companies number-based data and the analysts’ information on all counterparts (real estate companies, investors and the Swedish credit market), represents the main reference for the conclusion of his study.
When approaching a scientific problem the author generally choose between two different research strategies, qualitative or quantitative. In a study of a phenomenon from reality, where theory generation by interpretation and understanding is the objective, a qualitative method is the most appropriate (Bryman, 2002). Meanwhile, a quantitative method is more suitable when a study is based on numeric data, mathematical patterns and control variables (Hemmerslay, 2013).
Since this thesis is primarily based on quantifiable number-based data combined with interpreted information, the research strategy of the thesis is a combination of a qualitative and quantitative method.
2.2 Data and interviews
The selection of data was consistent with what was required to achieve to answer the research questions.
The number-based data represented the primary data and was retrieved from definite accurate sources (Danske Bank Markets and Bloomberg). Calculations and
compilations were made in very diversified models to highlight the data in the best possible arrangement for the analysis.
Since the thesis involves two research strategies, it was decided to implement a more comprehensive and general interview. Selecting represents covering all counterparts in a neutral approach made the choice of analysts’ as interview respondents very natural. The following professionals were interviewed;
Louis Landeman – Head of Credit Research at Danske Bank Markets.
Louis Landeman has been head of credit research at Danske Bank Markets since 2010. He began his career in 1996 in the rating company Standard & Poor’s, where he set the ratings of several major European companies. Subsequently, he has worked at Bear Stearns, SEB and Credit Suisse.
Emil Hjalmarsson – Analyst at Danske Bank Markets
Emil Hjalmarsson has been an analyst at Danske Bank Markets since 2015. He previously worked as an analyst at Nordea Markets and before that he graduated from KTH with a master’s degree in industrial economics and management.
2.3 Secondary data
The secondary data has mainly been used to accomplish the academic background in section 3 and primarily comes from course literature used during the studies at KTH Royal Institute of Technology in Stockholm, Sweden. Additionally, annual reports, prospects and press releases from the case companies have been used for the real estate bond market part in section 4.
2.4 Validity
Validity means that the information is obtained from multiple sources to avoid biases and that what should be measured actually is measured. In this thesis, validity regards to the qualitative method based on the interview and interpreted information. The information from the interview could be angled to the advantage of the interviewees and this has been taken into account. The information gained through the interview reflected the research questions and entailed properly material for the analysis in the study.
2.5 Reliability
Reliability refers to how well an examination measures what it measures, or whether the examination can be re-presented with the same results. In this thesis, qualitative research and results reflect the facts and opinions that prevail at the time of the interview and would probably not have a similar outcome if it was made at another time. However, reliability from the quantitative research will result in the same outcome if the same time period is observed.
3. Fundamentals of the bond market
3.1 Purpose and participants of the capital market
The capital market is a collective term for the credit market and the equity market. The capital market's most important function is to channel capital from investors to borrowers. The primary issuers of capital market securities are federal and local governments and corporations. The federal government issues long-term notes and bonds to fund the national debt. State and municipal governments also issue long-term notes and bonds to finance capital projects. Corporations issue both bonds and stock. One of the most difficult decisions a firm faces can be whether it should finance its growth with debt or equity (capital structure). Corporations may enter the capital market because they do not have sufficient capital to fund their investment opportunities. Firms may also choose to enter the capital markets because they want to preserve their capital to protect against unexpected needs. The largest purchasers of capital market securities are households. Frequently, individuals and households deposit funds in financial institutions that use the funds to purchase capital market instruments such as bonds or stock (Mishkin and Eakins, 2012).
3.1.1 Capital Market Trading
Capital market trading occurs in either the primary market or the secondary market. The primary market is where new issues of stocks and bonds are introduced and where the issuer of the security receives the proceeds of the sale. When firms sell securities for the very first time, the issue is called an initial public offering (IPO). A secondary market is where the sale of previously issued securities take place, and it is important because most investors plan to sell long-term bonds before they reach maturity and eventually to sell their holdings of stocks (Mishkin and Eakins, 2012).
3.1.2 Types of Bonds
Bonds obligate the issuer to pay a specified amount at a given date, generally with periodic interest payments. The par, face or maturity value of the bond is the amount that the issuer must pay at maturity. The coupon rate is the rate of interest that the
issuer must pay. This rate is either fixed for the duration of the bond and does not fluctuate with market interest rates or it is variable, so called floating (FRN) and fluctuates with market interest rates limited to a specific reference rate. Bonds traded in the capital market include government notes and bonds, municipal bonds, financial bonds and corporate bonds (see Mishkin and Eakins 2012 and Danske Bank Markets 2014).
3.2 The Swedish bond market
Financial issuers and public sector issuers dominate the Swedish bond market, although corporate issuers are a growing proportion of the total. To some extent this sector distribution reflects how the Swedish business distribution looks, but with bias towards capital-intensive companies, real estate companies and transportation companies. The energy sector is also an industry that is common to see on the market. The largest companies often have the ability to obtain financing in currencies other than SEK, but the smaller companies primarily use SEK as their currency of issue. During the past years it has been a noticeable trend that more companies that are active in the capital market go on the market without any official credit rating from one of the three rating agencies (see section 3.3.1 Ratings). Many have predicted growth in the riskier types of corporate bonds with lower credit ratings and it has also been the fastest growing category during 2014-YTD2015 (Landeman and Bergin 2014; Danske Bank Markets 2014; Mårtensson and Åström, 2013).
As mentioned earlier the companies and banks that issue bonds may choose to do so to either a fixed or a floating rate (usually issued at a initial price of 100). While the fixed rate bonds are issued to a specified interest rate, the floating-rate bonds offer a constant excess return over a specific reference rate (typically three month Stibor; Riksbanken 2013). Since the fixed interest bonds pay the same coupon rate over the life of the bond regardless of interest rates, the price of these bonds tends to rise when interest rates fall and fall when interest rates rise. For bonds with a floating interest rates the level of the coupon payments are adjusted over time as the underlying reference interest rate changes (although the credit spread, which refers to the difference between yields on treasury securities and yields on corporate bonds, is constant). If no dramatic change occurs in the issuer's credit quality the
floating-rate bonds will probably be and is generally traded to a price of 100. In recent years, the market for corporate bonds in SEK has grown rapidly. From investors perspective corporate bonds have offered a higher interest rate than the low-yielding Swedish government bonds, and it is perceived as a safer investment alternative than stocks. From the corporate issuers perspective the interest paid for capital market financing is more attractive than the interest paid for example bank loans (Landeman and Bergin, 2014).
3.3 The corporate bond market
When corporations need to borrow funds for long periods of time, they may issue bonds. Most corporate bonds have a face value of $1,000 and pay interest semiannually. Most are also callable, meaning that the issuer may redeem the bonds after a specified date. The bond indenture is a contract that states the lender’s rights and privileges and the borrower’s obligations. Any collateral offered as a security to the bondholders will also be described in the indenture. The degree of risk varies widely among different bond issues because the risk of default depends on the company’s condition. The interest rate on corporate bonds varies with the level of risk, bonds with lower risk and a higher rating (see section 3.3.1 Ratings) tends to have lower interest rates than more risky bonds. The spread between the differently rated bonds varies over time. A bond’s interest rate will also depend on its features and characteristics (Mishkin and Eakins 2012; Landeman and Bergin 2014).
Corporate bonds are usually associated with higher risk and thus higher expected returns than government bonds. There are essentially two ways for bond investors to achieve higher returns. By taking more credit risk; this can be done either by buying bonds in companies with lower credit ratings or by buying bonds that are further down in a company's capital structure (see section 3.3.4 Capital structure). By taking more interest rate risk; bonds with longer maturities normally provide higher returns, but it also creates interest rate sensitivity and therefore price volatility increases. If the interest rate increases, the bond value decreases (Geltner, Miller, Clayton, Eichholtz, 2006).
3.3.1 Ratings
A company's credit rating reflects the issuer's relative creditworthiness and the relative risk that a default may occur. The higher the rating is, the higher the quality of the issuer's creditworthiness is perceived to be. There are three dominating rating agencies; Standard & Poor's (S&P), Moody's and Fitch. S&P and Moody's are the two leading agencies with over 75% market share (2014), while Fitch is somewhat smaller. The methodology is relatively similar between the three agencies. In simplified explanation the issuer’s business risk and financial risk is analysed and evaluated in a rating. The rating of a single issuer may differ between the rating agencies depending on how the different components of the analysis are evaluated in the final rating. The table below (Table 1) illustrates the three major rating companies’ long-term rating scales (there also exists short-term rating scales that are attributable to the long-term ratings). Note the horizontal separation between the S&P and Fitch called BBB- and BB + (Moody's: Baa3/Ba1). Everything above this line is titled "investment-grade" (IG) (a relatively safe investment with lower credit risk) while everything below the line is called "high-yield" (HY) (a high-yield return but also a higher credit risk). Ratings below the lower mark (D/C/DDD) indicate that the company has missed to fulfill at least one of its debt obligations. To further explain the difference between the different ratings it can be mentioned that a company with a 'BBB'-rating during the period 1981-2010 had a 4% chance of default over a five-year period, while the corresponding risk of a company with a ‘BB'-rating was 13% and for a company with a 'B'-rating was 42% (S&P). The agencies also publish credit outlooks relating to the prospective future direction of the ratings. This outlook may be positive, stable, negative or developing (which means that the credit rating may go either up or down) Landeman and Bergin 2014; Mishkin and Eakins 2012).
Table 1. Rating scale (Danske Bank Markets 2014)
3.3.2 Risk factors
Investor whom purchases corporate bonds are exposed to several risk factors, such as: credit risk, liquidity risk, market and interest rate risk, and documentation risk. The credit risk refers to the issuer's ability and willingness to repay debts. For long-term investors credit risk is by far the most important risk factor in a corporate bond. Credit risk depends on the probability of default and what you can expect to get back at a possible restructuring/bankruptcy ("recovery rate"). The risk of default has a high correlation with economic development. The level of corporate bankruptcies tend to rise sharply during recessions due to the deterioration of earnings and more limited access to financing. The corporate bond market is less liquid than the market for government bonds, which can be perceived by the (sometimes) considerable difference between bid and ask prices. The prices of corporate bonds may periodically fluctuate significantly, even without any special news about the specific issuer. The prices are affected by a variety of other causes such as general interest rate trends, risk appetite, economic prospects and more. The bond documentation for investment
S&P Moody’s Fitch
AAA Aaa AAA
AA+ Aa1 AA+
AA Aa2 AA
AA- Aa3 AA-
A+ A1 A+ A A2 A A- A3 A- BBB+ Baa1 BBB+ BBB Baa2 BBB BBB- Baa3 BBB- BB+ Ba1 BB+ BB Ba2 BB BB- Ba3 BB- B+ B1 B+ B B2 B B- B3 B- CCC+ Caa1 CCC Caa2 CCC CCC- Caa3 CC Ca CC C C D C DDD-D
grade companies tends to be relatively standardized. However, there may be differences in the conditions that the bond is issued. These may affect the pricing (e.g. mergers and acquisitions) or contain opportunities for the issuer to withdraw the bond before the maturity date Danske Bank Markets 2014; Landeman and Bergin 2014)
3.3.3 Corporate bond characteristics
Restrictive covenants are rules and restrictions designed to protect bondholder’s interests. They usually limit the amount of dividends the issuer can pay (so to conserve cash for interest payments to bondholders) and the ability of the issuer to issue additional debt. Other financial policies, such as the issuer’s involvement in mergers, may also be restricted. Restrictive covenants are included in the bond indenture. Typically, the interest rate will be lower the more restrictions are placed on management through restrictive covenants because the bonds will be considered safer by investors (Geltner et al. 2006; Mishkin and Eakins 2012).
Most corporate indentures include a call provision, which states that the issuer has the right to force the holder to sell the bond back. The call provision usually requires a waiting period between the time the bond is initially issued and the time when it can be called. The price bondholders are paid for the bond is usually set at the bond’s par price or slightly higher (usually by one years interest costs). If interest rates fall, the price of the bond will rise. If interest rates fall enough, the price will rise above the call price, and the issuer will likely call the bond. Because call provisions put a limit on the amount that bondholders can earn from the appreciation of a bond’s price, investors tend not to like call provisions. Another reason that issuers of bonds include call provisions is to make it possible for them to buy back their bonds according to the terms of the sinking fund (a requirement in the bond indenture that the issuer pay off a portion of the bond issue each year). This provision is attractive to bondholders because it reduces the probability of default when the issue matures, although it enables the issuer to reduce the bond’s interest rate. Other important reasons for callable bonds are that issuers may have to retire a bond issue if the covenants of the issue restrict the issuer from some activity that is in the best interest of the company’s stockholders, or if the company wishes to alter its capital structure. Since the bondholders do not generally like call provisions, callable bonds must have
a higher yield than comparable non-callable bonds. Some bonds can be converted into shares of common stock. This permits the bondholders to share in the company’s good fortunes if the stock price rises. Most convertible bonds will state that the bonds can be converted into a certain number of common shares at the discretion of the bondholder. The conversion ratio will be such that the price of the stock must rise substantially before conversion is likely to occur. Bondholders like a conversion feature. It is similar to buying just a bond but receiving both a bond and a stock option. The price of the bond will reflect the value of this option and so will be higher than the price of comparable nonconvertible bonds. The higher price received for the bond by the firm implies a lower interest rate (Mishkin and Eakins, 2012).
3.3.4 Capital structure
An important aspect in corporate bonds is the capital structure, where the bond is located, as this has a major impact on both the pricing and any potential claims if the issuer goes bankrupt. A company's liabilities can be divided into several categories that reflect the investor’s opportunities to make a claim on the company's assets if the issuer somehow can no longer meet its obligations. These claim opportunities can be illustrated by a falling scale (see Figure 1 below) with the best claim potential on "top" and vice versa. The higher up in the capital structure the investors are, the greater is the possibility that they will be able to obtain all or part of the capital invested back. A holder of a secured debt is the first in line to receive its stake at a reconstruction, while shareholders are last in the turn. Most bonds issued by corporations are senior and unsecured (Danske Bank Markets 2014; Landeman and Bergin 2014).
Figure 1. Schematic illustration of a company’s capital structure (Danske Bank Markets 2014)
Schematic illustration of a company’s capital structure
Secured debt
Senior debt
Subordinated debt
Hybrid capital
A secured bond is a type of bond that is secured by the issuer’s pledge of a specific asset, which is a form of collateral on the loan. Some types of secured bonds are mortgage bonds and equipment trust certificates. Mortgage bonds are used to finance a specific project. An example is that a property may be the collateral for the bonds issued for its construction and in the event that the issuer fail to make payments as assured, the mortgage bondholders have the right to liquidate the property in order to be paid. As a result, bonds with specific property pledged as collateral are less risky than comparable unsecured bonds and will therefor have a lower interest rate. Bonds can also be secured by tangible non-real-estate property, such as heavy equipment or airplanes. These bonds are titled equipment trust certificates (Berk and DeMarzo, 2011; Mishkin and Eakins 2012; Hansan 2014).
Unsecured bonds are bonds that are backed only by the general creditworthiness of the issuer. No specific collateral is pledged to repay the debt. In event of default, the bondholders must go to court to seize assets. Collateral that has been pledged to other debtors is not available to the holders of debentures. Debentures usually have an attached contract that spells out the term of the bond and the responsibilities of management. Debentures have a lower priority than secured bonds if a company defaults and will therefor have a higher interest rate than otherwise comparable secured bonds. Subordinated debentures have an even lower priority claim and are only paid after non-subordinated bondholders have been paid in full in the event of a default (Berk and DeMarzo 2011).
In addition to the bond placement in the capital structure, an investor should be aware if the bond is structurally subordinated to the company's other debt. In practice this means that if the bond, for example is a senior, it can still be subordinated to other liabilities if it is placed in another company. A bond issued by a holding company, which owns a subsidiary, is normally a structurally subordinated bond to bonds issued by the subsidiary. There is a relationship between a bond's placement in the capital structure and the recovery an investor can expect in a bankruptcy. According to Moody's, the average recovery rate of unsecured bonds has recently been at around 40% (2014). However, this figure varies considerably over time, depending on where in the economic cycle you are. Especially in periods with
many failures, there is a clear tendency that the recovery is lower, which can be attributed to the fact hat the asset values are generally lower during these periods (typically recessions). If a shortage of liquidity and capital also occurs in the financial system, this tendency is strengthened (Danske Bank Markets, 2014).
3.3.5 Medium Term Note Program
In addition to issuing single stand-alone bonds it is possible issuing bonds as part of a Medium Term Note Program (MTN-program). A MTN-program enables a company to issue numerous bonds using the same base prospectus. The MTN-program contains a base prospectus with all of the general legal agreement and other essential information. The company only needs to determine the final details of the individual loans within the program. This enables the company to tailor its debt issuance to meet its financing needs rapidly and inexpensively. (Mishkin and Eakins, 2012)
However, MTN-programs are quite expensive and time consuming to create. Although, When companies wants to use bond financing as a long-term financing solution and plans to be active in the bond market MTN-programs tends to be useful (Mårtensson and Åström, 2013).
3.3.6 Pricing theory
The basic and most important feature of bond pricing is that the price of the bond should reflect the market value of the present value of all future cash flows the bond will return to the investor in an efficient market. The stated payment amounts and dates of the specific bond will be decisive for the market price, and the cash flow will be continuously paid until the maturity date. However, a bond with periodical coupon payments to the investors somewhat differ in the principal of pricing. The coupons are paid at predetermined dates and when the bond matures a sum consisting of the face value plus the last coupon paid. If it is a zero-coupon bond, it is solely the face value and the periods left until the maturity date that is of interest to the investors in terms of pricing (Berk and DeMarzo, 2011).
If you buy a bond and hold it until it matures, you will earn the yield to maturity. The yield to maturity represents the most accurate measure of the yield from holding a bond and is therefor essential in the pricing of a bond. The yield to maturity is the internal rate of return, which makes the present value of the future cash flows equal
to the current market price of the bond. (Mishkin and Eakins, 2012) (Geltner, Miller, Clayton, Eichholtz, 2006).
A one-year zero-coupon bond, which is traded at 97.45 with a face value of 100, will yield 2.6% to the investor. This quantitative example is illustrated in the formula below;
97.45 = 100 / (1 + Yield to maturity)
1+ Yield to maturity = 100 / 97.45 ≈ 1.026 1.026 – 1 ≈ 2.6% = Yield to maturity
However, a bond that pays coupons is a little more complicated to price mathematically because the coupons need to be discounted with regard to when they actually paid. Another important component is that the coupon amount might vary with an underlying index such as the stibor-rate. The following formula calculates the price (P) of a fixed rate bond (c is the yearly coupon payment, FV is the face value,
YTM is the Yield to maturity);
n n YTM FV YTM C YTM C YTM C YTM C P ) 1 ( ) 1 ( ... ) 1 ( ) 1 ( 1+ + + 2 + + 3 + + + + + =
(see e.g. Mishkin and Eakins 2012).
The value of bonds fluctuates with current market prices. If a bond has an interest payment based on a 3% coupon rate, no investor will buy it at face value if new bonds with an interest payment based on a 6% coupon rate are available at the same price. To sell the bond, the holder will have to discount the price until the yield to the holder equals 6%. Bonds can be traded at discount (the current market price is lower than the face value), at premium (the current market price is higher than the face value) and at par (the market price is equivalent to the face value). (Mishkin and Eakins, 2012)
Fluctuation in price appears because of various reasons. If there is a major price discount it might be long time left to maturity. Premium traded bonds are often related to government bonds when investors are speculative in the native currency. Bonds are often traded at par when the bond is about to mature and an eventual final coupon has been paid (Berk and DeMarzo 2011).
A higher yield results in a discount factor, which leads to a reduced present value of future cash flows, which implies that the bond price will be lower. This states that the yield has a negative relation to the price of the bond. If an investor buys a bond at a certain yield and it declines, it means that the investor can sell the bond at a higher price, which also implies that changes in the yield will give a greater impact on payments later in time since these are discounted with additional periods. How sensitive the bond price is to changes in the yield to maturity is expressed by the duration. A bond with high duration is more sensitive to interest rate fluctuations than one with low duration. (Berk and DeMarzo, 2011)
The risk premium and the liquidity premium are also of great importance in the understanding of bond pricing. When future cash flows are associated with high risk, the investor likely demand satisfactory compensation. The interest rate demanded rise in accordance with how the market valuates the risk in the instrument. When there is low liquidity in a financial instrument, meaning that there are few other market participants able or interested in buying the bond, investors will demand a higher yield. If the bond is bought and sold over the counter (the trades are executed between two parties through a broker) the liquidity premium will be higher and the price of the bond lower (Berk and DeMarzo, 2011).
3.3.7 Asset swap
An asset swap is an artificial structure that allows an investor to swap fixed rate payments on a bond to floating rate while maintaining the original credit exposure to the fixed rate bond. The pricing of asset swaps is therefore primarily driven by the credit quality of the issuer and the size of any potential loss following default. There are several variations on the asset swap structure with the most widely traded being the par asset swap. The asset swap buyer purchases a bond from the asset swap seller in return for a full price of par and then enters into a swap to pay fixed coupons to the asset swap seller equal to the fixed rate coupons received from the bond. In return the asset swap buyer receives regular payments of Libor (London Interbank Offered Rate, the world’s most commonly used benchmark for short-term interest rates) plus (or minus) an agreed fixed spread. The maturity of this swap is the same as the maturity of the asset (Lehman Brothers Analytical Research Series, 2000).
The asset swap can also be described as the difference between the yield of a bond and the Libor curve, expressed in basis points. As mentioned above the asset swap spread is designed to show the credit risk associated with the bond and is calculated by using the bond’s yield to maturity. Although analysts will typically look at both the asset swap spread and the so called zero volatility spread, which is the continuously compounded constant spread to the Libor curve required to re-price a bond, to see if there are discrepancies in a bond’s price. The zero volatility spread can be explained as an instrument used in the analysis of an asset swap that uses the zero coupon yield curve to calculate the spread. The zero volatility spread is the number of basis points that would have to be added to the spot yield curve so that the bond’s discounted cash flows equal the bond’s present value. Each cash flow is discounted using its maturity and the spot rate for that maturity term, so each cash flow has its own zero coupon rate. For short-term debt and high-rated debt there tends to be little difference between the two spreads. If there is a large difference between the two spreads then the market is not pricing the bonds accurately (Lehman Brothers Analytical Research Series, 2000).
4. Real estate financing - description and analysis
4.1 Real estate bond market
When leverage comparisons between different sectors are made, the real estate sector is regularly found at the very top. Bank loans are unquestionably the most common form of debt financing for the real estate sector. However, the last couple of years have shown that capital market financing through bonds have become an increasingly attractive form of debt financing for the real estate sector. The issuance volume has increased significantly the past five years, and the real estate sector currently represents over one third of the total corporate market in terms of issuance volume. From 2014 to year to date (YTD: April 15 2015), the real estate sector represents 34% of the total corporate market in terms of issuance volume, which is a 6% increase compared to the same figure from 2010 to year to date 2015 (see Pie chart 1 and Pie chart 2 below), and Donner & Svensk (2012), Danske Bank Markets (2014) and Tyrrell and Bostwick (2005).
Pie chart 1. Corporate issuance activity by volume 2010-YTD2015 (Danske Bank Markets and Bloomberg 2015)
Pie chart 2. Corporate issuance activity by volume 2014-YTD2015 (Danske Bank Markets and Bloomberg 2015).
The issuance volume has increased from SEK11bn 2010 to SEK38.2bn 2014, which equals a compounded annual growth of 28.3%. The year to date 2015 volume is SEK16.1bn (see Column chart 1 and Column chart 2 below).
Column chart 1. Real estate issuance activity 2010-YTD2015 (Danske Bank Markets and Bloomberg 2015). Other Corporate Sectors
72% Real Estate Sector
28%
Other Corporate Sectors 66%
Real Estate Sector 34% 0 1 2 3 4 5 6 7 8
Jan Feb Mar Apr May Jun Jul Aug Sep Oct Nov Dec
SEKb
n
Column chart 2. Yearly increased activity in the real estate sector (Danske Bank Markets and Bloomberg 2015).
The distribution between investment-grade bonds (IG) and high-yield bonds (HY) from 2010 to YTD2015 was 81% IG bonds and 19% HY bonds. Although, the same distribution from 2014 to YTD2015 is 76% IG bonds and 24% HY bonds, which marks an significant increase of HY bond issuance (see pie chart 3 and pie chart 4 below).
Pie chart 3. Distribution of HY vs. IG 2010-YTD2015 (Danske Bank Markets and Bloomberg 2015).
Pie chart 4. Distribution of HY vs. IG 2014-YTD2015 (Danske Bank Markets and Bloomberg 2015). 11.0 15.4 23.5 31.9 38.2 16.1 0 5 10 15 20 25 30 35 40 45 2010 2011 2012 2013 2014 YTD2015 SEKb n HY 19% IG 81% HY 24% IG 76%
The split between secured and unsecured bonds from 2010 to YTD2015 has been very notable; unsecured bonds are dominating with 92% market share (see pie chart 5 below).Unsecured bonds had a 100% market share 2010 and 2011. Unsecured bonds entered the market 2012 and have had a small market share since then (see column chart 3 below).
Pie chart 5. Unsecured real estate bonds dominating 2010-YTD2015 (Danske Bank Markets and Bloomberg 2015).
Column chart 3. Distribution of secured vs. unsecured real estate bonds 2010-YTD2015 (Danske Bank Markets and Bloomberg 2015).
4.2 Recent pricing development trends
Investment grade spreads has continued on the tightening trend and came down some additional basis points during the first quarter of 2015. Looking at the ‘BBB’ category an average SEK five year bond trades slightly above 100bps while a five year corporate in the ‘A’ category is priced in the high-50bps area (see Line chart 1 and Chart line 2 below).
Unsecured 92% Secured 8% 5 10 15 20 25 30 35 40 45 2010 2011 2012 2013 2014 YTD2015 SEKb n Secured Unsecured
Line chart 1. IG spreads A SEK -5y (Danske Bank Markets and Bloomberg 2015).
Line chart 2. IG spreads BBB SEK -5y (Danske Bank Markets and Bloomberg 2015).
In the BB segment there has been a different outlook. Since June 2014 spreads have been widening until the middle of January, since then the spreads have recovered again. A typical ‘BB’ category name with five years maturity has a spread of about 250bps (see line chart 3 below).
Line chart 3. HY spreads BB SEK- 5y (Danske Bank Markets and Bloomberg 2015) 0 20 40 60 80 100 120 140
Oct-12 May-13 Nov-13 Jun-14 Dec-14 Jul-15
bps A SEK 0 50 100 150 200 250
Oct-12 May-13 Nov-13 Jun-14 Dec-14 Jul-15
bps BBB SEK 150 200 250 300 350
Jul-12 Jan-13 Jul-13 Jan-14 Jul-14 Jan-15 Jul-15
bps
4.3 Case companies
4.3.1 Vasakronan
Vasakronan is the largest real estate company in Sweden, with a portfolio consisting of 185 properties (2.5m square meters) worth around SEK92bn at the end of 2014. The portfolio is concentrated in Sweden’s larger cities, with Stockholm accounting for 62% of rental income, Göteborg 19%, the Öresund region 12% and Uppsala 7%.
Offices accounted for 80% of rental income and rental 16% in 2014, whereas other property accounted for 4%.
The current structure of the company was formed after AP Fastigheter (controlled by the state-owned AP funds), bought all the shares of Vasakronan from the Swedish government on 3 July 2008. The merged corporation changed its name to
Vasakronan and became one of the largest property management companies in Europe. It is the company’s strategy to focus on growth markets in Sweden and own properties that provide a stable return over time.
Before this, Vasakronan was a state-owned company with direct ownership by the Swedish government. After the merger, ownership of the new Vasakronan became equally shared by the first, second, third and fourth Swedish National Pension (AP) funds via the Vasakronan Holding Company. The four AP funds are government entities and are reviewed by the Swedish Ministry of Finance. Hence, Vasakronan can be classified as a government related entity (GRE) as the Swedish government yields some indirect influence on the company despite its autonomy. The ownership
structure between Vasakronan and the AP funds is linked by the holding company Vasakronan Holding AB. Vasakronan AB pays annual group distributions to
Vasakronan Holding AB. Although Vasakronan does not benefit from an explicit state guarantee, the fact that the company is essentially a wholly owned subsidiary of the state-owned AP funds is significant for credit investors. The ownership commitment is strengthened further by the ‘change of control’ clause of its bank loans and MTN-program, which is positive for bondholders.
Vasakronan aims to have a diverse funding base and the company relies both on bank loans and the capital markets (bonds and certificates). As already mentioned, the
bank loans and the MTN-programcontain a ‘change of control’ clause, that will be triggered if at least 15% of the shares are not owned directly or indirectly by the AP1-AP4 funds, and will give the investor the right (but not the obligation) to sell the bonds back to Vasakronan. Vasakronan has recently increased its use of secured bank loans, which increases the structural subordination risk but it is important to
mention that the company has a financial policy of funding a maximum of 20% assets with secured loans (currently constituting 16% of assets).
Vasakronan’s liquidity is considered to be adequate but with a highlight 0n the
somewhat high share of short-term financing which constituted 26% of the funding at the end of 2014, compared with a policy of a maximum of 40%. The new subscription commitment (the owners commit to purchase commercial paper issued by the
company up to a maximum volume of SEK18bn, valid until August 2017 with a notice period of 24 moths) together with cash on the balance sheet totals 162% of short-term debt. At the end of 2014, the average loan maturity was 3.3 years, although
Vasakronan has a policy of maintaining an average minimum loan tenor of two years.
Vasakronan has a strong financial position. The LTV (loan-to-value) was unchanged at 51% at the end of 2014. The net debt to EBITDA (earnings before interest, taxes, deprecations and amortization) increased during 2014 and amounted 11.1x,
compared with 10.2x in 2013. The FFO (funds from operations)/debt stayed at 6% for the full year 2014. Net interest expenses continued to improve following lower credit spreads.
Vasakronan has a conservative financial policy covering financial risks, interest rates risks, credit risks and exchange rate risks. It stipulates that Vasakronan must not be exposed to exchange rates and can only be exposed to counterparties with a credit rating of at least ‘A-‘. The average capital fixing shall be at least two years (Q4 14 3.3 years) and the amount of loans maturing within 12 months shall not exceed 40% (Q4 14 26%). The total amount of committed credit facilities in addition to cash and cash equivalents shall cover the amount of loans maturing within 12 months (Q4 14 126%). Furthermore, Vasakronan shall have interest coverage of at least 1.9x (Q4 14 3.2x), interest rate fixing shall be between one and six years (Q4 14 5.1 years) and the
interest rate fixing maturing within 12 months cannot exceed 70% (Q4 14 34%). (Vasakronan annual report 2014)
Vasakronan does not have an official rating by one of the rating agencies but is viewed as an ‘A-‘ by Danske Bank (YTD2015). (Danske Bank Markets, 2014)
Vasakronan only issues senior unsecured bonds. The pricing curve (Asset swap spread) of a Vasakronan two year bond with the maturity date 08/14/2015 and the volume SEK1150m is illustrated below (see Line chart 4). The bond has a spread
development from 30bps (Jun-14) to 25bps (May-15).
Line chart 4. Vasakronan’s pricing (Danske Bank Markets and Bloomberg 2015)
4.3.2 SvenskFastighetsFinansiering (SFF)
In January 2015 Nya Svensk FastighetsFinansiering AB was launched. NyaSFF is a newly formed finance company with a guaranteed MTN program of SEK8bn. Catena AB, Dios Fastigheter AB, Fabege AB Platzer Fastigheter Holding AB and Wihlborgs Fastigheter AB own the company to 20 percent each (see figure 2 below; NyaSFF’s ownership structure). The aim is to broaden the base for the company's borrowing structure. In February, the company went out with an offering that was fully
subscribed. Overall SFF signed bonds for SEK2bn with maturities ranging from two and five years, for both fixed and floating interest rates. (Press release Hansan)
0 20 40 60 80 100 120 A p r-1 4 J un -14 J u l-1 4 S e p-14 N ov -14 D ec -14 F eb-15 A p r-1 5 M ay -15 J u l-1 5 bps Unsecured
Figure 2. NyaSFF company ownership structure (Hansan.se)
Since, this thesis is based on data from the time period 2010-YTD2015 it is naturally important to explain the structure and details of the ‘old SFF’. Nonetheless, the fundamental structure and purpose of SFF is the same as NyaSFF.
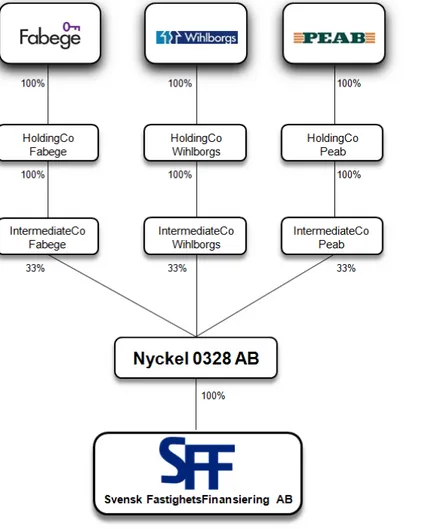
Svensk FastighetsFinansiering AB (SFF) is a finance company that is 100% owned by holding company Nyckel, which in turn (via different holding companies) is owned by Wihlborgs Fastigheter, Fabege and Peab. SFF issues bonds that are structured using mortgage securities from its owners.
SFF’s bonds are structured using mortgage securities in properties located in its
Owners’ prioritized home markets. There are clearly defined limitations of debt incurrence to limit the risk that the value of the underlying mortgage securities fails to provide full recovery for bondholders (i.e. if SFF’s owners were unable to fulfill their obligations towards SFF meaning that the assets would have to be divested).
SFF’s liquidity buffer would give the company some time to monetize its assets if should be needed. An external market valuation of the properties is carried out on a quarterly basis. Even though SFF’s bonds are structured using mortgage securities, the company’s cash flows are exposed to the owners’ credit quality and the value of the mortgage securities is dependent on the property price development. In a scenario whereby several of the owners were to embark on restructuring at the same time as a steep fall in property prices, SFF could face problems fulfilling its debt obligations. SFF is 100% owned by Nyckel 0328 AB, which in turn, via different holding companies, is owned by Wihlborgs Fastigheter (33.3%), Peab AB (33.3%) and Fabege AB (33.3%). SFF’s operations are managed by Hansan AB (see Figure 3 below; SFF’s ownership structure). (Danske Bank Markets, 2014)
When the different property owning companies (named ‘Propco(s)’ in Figure 4 below) wish to achieve financing, the respective holding company (‘Holdco(s)’) finances this by taking a loan from SFF, while in return leaving a promissory note with an attached mortgage collateral to SFF. The respective owner guarantees its respective holding company’s obligations towards SFF. Hence, SFF receives both the promissory notes with the attached mortgage and a guarantee from the owner to fulfill the debt obligations in the event of payment problems of the holding company. The mortgage collaterals are placed in a separate pool. An independent security agent (currently CorpNordic) acts as a representative for bondholders. In order to ensure that SFF can fulfill its debt obligations in the event of any of its owners facing payment problems, there is a detailed set of rules that among other things stipulates what liquidity reserve SFF should maintain. The goal is that SFF should have a liquidity buffer of up to 18 months in place to ensure that the company can maintain its interest payments to bondholders until a sale of the secured assets in the asset pool has taken place. Also, a minimum solidity of 30% should be maintained and the assets in the security pool should be located in its owners’ prioritised home markets (see Figure 4 below; a reproduce summary of the loan process as described in SFF’s MTN prospectus).
The three companies Wihlborgs Fastigheter, Peab and Fabege have strong ties. Brinova is the largest owner in Fabege and Wihlborgs. Brinova was de-listed from Nasdaq OMX Stockholm in September 2012 as the company Backahill gainedcontrol over a majority of shares in the company. Backahill was formed in 1998 and is 100% owned by Erik Paulsson. The Paulsson family is also the largest shareholder in Peab: Mats Paulsson owns 22.3% of voting shares, Svante Paulsson with family and companies has 13.2% of voting shares, and Fredrik Paulsson with family and companies owns 8% of voting shares. Furthermore, Erik Paulsson is chairman of the board in SFF’s service agent Hansan AB. As the Paulsson family also holds a number of board seats in the different companies, it has considerable influence over the three owner companies and their operations. For a greater understanding of SFF’s financial profile a brief description of the three owner companies is provided below.
For comprehensive information about Wihlborgs please turn to the next section (4.3.3 Wihlborgs) where it is provided.
Fabege is a real estate company formed in 2005 when the ‘old’ Wihlborgs concentrated on the Stockholm region and changed its name to Fabege. The company’s operations are focused on leasing and management of office premises and property development, with a focus on Stockholm City, Solna and Hammarby Sjöstad. At the end of 2014, the market value of Fabege’s property portfolio amounted to SEK32.6bn, with project and development properties of SEK3.8bn. The occupancy rate in the property management portfolio amounted to 94%. Fabege’s total interest-bearing debt amounted to SEK19.5bn at the end of 2014, of which short-term debt accounted for SEK6.6bn. The average fixed interest rate was 3.09%, with an average maturity of 1.9 years. The average capital tied up was 3.7 years. At the end of 2014, Fabege’s reported loan to value was 60%, with a equity ratio of 38%. Fabege’s financial policy includes a minimum solvency target of 30% with an interest coverage ratio of at least 2.0 times (including realised changes in value). At the end of 2014, Fabege had SEK690m of bonds outstanding that were issued via SFF. In 2013, Fabege also issued a SEK1.17bn three-year stand-alone bond that was secured by collateral in the Solna Uarda 5 property where the Swedish state-owned utility Vattenfall has its head office. (Fabege’s annual report 2014)
Peab is one of the leading construction and civil engineering companies in Scandinavia with some 13,000 employees and an annual turnover of around SEK43bn. The company mainly carries out its operations in Sweden, Norway and Finland and has its head office in Förslöv in Southern Sweden. The company is represented in four different business areas: Construction, Civil Engineering, Industry and Property Development. Peab’s business is largely project related, with consequent project-related risks. The company is exposed to tough competition and fairly saturated markets, with resulting strong margin pressure. In 2014, the total order backlog stood at SEK25bn. Peab’s equity ratio was 28,2% at the end 2014, which was above the company’s minimum solidity target of 25%. In April 2013, Peab signed a new SEK5bn 3.5-year new credit agreement with its banks. Reported net debt stood at SEK3.9bn at the end of 2014. Including unutilized credit facilities, Peab’s liquid funds amounted to SEK6.8bn at the end of 2014. (Peab annual report 2014)
At the end of 2014, SFF had total equity of SEK8.4bn, with total debt of SEK1.4bn, of Which secured bonds constituted SEK650m. Cash and liquid holdings stood at SEK102m. SFF’s issuance volume for 2014 was SEK450m. (SFF Annual report 2014)
SFF does not have an official rating by one of the rating agencies but is viewed as a ‘BBB‘ by Danske Bank (year end 2014). Considering its adequate liquidity pool and its intermediate leverage, the credit quality of SFF’s bonds is rated at ‘BBB’ in spite of certain concentration risk in its pool of properties. In the event of lowering the credit assessment of Fabege or Wihlborgs (the two owners that have issued bonds via SFF so far, 2014), the credit view would also be decreased on SFF.
The pricing curve (Asset swap spread) of a SFF’s two year bond with the maturity date 03/14/2016 and volume SEK450m is illustrated below (se Line chart 5). The bond has a spread development from 80bps (Jun-14) to 64bps (May-15).
Line chart 5. SFF’s pricing (Danske Bank Markets and Bloomberg 2015).
4.3.3 Wihlborgs
The current Wilhborgs Fastigheter was originally founded in 1924 in Malmö. In 2005, the properties in Stockholm and the Öresund region were separated and the Öresund property portfolio was included in a new company, which kept the name Wihlborgs Fastigheter. Some of Wihlborgs owners are Brinova, LF fonder and SHB fonder. The company’s operations are concentrated in the Öresund region, with properties in Malmö, Helsingborg, Lund and Copenhagen. At the end of 2014, the market value of Wihlborg’s total property portfolio amounted to SEK24.3bn, with an annual rental value of SEK2bn. The majority of the rental value comprises office and shop premises, while industrial and warehousing properties represent approximately a fourth of the rental value. At the end of 2014, Wihlborgs’ total interest-bearing debt amounted to SEK14bn. The average loan maturity including unused credit facilities was 4.1 years, with an average interest rate of 3.7%.
At the end of 2014, Wilhborgs’ equity ratio stood at 28.2%, with a reported loan to value ratio of 58,2% (whereof 83% bank loans and 17% bonds with SFF included) and an interest coverage of 2.8 times. Wihlborg’s financial policy includes a maximum loan to value target of 60%, an interest coverage minimum target of 2.0 times and a minimum equity to assets ratio of 30%. In 2014 Wihlsborgs issued bonds that were guaranteed by Region Skåne and in addition to the coupon interest payments,
40 60 80 100 120 140 160 180 200 A p r-1 4 J un -14 J u l-1 4 S e p-14 N ov -14 D ec -14 F eb-15 A p r-1 5 M ay -15 J u l-1 5 bps Secured
Wihlborgs pays a guarantee fee to the Region Skåne. During 2014 the company also borrowed SEK225m from the SFF. (Wihlborgs annual report 2014)
Wihlborgs does not have an official rating by one of the rating agencies but is viewed as a ‘BB+‘ by Danske Bank (YTD2015). (Danske Bank Markets, 2015)
Wihlborgs issues both unsecured and secured bonds (local government guarantee). The pricing curves (Asset swap spreads) of Wihlborgs three year senior unsecured bond with the maturity date 04/23/2018 and volume SEK500m, and five year secured bond with the maturity date 02/18/2019 and volume SEK785m are illustrated below (see line chart 6). To achieve the best possible comparison between the spreads of the two different bonds, an index has also been created (see line chart 7). The index shows the same starting point, of the spreads, for the two different bonds. The Unsecured bond has an average spread of 92bps and the secured bond has an average spread of 37bps, thus resulting in a spread difference of 55bps.
Line chart 6. Wihlborg’s pricing (Danske Bank Markets and Bloomberg 2015).
Line chart 7. Wihlborg’s pricing index (Danske Bank Markets and Bloomberg 2015). 20 30 40 50 60 70 80 90 100 110 M a r-1 5 M a r-1 5 A p r-1 5 A p r-1 5 A p r-1 5 M ay -15 M ay -15 M ay -15 J un -15 bps Unsecured Secured 70 75 80 85 90 95 100 105 110 115 M a r-1 5 M a r-1 5 A p r-1 5 A p r-1 5 A p r-1 5 M ay -15 M ay -15 M ay -15 J un -15 bps Unsecured index Secured Index
4.3.4 Klövern
Klövern is a publicly listed real estate company with commercial properties in Swedish growth regions. In 2014 Klövern’s property value increased by 26% and totaled SEK30bn. At the end of 2014 the property portfolio included 408 properties with a rentable area of 2792000sqm. The business entities are divided into four regions: South, East, Stockholm and Middle/North, whereof the Stockholm region (including Uppsala) accounts for 42% of Klövern's rental value. Office remises represents 56% of the rental value, followed by industrial/warehouse 20%, education/health care/others 13% and shops 11%. Klövern has a diversified customer base with the ten largest tenants accounting for approximately 22.2% of the total rental value. At the end of 2014, the average lease term for these customers were 4.7 years. The largest customers are Ericsson, WSP, KappAhl, PostNord and TeliaSonera. Some of Klövern’s owners are Corem Property Group, Arvid Svensson Invest and Rutger Arnhult.
Klövern’s financial policy stipulates that the equity ratio shall be at least 30% (Q4 14 31.5%) and the interest coverage shall be at least 1.5x (Q4 14 2.0x). Klövern shall also have a capital tied-up period of at least 1.5 years (Q4 14 2.1 years). Furthermore, the return on equity should (as a long-term goal) amount to the risk-free rate plus at least nine percentage points and the dividends to shareholders should (as a long-term goal) amount to at least 50 percent of the total result. Klövern had a loan-to-value ratio of 60% and an average interest rate of 3.5% at the end of 2014. Klövern’s interest bearing debts totaled SEK20bn and the outstanding volume of bonds amounted SEK4.2bn, whereof SEK700m represents a secured bond issued in Mars 2013. Klövern’s bond issuance volume 2014 was SEK1.1bn. (Klövern annual report 2014)
Klövern does not have an official rating by one of the rating agencies but is viewed as a ‘BB-‘ (YTD2015) (Danske Bank Markets 2015).
As mentioned above Klövern issues both unsecured and secured bonds. The pricing curves (Asset swap spreads) of Klövern’s four year senior unsecured bond with the maturity date 03/04/2018 and volume of SEK1.1bn, and five year secured bond with
the maturity date 04/04/2018 and volume of SEK700bn are illustrated below (see line chart 8). To achieve the best possible comparison between the spreads of the two different bonds, an index has also been created (see line chart 9). The index shows the same starting point, of spreads, for the two different bonds. The Unsecured bond has an average spread of 152bps and the secured bond has an average spread of 200bps, thus resulting in a spread difference of 50bps.
Line chart 8. Klövern’s pricing (Danske Bank Markets and Bloomberg 2015).
Line chart 9. Klövern’s pricing index (Danske Bank Markets and Bloomberg 2015). 150 170 190 210 230 250 270 290 A p r-1 4 J un -14 J u l-1 4 S e p-14 N ov -14 D ec -14 F eb-15 A p r-1 5 M ay -15 J u l-1 5 bps Unsecured Secured 80 85 90 95 100 105 110 115 120 125 130 A p r-1 4 J un -14 J u l-1 4 S e p-14 N ov -14 D ec -14 F eb-15 A p r-1 5 M ay -15 J u l-1 5 bps Unsecured Index Secured Index
5. Analysis of empirical material
5.1 Behavior and outlook of the real estate bond market
The Swedish real estate bond market is somewhat very immature and the market standards are in the process of taking form and being set. Although, there are already some market standards, which will be further described in this section.
The Corporate bond market is generally designed for and more attractive for larger companies and capital market financing through bonds have had a significant growth in recent years. Smaller companies mainly use bank loans as their financing form, as it suits them better for several reasons. Bonds often have longer durations than bank loans, which make them more suitable for companies that require securing their financing for longer periods. In addition, the management of bonds is more complicated than bank loans, which make it easier for larger companies to handle. Making changes in bond terms are often much more complicated in comparison to bilateral bank loans since changes in the contract require a majority decision from the bondholders.
Louis Landeman (L.L) and Emil Hjalmarsson (E.H) from Danske Bank Markets Credit Research (Danske Credit Research) explain that after the financial crisis a new period was started and the whole market grew rapidly in a very dynamic environment. Corporate bond fund flows began to have large inflows, the HY market emerged, and a growing investor base was developed. L.L and E.H also point out that, when looking at the HY and IG split (34% / 66% 2014-YTD2015) it is important to mention that corporate real estate companies sometimes represent a mix of government owned companies as well (e.g. Vasakronan).
When looking at the yearly increased activity in the real estate sector an important and decisive aspect is if banks are restrictive in their lending or not. During 2013 and 2014 the banks were more restrictive, which is an explanation for the highly increased issuance volumes these years (2013: SEK32bn, 2014: SEK38bn).
L.L and E.H do not believe in a continued super fast growth in the issuance volumes of real estate bonds, since the market is relatively saturated. Real estate bonds are