primary data for
environ-mental overview of
product life cycles
data for environmental overview
of product life cycles
Users, perspectives,
methods, data, and information systems
Editor: Raul Carlson Authors: Raul Carlson, Maria Erixon, Markus Erlandsson,
Karolina Flemström, Sandra Häggström, Johan Tivander
THE SWEDISH ENVIRONMENTAL PROTECTION AGENCY
Orders
Phone: + 46 (0)8-505 933 40 Fax: + 46 (0)8-505 933 99
E-mail: natur@cm.se
Address: CM-Gruppen, Box 110 93, SE-161 11 Bromma, Sweden Internet: www.naturvardsverket.se/bokhandeln
The Swedish Environmental Protection Agency Phone: + 46 (0)8-698 10 00, Fax: + 46 (0)8-20 29 25
E-mail: natur@naturvardsverket.se
Address: Naturvårdsverket, SE-106 48 Stockholm, Sweden Internet: www.naturvardsverket.se
ISBN 91-620-5523-2.pdf ISSN 0282-7298 © Naturvårdsverket 2005
Digital publication
Preface
Access to credible, life cycle-based knowledge and information provides a basis for necessary prioritisation and action and also a potential to avoid environmental problems shifting from one phase of the life cycle to another. It also helps to make sure that measures are taken where they will provide the most benefit.
This report describes how information about the environmental performance of products over their life cycles can be accessed anywhere and by any stakeholder throughout the product life cycle.
The report covers different users of environmental product information, various methods and tools used to produce and disseminate that information, and primary data needed for those methods and tools. The report also outlines an information system organisation for potential use as a cooperative approach to supporting stakeholders of product life cycles with environmental information.
The report has been produced as a part of the commission 2004 from the Gov-ernment to the Swedish Environmental Protection Agency in order to develop in-formation on the environmental impact of products. The aim of the commission is to develop the provision of data, knowledge and information of the environmental impact of products during the whole life cycle. The report is one of the basis to the report to the Government on the commission “Information om produkters miljöbe-lastning” Swedish EPA report no 5526.
The authors are responsible for the content in the report, why the report cannot be referred to as the Swedish EPA´s position.
Stockholm in December 2005
Author’s preface
This report has been produced by the research group Industrial Environmental Informatics (Industriell Miljöinformatik - IMI) at the Department of Computing Science and Information Technology, Chalmers University of Technology, at the request of the Swedish Environmental Protection Agency (EPA). The commission is one of several assigned to various experts and expert groups as part of a larger project being carried out by the Swedish EPA at the behest of the Swedish Gov-ernment. The larger project aims to develop information on the environmental impact of products by identifying drivers, obstacles, elements and components of an information system for environmental overview of product life cycles.
A series of international audits of the Swedish competence centre CPM be-tween 1997 and 20041,2,3 has recognised the work of the IMI research group as an
internationally unique centre of excellence in the field of industrial environmental information management. Within this competence centre the authors have acquired a variety of expertise in the fields of environmental data for product life cycles. In alphabetic order:
Raul Carlson, M.Sc. (Engineering Physics) joined Chalmers in 1995 to partici-pate in the development of SPINE, and later to work as project manager to estab-lish the Swedish national LCA database. He has also been involved in developing the ISO LCA data documentation format ISO/TS 14048, and in European projects on developing DfE methodology for the rail industry and toxicology/LCA method-ologies, etc. He has been head of department at IMI since 2001.
Maria Erixon, M.Sc. (Environmental Science) has worked in the field of data and data formats for LCA since 1997, joining Chalmers to work on the CPM data-base in 1999. Since then she has been engaged in various projects, including a toxicology/LCA database.
Markus Erlandsson, M.Sc. (Engineering Physics) joined the new department of IMI as a systems developer in 2002 and has since worked on DfE tools, eco-procurement tools and web-based LCA tools.
Karolina Flemström, M.Sc. (Chemical Engineering) was also recruited in 2002 to work on establishing a materials database for DfE for the rail industry and has since also been engaged in toxicology/LCA and other databases.
Sandra Häggström, M.Sc. (Chemical Engineering) was recruited in 2003 to de-velop a materials database for DfE for the rail industry and her work since then includes information management in industrial EMS.
1
The first international evaluation of CPM was performed in 1997, the second in 2000 and the third in 2004. Only the second two are recognised as available references.
2
Baras J.S., Frysinger S.P., Graedel T., Lih M.M., Udo de Haes H.A, “International Evaluation Report”, CPM Report 2000:8, CPM, Chalmers University of Technology, Gothenburg, Sweden, 2000.
3
Baras J.S., Frysinger S.P., Inaba A., Stenius P., “CPM International Evaluation Report”, CPM Report 2004:2, CPM, Chalmers University of Technology, Gothenburg, Sweden, 2004.
Johan Tivander, M.Sc. (Aquatic and Environmental Engineering) joined the team in 2001 to work as a systems developer, but has also worked on LCA and toxicology data models and software, and has coordinated a large European project in this field.
Contents
Preface 3 Author's preface 4 Abstract 9 Summary 11 Svensk sammanfattning 25 1 Introduction 39 1.1 Background 391.2 Overviewing product life cycles 40
1.3 State of the art 46
1.4 Gap and needs analysis 51
2 User categories and perspectives for overviewing product
life cycles 55
2.1 Introduction 55
2.2 Categories of users who overview product life cycles 55
2.3 Reasons for product life cycle overview 57
3 Methods and tools 67
3.1 Introduction 67
3.2 Methods and tools for technical dialogue 68
3.3 Expert methods and tools 75
3.4 Support tools 94
4 Describing environmental data and its availability 103
4.1 Introduction 103
4.2 Environmental information 103
4.3 Common primary environmental data 108
4.4 Availability and interpretability of environmental data 112
5 Organising an information system 125
5.1 Introduction 125
5.2 Organisation and design 130
5.3 Developing the information system 136
6 Recommendations and future developments 141
6.1 Introduction 141
6.2 Recommendations 141
6.3 First steps to data availability for environmental overview of product life
cycles 145
References 149
1 Appendix: Examples of data handling in methods and tools for
environmental assessment 165
2 Appendix: Common primary environmental data 193
3 Appendix: Availability of various types of data 215
3.1 Examples of nomenclatures for materials 215
Abstract
This report describes how information about the environmental performance of products over their life cycles can be accessed anywhere and by any stakeholder throughout the product life cycle. Particular consideration has been given to differ-ent ways of performing a life cycle assessmdiffer-ent (LCA).
The report covers different users of environmental product information, the various methods and tools used to produce and disseminate that information, and the primary data needed for those methods and tools. The report also outlines an information system organisation for potential use as a cooperative approach to supporting stakeholders of product life cycles with environmental information.
Chapter 2 contains a comprehensive (albeit not exhaustive) list of perspectives from which a stakeholder may environmentally view and assess products. A num-ber of examples are given to describe reasons people have in practice for applying each perspective. The intention is to ensure that users find the methods and tools in chapter 3 to be truly relevant.
Chapter 3 lists and presents methods and tools for assessing environmental per-formance, for acquiring information about environmental impacts, and for provid-ing information on environmental properties of products. Particular emphasis is placed on the different types of LCA that have been identified, how they differ, how to use them, and their differing data requirements.
Chapter 4 lists and presents the data and information that are used or produced by the methods and tools described in Chapter 3. This chapter includes discussion of data availability, data quality issues and data formatting.
Chapter 5 proposes an information system organisation and design taking into account all perspectives and practical needs as described in Chapter 2, as well as all information and data issues described in Chapter 4. Particular attention is paid to the need for compatibility with existing systems, the technical and economic feasi-bility of building small systems instead of large ones, and the necessity of a short payback time for all investments, particularly those in the private sector.
Summary
S1 Background
This report shows how data and information about the environmental life cycle performance of products is available and can be made more readily available to stakeholders, including producers, purchasers and private individuals. It also pro-poses how to organise an information system to make such data available. The specific aim is to describe how the same data can be used for different measures of environmental performance and by different users, to achieve synergies and cost-effectiveness, i.e. how to organise data sources and expertise, and how to format data.
The gap analysis in the report concludes that costly input data are needed to produce valuable output data on the methods and tools for environmental overview of product life cycles, but that insufficient environmental data are available. The cost of acquiring data is high. This is not generally understood by experts, industry and those developing and using methods and tools. There is no common definition of ‘environmental’, so the concept is too wide and databases and information sys-tems are too often built on the basis of specifications that are too broad and unre-stricted. The result is that resources are expended and some new knowledge is acquired. But the information system is not optimised for specific users, and it is often costly to attract users to badly designed environmental information systems. Hence, the systems are not used by those who might need them. These are the main problems.
The report lists in detail the types of environmental life cycle information dif-ferent users request for various reasons, such as energy demand, waste generation, content of toxic substance, recyclability, etc. Much space is devoted to methods related to Life Cycle Assessment (LCA), such as how to perform and acquire data for full LCAs, simplified LCAs and Environmental Product Declarations (EPD), but the report is far from limited to LCA methodology. Environmental Risk As-sessment (ERA), material content inventory, Design for Environment (DfE) etc. are also covered in detail.
Since the environmental life cycles of most products are global and involve many industrial sectors, the studies made for this report and the proposals pre-sented are not limited to Europe, for example, or to any specific sector or product category, but are intended to be international and independent of specific sectors.
The authors are experts in the field of industrial environmental information management and have also made extensive literature studies for this report. Refer-ences are presented as footnotes throughout the report, and there is also a full list of references at the end.
S2 Overview environmental product life
cycle performance
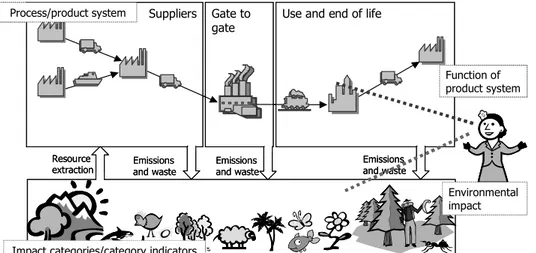
Figure S.1 represents a product life cycle and its impact on the natural environ-ment. The drawing is of course much simpler than any a real-life product life cycle; environmental overviews of product life cycles require major simplifications. The simplifications vary, depending on the aspects of environmental performance to be examined.
Simplified rather than full information is often requested for various reporting systems, management systems, methods and tools. Simplifications are named dif-ferently depending on the context, e.g. key environmental aspects4, environmental performance indicators5, environmental condition indicators6, category indicators7,
data categories8, reporting variables9,10,11, etc. Different choices of environmental
indicators are made when evaluating environmental performance of activities, processes, hardware or services12.
4
International Organisation for Standardisation (1997), ISO 14001: Environmental management
sys-tems - Specifications with guidance for use. 5
European Commission (2003), 2003/532/EC, Commission recommendation of 10 July 2003 on
guid-ance for the implementation of Regulation (EC) No 761/2001. 6
International Organisation for Standardisation (1999), ISO 14031: Environmental management -
Environmental performance evaluation – Guidelines. 7
International Organisation for Standardisation (2000), ISO 14042: Environmental management - Life
cycle assessment – Life cycle impact assessment. 8
International Organisation for Standardisation (1997), ISO 14040: Environmental management - Life
cycle assessment - Principles and framework. 9
Global Reporting Initiative (2002), Sustainability Reporting Guidelines, http://www.globalreporting.org/guidelines/2002/gri_2002_guidelines.pdf.
10
Naturvårdsverket (2002), Planering och utformning av miljöövervakningsprogram, viewed at http://www.naturvardsverket.se/dokument/mo/hbmo/del1/plan/upplagg4.pdf.
11
World Economic Forum (2005), 2005 Environmental Sustainability Index – Benchmarking National
Environmental Stewardship. 12
Carlson R (2002), Environmental Performance Indicators, Published in INSIGHT, Vol 5 Issue 2 July 2002 p. 22-23, The International Council on Systems Engineering (INCOSE).
Manufacturing Process Use Process Waste Treatment Process Transport Transport Extraction Process Extraction Process Refinement Process Transport Transport
Natural Environmental System
Downstream technical systems performing causal activities Upstream technical systems
performing causal activities Technical system performing activities Causal raw material extraction Causal waste generation and emissions Direct waste generation and emissions Causal waste generation and emissions
Figure S.1. A schematic product life cycle and its environmental impact.13 Used with permission. Copyright Raul Carlson and Ann-Christin Pålsson, CPM, Chalmers University of Technology, 1998
It is difficult to identify indicators so they are significant, understandable, and so the cost of acquiring the primary data needed and collating the simple information are acceptable14, 15. Many organisations throughout the world (e.g. ISO, OECD,
EU, GRI, WEF and WBCSD) are developing and selecting good and representative parameters for defining environmental indicators16.
The content and layout of this report is based on the contention that complex environmental information does not suffice to provide people in general with an environmental overview of product life cycles, and that simplified environmental information, such as environmental indicators, must be used instead. The report therefore starts by examining the needs expressed by users.
S3 Users
Everyone is a potential user of environmental information. But if this report is to make a practical contribution, its scope must be limited. Since global commitment to sustainable development is well recognised under Agenda 2117, that international agreement forms a natural basis for delimitation. The use of environmental infor-mation is intended for sustainable development, and the users of environmental
13
Carlson R, Pålsson A-C (1998), Maintaining Data Quality within Industrial Environmental Information
Systems; 12 th International Symposium ‘Computer Science for Environmental Protection’ Bremen
1998; Band 1/Volume 1 p. 252-265
14
Flemström K (2003), Environmental Performance Indicator (EPI), Methodology in REPID, Chalmers University of Technology, Sweden.
15
Carlson, Tivander, Erixon et al. (2004), Conceptual model report, OMNIITOX project report 2004, www.omniitox.net.
16
General environmental indicator links can be found at: http://www.pepps.fsu.edu/EI_Gen.html
17
information intend to take decisions furthering that development, i.e. by improving the environmental performance of product life cycles
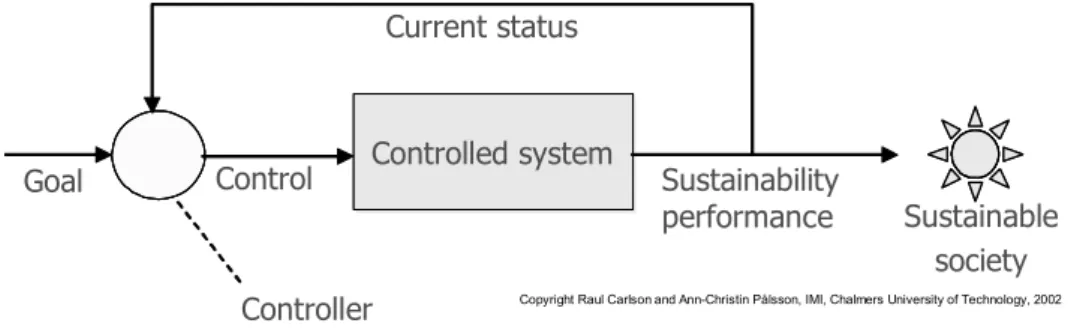
Figure S.2 describes the general use of environmental information, in that there is a vision of a sustainable industrial society, and people control the environmental impact of product life cycles by the various decisions they make. If the decision maker is provided with environmental information about the consequences of his decisions, he may be in a position to take more responsible control.
Figure S.2 The diagram shows that to navigate towards sustainable development controllers or decision makers need to understand the system they control and need feedback on consequences as well as visionary and short-term objectives. Copyright Carlson R. and Pålsson A-C, CPM, Chalmers University of Technology, 1998. Used with permission. There may be many situations or reasons why people request environmental infor-mation. This report selects five specific reasons as a basis for the analyses, recom-mendations and proposals that follow throughout the report:
• Purchasing products; to assess a product in terms of becoming an owner of a product or facility, for example.
• Designing products; to assess a product in terms of being able to improve its design.
• Analysing product content; to asses the material contents of a product so as to gain an overview of the environmental consequences of choices of mate-rials.
• Considering product risks; to assess a product in terms of its risks or abil-ity to cause harm over its life cycle.
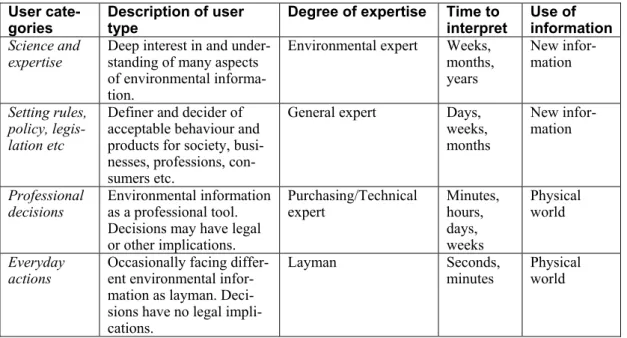
• Societal consequence of product; to assess a product based on the envi-ronmental consequences of large-scale production of the product. The report gives many examples of each of these uses of environmental informa-tion from all over the world and in numerous sectors. However, informainforma-tion re-quirements may vary greatly, depending on the user. To provide a structure to these differences, four user categories for environmental information are defined on the basis of the reference material: (i) environmental scientists and experts; (ii) policy makers of various kinds; (iii) professional decision makers; and (iv) laymen in their everyday actions. These user categories are independent of industrial sector and product type.
These users have widely differing requirements of information, and use it in different ways. Environmental scientists and experts tend to request highly detailed facts and use the information to produce new knowledge. Policy makers also
Controlled system
Controlled system Environmental
impact Current status Control Goal Controller Sustainable industrial society Controlled system
Controlled system Environmental
impact Current status Control Goal Controller Sustainable industrial society
request detailed information but in condensed form, and use it to define rules and set frameworks for action. Hence, both these user categories produce new informa-tion rather than taking direct decisions about the physical world. Professional and lay decision makers use the information to make decisions on hardware and physi-cal consequences, such as purchase of goods and services.
When the four user categories are seen in the light of Figure S.2, it may be con-cluded that this report is mainly directed towards the day-to-day information needs of professional and lay decision makers. To be precise, these user categories need simple information of various kinds, as described in the previous section "S2 Over-view environmental product life cycle performance".
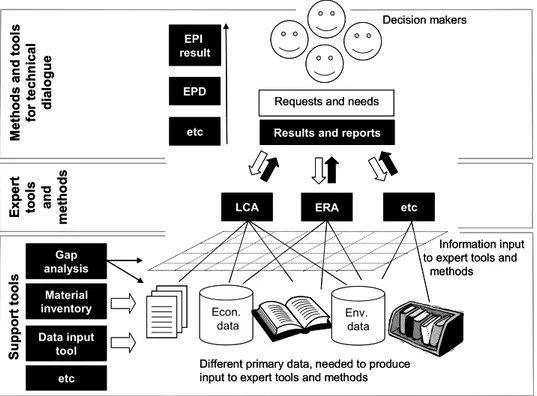
Figure S.3. The tools are classified according to their intended use: support tools, expert tools and communication tools. Expert tools and methods deal with the requests and needs of decision makers. Support tools give information input for the expert tools. The methods and tools for tech-nical dialogue are used to make the results from the expert tools understandable for decision makers.
S4 Methods and tools
To obtain simple environmental indicators, detailed primary data first need to be compiled and aggregated using various methods and tools in sequence: Measure-ments or modelling produces low level primary data, which are then compiled to form emission data, toxicity data, environmental impact data, for example. These data may be used for an LCA method or tool according to ISO standards, and the results of that study may be recompiled to produce an environmental product decla-ration or a weighted life cycle indicator according to a chosen impact assessment method.
This sequential use of methods and tools is shown in Figure S.3, where the de-cision makers are end users of various simple results produced by methods and
Econ. data EPI result Env. data
LCA ERA etc
EPD etc M ethod s an d t o ol s for te chn ic al di al o g u e Information input to expert tools and
methods Ex p ert tool s and me th o d s S u pp or t t o o ls Material inventory Data input tool etc Gap analysis
Different primary data, needed to produce input to expert tools and methods
Decision makers
Results and reports
Requests and needs
Econ. data EPI result Env. data
LCA ERA etc
EPD etc M ethod s an d t o ol s for te chn ic al di al o g u e Information input to expert tools and
methods Ex p ert tool s and me th o d s S u pp or t t o o ls Material inventory Data input tool etc Gap analysis
Different primary data, needed to produce input to expert tools and methods
Decision makers
Results and reports
tools intended for communication of LCA results, for example. The sequence of methods and tools requires a large number of support tools to acquire and process the data, such as databases, gap analysis methods, product material inventory pro-cedures and various data input tools.
LCA and ERA are regarded as expert tools, and they are not intended to pro-duce information immediately useful to decision makers. This means, for example, that simplified LCAs should not be regarded as easy to understand, only easy to use. However, there are many ways of simplifying LCA, ranging from general LCI databases, simple full LCA software, prefabricated cradle-to-gate and end-of-life databases for specific types of product, use of available statistics by I/O-analysis, communication via EPD systems, simplified screening LCAs, etc. There are also methods where the entire LCA is shown only as environmental product life cycle indicators, easy to use and easy to understand for the decision maker. It must be stressed that a full LCA is also a substantial simplification, since it both limits and structures the work required to obtain a life cycle overview.
The general recommendation about how to use various simplified methods and tools, and specifically LCA methods and tools, is that simplification should be in line with the user’s needs. For example; a full LCA is a good way of supporting and simplifying systematic accumulation of new knowledge of the environmental life cycle of a product or a decision. Simple LCA tools such as software or screen-ing tools are useful within organisations where the users can be sure that the back-ground information and simplified methodology are right for their purpose within the organisation. Examples are design and purchasing departments. Both full LCAs and simplified LCAs are difficult to communicate to people who have not partici-pated in use of the method or tool. LCA tools based on I/O methodology are practi-cal since they can make use of publicly available statistipracti-cal data. The major weak-ness is that they are not as intuitively understood as LCAs. LCAs are easy to un-derstand for anyone, even though performing a full LCA is hard work. National statistics and I/O analyses are complex concepts that may be difficult to grasp.
Hence, simplified methods and tools such as LCAs are useful if the right sim-plification is chosen for the right situation. This is equally relevant for small and medium-sized enterprises (SMEs), large corporations, countries or international cooperation. SMEs should seek to use methods and tools that are easy to use, inter-pret and communicate and should share costs with other SMEs or larger corpora-tions, for example. Publicly funded initiatives and large corporations should seek structured ways of sharing data and information, perhaps by striving to harmonise environmental performance indicators.
S5 Data, availability and information systems
Figure S.2 shows that primary data on current status needs to be communicated as environmental information to decision maker and be updated at appropriate inter-vals. Some methods and tools very seldom update current status. For example, LCI databases and LC impact assessment methods are often not updated at all, or at intervals of 5 to 10 years. Common EMS systems update current status at least once a year in the annual environmental report. However often they are updated,
methods and tools for environmental overview of product life cycles cannot be simplified beyond a need for primary data.
Primary environmental data is expensive. It is needed in large quantities, about many materials, many emissions, many products, many production facilities, many geographical locations and many different environmental conditions. There are major financial advantages in coordinating primary environmental data acquisition, and in sharing the same data sources. Hence, establishing common primary data for an environmental overview of product life cycles is a key economic strategy for sustainable development in general, and for every local environmental management system at production plants and in communities, enterprises, countries and interna-tional cooperation.
This report describes how a common format for primary data for a wide variety of methods and tools may be structured. The format allows sharing of data for LCA, ERA, EMS, DfE, etc. The report also lists many available primary data sources that may be used to provide data for the many different methods and tools. To better understand why these existing data sources are not enough for all needs, the concept of data availability is examined systematically, by introducing six di-mensions of availability:
• Existence - whether anyone has ever structured this specific type of data. • Coverage - the extent to which the data covers the exact needs.
• Understandability - whether the data is documented so that it can be inter-preted by a user.
• Maintenance - whether there is anyone to contact to obtain more informa-tion about the data.
• Accessibility - whether the data is actually accessible from the perspective of the user in terms of cost, confidentiality, etc.
• Formatting - whether the data is separated in specified data fields in the documentation, or whether it is available only in free text in literature or structured in databases.
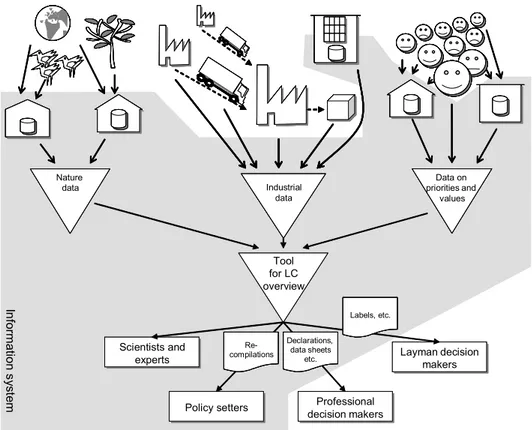
Figure S.4 A simplified overview of the organisation of an information system for environmental overview of product life cycles anywhere in society.
Figure S.4 depicts an organisation of available data sources, methods and tools and the various user categories addressed in section ‘S3 Users’. This organisation of primary data, methods, tools and users is an information system. There are no limi-tations on the geographical location or geographical distribution of the information system. It is assumed that the various data sources are located at different places throughout the world, around the raw material abstraction sites, transport routes and production facilities associated with the life cycle of a product. It is worth reiterating that the information may be updated at very infrequent intervals, and that the information is dealt with in sequence.
This organisation of data sources and other resources into an information sys-tem is described in detail in the report, so as to present the key issues in making data available for environmental overview of product life cycles. Coordination of data and information needs is important, as is the use of a common format and a common overall strategy. This will also be addressed in the recommendations in the next section.
S6 Recommendations
As was pointed out in section ‘S3 Users’, professional and lay decision makers are the most important users of the information system. But those users have little interest in the full concept of environmental responsibilities and sustainable devel-opment. Their focus is on decisions. The responsibility for establishing an
Industrial data Industrial data Data on priorities and values Data on priorities and values Environmental data Nature data Tool for LC overview Scientists and experts Scientists and experts Professional decision makers Professional decision makers Policy setters Policy setters Layman decision makers Layman decision makers Re-compilations Declarations, data sheets etc. Labels, etc. In fo rm ati o n s yst em Industrial data Industrial data Data on priorities and values Data on priorities and values Environmental data Nature data Tool for LC overview Scientists and experts Scientists and experts Professional decision makers Professional decision makers Policy setters Policy setters Layman decision makers Layman decision makers Re-compilations Declarations, data sheets etc. Labels, etc. In fo rm ati o n s yst em
information system needs to lie in the hands of political and proactive proponents and stakeholders. The following recommendations from the authors of this report are intended for those proponents and stakeholders.
Scope the purpose of the information
Environmental information can be made available in many ways, but if that infor-mation is to be made more readily available in practice, it is important to clearly identify the intended user of the information, how the information is to be used and for what purpose. See section ‘S3 Users’.
Establish and harmonise product life cycle indicators
Section ‘S2 Overview environmental product life cycle performance’ introduced environmental indicators to denote simple environmental information. When indi-cators mean the same thing to different people they can be understood, communi-cated, used for comparison and improvements, etc. This is one reason to harmonise indicators.
The other reason to harmonise indicators is the immense amount of primary data needed to produce the condensed information for an environmental product life cycle indicator. Data availability may be improved if the same primary data are requested by many users for many applications, so that the resources used to ac-quire data are not fragmented, and a steady data demand is built up instead. Examples of ongoing initiatives:
• UNEP/SETAC Life Cycle Initiative18, whose aim is to put life cycle
thinking into practice and improve the supporting tools by means of better data and indicators
• COST Action 53019, where the goal is to bridge the gap between
fun-damental LCA research and the needs of industry for an operational framework and model.
• The Eco Procurement board introduced which maintains agreements within the railway sector.
• The CASCADE20 project, where formats for environmental data have
been integrated with existing and established standards for storage and exchange of material and product data21,22 used in other engineering
disciplines. The project also provides a solution for how nomenclatures can be maintained at different organisational levels.
18
UNEP/SETAC Life Cycle Initiative, http://www.uneptie.org/pc/sustain/lcinitiative/home.htm.
19
COST Action 530, www.empa.ch/cost530.
20
CASCADE, http://192.107.71.126/cascade.
21
International Organisation for Standardisation, ISO 15926 Integration of life-cycle data for process plants including oil and gas production facilities.
22
International Organisation for Standardisation, ISO 10303-235 Materials information for product design and validation (under development).
Provide support concerning methods and tools GENERAL
A large number of methods and tools are available for simplifying environmental overview of product life cycles, but most tools face substantial data availability gaps. Many of the requested methods and tools exist, but the intended users are unlikely to find the most appropriate tool themselves without substantial expert assistance. It is recommended that user needs and existing methods and tools be better matched.
It is also recommended that the methods and tools should provide users and de-cision makers with meaningful environmental indicators, and that different simpli-fications are made for different users, depending on their identity and task. LIFE CYCLE ASSESSMENT
First of all, it should be stressed that a full LCA in accordance with the ISO 14040- series (for instance) is a substantial simplification, since it both limits and struc-tures the work effort to acquire a life cycle overview. Whatever the number of processes surveyed and whatever the number of inventory parameters, impact cate-gories or category indicators, a full LCA will still just provide a simplified envi-ronmental product life cycle overview.
Since there are many ways of simplifying an LCA, it is recommended that the meaning of simplified life cycle assessment or simplified environmental overview product life cycles should be discussed more systematically. There are many sim-plifications to be made regarding data acquisition, level of detail, communication of results, use of results, or tools for making complex LCAs. Hence, ‘simplified LCA’ is too vague a concept.
It is recommended that the use of harmonised environmental product life cycle indicators be distinguished from discussion of LCA methodology and tools. Increased availability of data and information
There are four aspects to be considered to establish common primary data for envi-ronmental overview of product life cycles:
1. Focus on the users and applications for which data should be made available. It is impossible to solve the problem generally.
2. Identify the primary data needed to produce the information requested by and for the intended users and applications.
3. Structure the identified primary data in a general format so that all the methods and tools can share the same primary data sources.
4. Establish a strategic build-up of all necessary primary data, which must be based on well-defined environmental product life cycle indicators. It is recommended that long-term decisions be taken to ensure that data is available for a number of environmental product life cycle indicators significant for global, regional and local environment throughout the world, and for sustainability for future generations. These long term environmental indicators should be fixed at
different strategic levels, such as by the UN and World Bank, by the USA, EU and other regional unions of countries and states, at national level, in industrial sectors and in public procurement and consumption. Indicators should be set to serve as long-term targets to drive action plans towards improved data availability. Coop-eration should be established and expertise should be made available to support synergetic definitions of indicators, so that primary data sources and expertise serve as many purposes and applications as possible.
Since most primary environmental data sources are established on the basis of ad hoc principles for a specific purpose with little or no information system con-texts, and most data sources are incompatible at all levels: technically, conceptually and semantically. It is recommended that international standardisation efforts be supported, so that concepts, terms, common data formats and nomenclatures can be designed to integrate data and information in various systems.
Information system design
International, regional and national cooperation should be established to organise an information system by practical means, e.g. by coordinating competence and supporting harmonisation and standards. It is also recommended that this work be based on a long-term strategy, and that competence capacity be built up via knowl-edge centres, data generators and maintainers, for example. Dedicated capacity of this kind should be assigned to support and work with companies, consultants and software vendors to build up international, sector-independent and interdisciplinary coordination. A combination of business models and defined responsibilities should also be used to focus on supplying environmental information to decision-makers throughout product life cycles.
Clear vision and decisive policies on the part of governmental, industrial and non-governmental leaders will be needed to establish this information system. It is therefore strongly recommended that the proponents and the stakeholders of envi-ronmental information assume joint responsibility for an overall envienvi-ronmental information system.
S7 Initial steps
Introduction
In this section the authors recommend the first steps in improving data availability for environmental overview of product life cycles by establishing common primary data. These recommendations need not be adopted in the order proposed here. The steps should be formulated and implemented to enhance the strategic dimension, increase knowledge, achieve geographical dissemination and to permeate society. It is also anticipated that the absolute mandate of the board may increase over time, with appropriately limited mandates during the initial phase of implementation. A natural starting point is to conduct limited pilot projects in business sectors, or at national or regional level.
Step 1: Policy and competence
The first step is to designate policy makers and establish a responsible board and competence base.
COLLABORATIVE BOARD
Set up a collaborative board (or network or association) of proponents and stake-holders in order to develop rational information systems. The board should be will-ing to take charge and create visions and strategies. The board should establish an information feedback relationship with both professional and lay decision makers.
The board could play a key role in prioritising between tasks, maintaining the strategy, and establishing and securing long-term funding through relations with funding financing institutions and banks. It could also establish, pursue and main-tain necessary standards.
The long-term goal of the board should be to establish and maintain interna-tional collaboration between EPAs, the boards of multinainterna-tional corporations and the academic elite in related fields. The strategy of the board should be to carry out inter-organisational programmes of practical and well-defined
problem-solving/gap-bridging projects e.g. defining a specific indicator, exporting a specific database to common formats, starting a database of specific primary data. The board should also distinguish research from implementation by delegating imple-mentation responsibilities to economically sustainable and sound businesses. Re-search issues must be quickly identified and presented to a strategic academic ref-erence group. Research funding within this domain must be based on problem solving.
There are similarities between the UNEP/SETAC LC Initiative, for example, and this collaborative board, but the differences are that this board
• focuses on simple information for environmental overview of product life cycles for end users, regardless of whether LCA is the method or not;
• considers providing simple information for end users as the primary objective and methods and tools as secondary, while the
UNEP/SETAC LC Initiative has emerged from the methodological point of view adopted by the method developers;
• stresses primary data as the basis for all other information. Acquisition and availability of primary data is not part of the UNEP/SETAC LC Initiative, only highly aggregated LCA data and databases.
In the first place, the work should be carried out within the framework of existing organiations, such as the EU:s Joint Research Center and ISO.
KNOWLEDGE CENTRES
Establish knowledge centres around already existing competence units, selected on criteria such as experience, practical value of the specific skills, potential to grow in the direction of strategic needs, etc. International cooperation and competence
sharing between knowledge centres should be promoted to provide further impetus to the harmonisation processes as well as the sharing of expertise and experience. Step 2: Scope and format
The collaborative board could define scope in terms of which users to address, which applications to consider and which indicators to use to describe environ-mental overview of product life cycles. On the basis of these decisions a common data format can be developed for exchange of data between data sources and meth-ods and tools. The format may be developed by experts assigned to the task at the knowledge centres, and it should be developed jointly with tool developers and data source maintainers. The data format should
• suit all the primary data needed by the intended users; • be based on a general level of primary data;
• allow for relevant documentation;
• be non-redundant, i.e. economical and efficient. Step 3: Infrastructure and information system
On the basis of the indicators selected and defined, the use of the common format to establish infrastructures and communication channels to share data from sources to (first) professional and (then) lay decision makers should be developed. This will entail a great deal of cooperation between data source maintainers, tools de-velopers and informatics experts.
The data source maintainers should be supported as needed, so they can pro-vide the necessary primary data and establish publication routines. Skills needed to aggregate primary data into layers of semi-simple data will also be valuable. These skills are possessed by risk analysts, ecologists, LCA consultants and others. It will also be necessary to find ways of encouraging other providers of information, methods and tools, as well as experts in relevant fields, such as policy makers, data publishers, software developers to develop PCRs, product design criteria, eco-procurement criteria etc.
The result should be a complete mapping of the information system, similar to Figure S.4, for a specific category of users, a specific application and a specific indicator. Each component or module is recognised and each gap is identified. Step 4: Generate new data and maintain knowledge
The board should identify international industries, countries and financiers willing to complete and maintain full life cycle overviews, to improve and maintain data availability and knowledge.
Step 5 and ahead
The board should specify improvement needs and focus on eliminating a few pri-oritised obstacles at a time. The board should allow short time frames for complet-ing projects and constantly assess whether practical success has been achieved. Flexibility, pragmatism and practical achievement are the key to the success of this board, combined with collaboration, consensus and coordination.
Hence, establishing common primary data for environmental overview of product life cycles is a practical process, which can be achieved by determination and successive improvements.
Sammanfattning
S1 Bakgrund
Denna rapport beskriver tillgång till data och information om miljöpåverkan av produkter ur ett livscykelperspektiv och hur de kan göras tillgängliga för berörda intressenter i samhället såsom producenter, upphandlare och medborgare samt ger förslag på hur ett sådant informationssystem för datatillgång skall läggas upp. Syf-tet är att beskriva hur samma data kan användas av flera användare för olika mät-ningar av miljöpåverkan samt för att uppnå samordningsfördelar och kostnadsef-fektivitet, dvs. hur olika datakällor och expertis skall organiseras och hur data skall formateras.
Av rapportens ”gap-analys” framgår att metoder och verktyg för en miljöbe-dömning av produkters livscykler, kräver kostsamma input-data för att få fram viktiga output-data, men alltför få miljödata finns att tillgå. Kostnaden för insam-ling av data är hög. Förståelsen för detta är liten hos experter inom industrin och hos utvecklare och användare av metoder och verktyg. Det finns ingen gemensam definition för ”miljöpåverkan”, konceptet är för brett och databaser och informa-tionssystem är därför ofta uppbyggda med en alltför bred och fri specifikation. Resultatet har blivit att resurserna ändå spenderas, men liten ny kunskap förvärvas. Informationssystemet är inte optimerat för specifika användare och det blir ofta dyrt att attrahera användare till dåligt uppbyggda miljöinformationssystem. Syste-men används kanske därför inte av dem som har behov av dem. Dessa är de huvud-sakliga problemen.
Rapporten innehåller en detaljerad lista över vilka typer av information om produkters miljöpåverkan i ett livscykelperspektiv som olika användare behöver, som t.ex. energibehov, generering av avfall, toxiskt innehåll, möjlighet till återvin-ning etc. Metoder för livscykelanalys (LCA) ges stort utrymme, t.ex. hur skall sammanställning och förvärv av data för fulla LCAs, förenklade LCAs och miljö-varudeklarationer (EPD) gå till, men rapporten är långt ifrån begränsad till enbart LCA-metoder. Även redogörelser för miljöriskbedömning (ERA), inventering av materialinnehåll, design för miljö (DfE) etc. ingår.
Eftersom de flesta produkters miljöpåverkan under livscykeln är global och omfattar många industrisektorer, är inte de studier som gjorts för denna rapport och de förslag som lagts fram, begränsade till enbart Europa eller någon specifik sektor eller produktkategori utan är avsedda att vara internationella och sektoroberoende. Författarna är experter inom området hantering av industrimiljöinformation och har även utfört omfattande litteraturstudier för denna rapport. Referenserna åter-finns som fotnoter genom hela rapporten samt i en komplett referenslista i slutet av rapporten.
S2 Miljöbedömning av produkters livscykler
Figur S.1 visar en produkts livscykel och hur den påverkar miljön. Figuren ger naturligtvis en förenklad bild av en verklig produkts livscykel; en miljöbedömning
av produkters livscykler måste baseras på förenklingar. Förenklingarna måste vari-eras med hänsyn till olika syften och vilka aspekter av miljöprestanda som är av intresse.
I många fall föredras förenklad information i stället för en mer fullständig för olika rapporteringssystem, ledningssystem, metoder och verktyg. Förenklingarna ges olika beteckningar i skilda sammanhang, såsom signifikanta miljöaspekter23,
miljöprestandaindikatorer24, miljökonditionsindikatorer25, kategoriindikatorer26,
datakategorier27, rapporteringsvariabler28,29,30 etc. Olika miljöindikatorer används
för utvärdering av miljöpåverkan av verksamheter, processer, hårdvara eller tjäns-ter31.
Figur S.1. En schematisk bild av produkters miljöpåverkan under livscykeln32. Används med tillstånd. Copyright Raul Carlson och Ann-Christin Pålsson, CPM, Chalmers Tekniska Högskola 1998
Det är svårt att identifiera indikatorer så att de blir signifikanta och begripliga och att kostnaden för anskaffning av nödvändiga underlagsdata och sammanställning av den enkla informationen blir godtagbar33,34. Arbete med att utveckla och välja ut
23
International Organization of Standardization (1997), ISO 14001: Environmental management
sys-tems - Specifications with guidance for use 24
European Commission (2003), 2003/532/EC, Commission recommendation of 10 July 2003 on
guidance for the implementation of Regulation (EC) No 761/2001 25
International Organization of Standardization (1999), ISO 14031: Environmental management -
Environmental performance evaluation – Guidelines 26
International Organization of Standardization (2000), ISO 14042: Environmental management - Life
cycle assessment – Life cycle impact assessment 27
International Organization of Standardization (1997), ISO 14040: Environmental management - Life
cycle assessment - Principles and framework 28
Global Reporting Initiative (2002), Sustainability Reporting Guidelines, http://www.globalreporting.org/guidelines/2002/gri_2002_guidelines.pdf
29
Naturvårdsverket (2002), Planering och utformning av miljöövervakningsprogram, viewed at http://www.naturvardsverket.se/dokument/mo/hbmo/del1/plan/upplagg4.pdf
30
World Economic Forum (2005), 2005 Environmental Sustainability Index – Benchmarking National
Environmental Stewardship 31
Carlson R (2002), Environmental Performance Indicators, Published in INSIGHT, Vol 5 Issue 2 July 2002 p. 22-23, The International Council on Systems Engineering (INCOSE)
32
Carlson R, Pålsson A-C (1998), Maintaining Data Quality within Industrial Environmental Information
Systems; 12th International Symposium 'Computer Science for Environmental Protection' Bremen 1998;
Band 1/Volume 1 p. 252-265
33
Flemström K (2003), Environmental Performance Indicator (EPI), Methodology in REPID, Chalmers Tekniska Högskola, Sverige
34
Carlson, Tivander, Erixon et al. (2004), Conceptual model report, OMNIITOX project report 2004, www.omniitox.net Tillverknings-process Användnings-process Avfalls- hanterings-process Transport Transport Utvinnings-process Utvinnings-process Förädlings-process Transport Transport Naturmiljösystem
Tekniska system som använder och tar hand om produkten Tekniska system som
f tillverkarproduktens Teknisktsystem
som tillverkar produkten Nödvändig råmaterial-utvinning Indirekta avfall
och utsläpp generering ochDirekt avalls-utsläpp
material och resurser
Indirekta avfall och utsläpp
bra och representativa indikatorer för att definiera miljöindikatorer35 pågår inom många organisationer världen över, t.ex. inom ISO, OECD, EU, GRI, WEF och WBCSD.
Innehållet och utformningen av denna rapport bygger på idén att komplex mil-jöinformation inte är tillräcklig för att ge allmänheten information om produkters miljöpåverkan ur ett livscykelperspektiv, i stället måste förenklad miljöinformation som t.ex. miljöindikatorer, användas. Samråd med olika användare om deras behov och krav ligger därför till grund för denna rapport.
S3 Användare
Alla är potentiella användare av miljöinformation. För att rapporten skall tjäna ett praktiskt syfte måste dess omfattning begränsas. Eftersom det internationella åta-gandet för hållbar utveckling är väl känt genom Agenda 2136, är denna internatio-nella överenskommelse en naturlig utgångspunkt för att begränsa omfattningen. Användningen av miljöinformation syftar till hållbar utveckling och användare av miljöinformationen strävar efter att fatta beslut som främjar sådan utveckling, dvs. som förbättrar den miljömässiga påverkan av produkternas livscykel.
Figur S.2 beskriver den generella användningen av miljöinformation för att ge en vision om ett hållbart industrisamhälle så att människor genom olika beslut kan kontrollera produkters miljöpåverkan genom livscykeln. Om beslutsfattaren får tillgång till miljöinformation om konsekvenserna av sina beslut, kanske han kan ta ett större ansvar.
Figur S.2 En schematisk bild som visar att kontrollanter och beslutsfattare måste förstå det sy-stem de kontrollerar, för att kunna navigera mot en hållbar utveckling. De behöver också feedback om konsekvenser samt både visionära och kortsiktiga mål. Copyright Carlson R. och Pålsson A-C, CPM, Chalmers Tekniska Högskola, 1998. Använd med tillstånd. Det kan finnas flera olika skäl till att begära miljöinformation och i denna rapport har vi valt ut fem specifika skäl som bas för de analyser, rekommendationer och förslag som ingår i rapporten;
• Köp av produkter; att bedöma en produkt från utgångspunkten att bli ägare av exempelvis en produkt eller anordning.
• Design av produkter; att bedöma en produkts design med utgångspunkt i hur den kan förbättras.
35
General environmental indicator links can be found at: http://www.pepps.fsu.edu/EI_Gen.html
36
UN (1992), Agenda 21, available at http://www.un.org/esa/sustdev/documents/agenda21
Controlled system
Controlled system Environmental
impact Current status Control Goal Controller Sustainable industrial society Controlled system
Controlled system Environmental
impact Current status Control Goal Controller Sustainable industrial society
• Analysera innehållet i en produkt; att bedöma en produkts materialinnehåll med hänsyn till materialens konsekvenser för miljön.
• Bedöma risker med produkter; att bedöma en produkt ur potentiell risksyn-punkt eller dess förmåga att orsaka skada under livscykeln.
• Produkters konsekvenser för samhället; att bedöma en produkt baserat på miljöpåverkan från storskalig framställning av produkten.
Rapporten ger många exempel på dessa användningsområden av miljöinformation från hela världen och en mängd olika sektorer. Beroende på vem användaren är, kan emellertid informationsbehov och krav vara mycket olika. För att strukturera dessa skillnader, definieras fyra användarkategorier av miljöinformation baserat på referensmaterial; miljöforskare och experter, politiska ledare av olika slag, profes-sionella beslutsfattare och lekmän i deras dagliga verksamhet. Användarkategori-erna har valts ut för att vara oberoende av industrisektor och produkttyp.
Alla dessa användare av miljöinformation har varierande krav på information och använder den på olika sätt; miljöforskare och experter kräver t.ex. mycket detaljerade fakta och använder informationen för att ta fram nya kunskaper. Poli-tiska ledare behöver också detaljerad information men i lättanvänd form, för att kunna definiera regler och sätta upp ramar för åtgärder. Båda dessa användarkate-gorier producerar således ny information i stället för att fatta direkta beslut om den fysiska världen. Professionella och övriga beslutsfattare använder informationen som underlag vid beslut om hårdvara och de fysiska konsekvenserna av inköp av varor och tjänster.
Genom att kombinera de fyra användarkategorierna med figur S.2, framgår att denna rapport huvudsakligen riktar sig till professionella beslutsfattare och lekmän i beslutsfattande ställning, för att tillgodose deras behov av information i den dag-liga verksamheten. Speciellt dessa användarkategorier behöver enkel information av olika slag, såsom beskrivs i ovanstående sektion ”S2 miljöbedömning av pro-dukters livscykler”.
S4 Metoder och verktyg
För att ta fram enkla miljöindikatorer måste först detaljerade underlagsdata samlas in och sammanställas med hjälp av olika metoder och verktyg. Mätningar eller modelleringar ger underlagsdata på låg nivå, vilka sedan sammanställs till exem-pelvis utsläpps-, toxicitets- och miljökonsekvensdata etc. Dessa data kan användas med t.ex. en LCA-metod eller verktyg enligt ISO standarder och studiens resultat kan sammanställas till exempelvis en miljöproduktdeklaration eller en viktad livs-cykelindikator enligt någon metod för bedömning av påverkan.
Användning av metoder och verktyg enligt denna ordning visas i figur S.3, där beslutsfattarna är slutanvändare av olika enkla resultat som erhållits med metoder och verktyg avsedda för kommunikation av t.ex. LCA-resultat. I den löpande ked-jan av metoder och verktyg finns behov av ett stort antal stödverktyg för att samla in och behandla data, såsom databaser, metoder för gap-analys, rutiner för inventer-ing av produktmaterial och olika datainmatninventer-ingsverktyg.
LCA och ERA betraktas som expertverktyg och är inte avsedda att ge direkt användbar information till beslutsfattare. Det betyder t.ex. att förenklade LCAs inte skall ses som lätta att förstå utan endast lätta att använda. Det finns emellertid många sätt att förenkla LCA, från allmänt uppbyggda LCI databaser, enkel kom-plett LCA-mjukvara, pre-fab cradle-to-gate samt databaser med utgångna produkt-typer, användning av redan tillgänglig statistik med I/O-analys, kommunikation via EPD system, förenklade screening LCAs etc. Det finns även metoder där hela LCA enbart visas som miljöindikatorer för en produkts livscykel, som är lätta att använ-da och förstå för beslutsfattare. Det bör understrykas att även en fullständig LCA är en väsentlig förenkling, eftersom den både begränsar och strukturerar arbetsinsat-sen för att göra en livscykelbedömning.
Figur S.3. Verktygen är grupperade efter deras avsedda användning; stödverktyg, expertverktyg och kommunikationsverktyg. Expertverktyg och metoder ger svar på beslutsfattarnas frågor och behov. Stödverktygen matar in information till expertverktygen. Metoder och verktyg för teknisk dialog används för att göra resultaten från expertverktygen begripliga för beslutsfattarna.
Den allmänna rekommendationen för hur olika förenklade metoder och verktyg skall användas, speciellt LCA-metoder och verktyg, baseras på att förenklingen skall anpassas till användarens behov. Exempelvis, är en fullständig LCA en bra metod för att stödja och förenkla en strukturerad uppbyggnad av ny kunskap om en produkts eller ett besluts miljölivscykel. Enkla LCA-verktyg som mjukvara eller screening-verktyg, kan tillämpas inom organisationer där användare kan lita på att bakgrundsinformationen och den förenklade metodiken är anpassade till sitt speci-fika ändamål inom organisationen. Exempel på detta är design- och inköpsavdel-ningar. Såväl en fullständig som en förenklad LCA är svår att kommunicera till
Econ. data EPI result Env. data
LCA ERA etc
EPD etc M ethod s an d t o ol s for te chn ic al di al o g u e Information input to expert tools and
methods Ex p ert tool s and me th o d s S u pp or t t o o ls Material inventory Data input tool etc Gap analysis
Different primary data, needed to produce input to expert tools and methods
Decision makers
Results and reports
Requests and needs
Econ. data EPI result Env. data
LCA ERA etc
EPD etc M ethod s an d t o ol s for te chn ic al di al o g u e Information input to expert tools and
methods Ex p ert tool s and me th o d s S u pp or t t o o ls Material inventory Data input tool etc Gap analysis
Different primary data, needed to produce input to expert tools and methods
Decision makers
Results and reports
personer som inte har deltagit i processen för användning av metoden eller verkty-get. LCA-verktyg baserade på I/O metoden är praktiska eftersom de kan använda allmänt tillgängliga statistiska data. Den största svagheten är att de inte är lika intu-itivt begripliga som LCA. LCA är lätt att förstå för vem som helst, även om det är ett komplicerat arbete att utföra en fullständig LCA. Nationell statistik och I/O-analys är komplexa och kan vara svåra att kommunicera.
Följaktligen, kan förenklade metoder och verktyg som LCA användas om för-enklingen anpassats till situationen. Detta gäller såväl för SME som för stora före-tag, stater eller i internationella samarbeten. SME bör söka metoder och verktyg som är lätta att använda, tolka och delge och dela kostnaderna med t.ex. andra SME eller större företag. Offentligt finansierade initiativ och större företag bör söka strukturerade sätt att dela data och information, t.ex. genom att söka en har-monisering av miljöprestandaindikatorer.
S5 Data, tillgång och informationssystem
Figur S.2 visar att underlagsdata om aktuell status måste kommuniceras som miljö-information till beslutsfattare och regelbundet uppdateras. Vissa metoder och verk-tyg uppdaterar den aktuella statusen väldigt sällan, t.ex. uppdateras LCI databaser och LC metoder för bedömning av miljöpåverkan ofta inte alls eller endast vart 5 till 10 år. Vanliga EMS-system uppdaterar den aktuella statusen minst en gång om året i den årliga miljörapporten. Oavsett hur ofta uppdatering sker, kan inte meto-der och verktyg för bedömning av produkters miljöpåverkan ur ett livscykelper-spektiv förenklas längre än till nödvändiga underlagsdata.
Miljöunderlagsdata är dyra och stora mängder krävs för en mängd material, ut-släpp, produkter, produktionsställen, geografiska platser och olika miljöförhållan-den. Det finns stora ekonomiska fördelar med att samordna insamlingen av miljö-underlagsdata och dela datakällor. Således är upprättande av gemensamma under-lagsdata för miljöbedömning av produkters livscykler, en viktig ekonomisk strategi för hållbar utveckling i allmänhet och för varje lokalt miljöledningssystem vid produktionsanläggningar, liksom för kommuner, samhällen, företag, stater och internationell samverkan.
Denna rapport beskriver hur ett gemensamt format för underlagsdata för en mängd olika metoder och verktyg kan struktureras. Formatet medger delning av data för LCA, ERA, EMS, DfE etc. Rapporten listar också många tillgängliga käl-lor till underlagsdata som kan användas för att tillhandahålla data till de olika me-toderna och verktygen. För att tydligare visa varför befintliga datakällor inte tillgo-doser alla behov, undersöks datatillgången på ett strukturerat sätt genom att föra in 6 dimensioner av tillgänglighet:
• Förekomst, dvs. huruvida just denna typ av data någonsin har strukturerats. • Täckning, dvs. i vilken omfattning data täcker de exakta behoven.
• Begriplighet, dvs. huruvida data har dokumenterats så att de kan tolkas av en användare.
• Underhåll, dvs. huruvida det finns någon att kontakta för att få mer infor-mation om data.
• Tillgång, dvs. huruvida data faktiskt är tillgängliga för dataanvändaren med hänsyn till kostnad, sekretess etc.
• Formatering, dvs. huruvida data är uppdelade på olika dataområden i do-kumentationen eller om de endast är tillgängliga som fri text i litteratur el-ler strukturerade i databaser.
Figur S.4 En förenklad översikt över uppläggningen av ett informationssystem för en bedömning av produkters miljöpåverkan på samhället ur ett livscykelperspektiv.
Figur S.4 beskriver tillgängliga datakällor, olika metoder, verktyg och användarka-tegorier som anges i sektion ”S3 Användare”. Denna organisation av underlagsda-ta, metoder, verktyg och användare utgör ett informationssystem. Informationssy-stemet är inte begränsat till geografiskt läge eller geografisk distribution. Avsikten är att datakällorna skall finnas på flera platser i världen, nära olika platser för ut-vinning av råvaror, transportvägar och produktionsanläggningar som är relaterade till en produkts livscykel. Läsaren bör beakta att uppdateringen inte sker så ofta och att informationen skall hanteras därefter.
Organisationen av datakällor och andra resurser i ett informationssystem be-skrivs utförligt i rapporten, för att framhålla de viktigaste punkterna för att göra data tillgängliga för miljöbedömning av produkters livscykler.
Samordning av data- och informationsbehov är viktig liksom ett gemensamt format och en gemensam övergripande struktur. Dessa frågor tas upp i rekommen-dationerna i nästa sektion.
Industrial data Industrial data Data on priorities and values Data on priorities and values Environmental data Nature data Tool for LC overview Scientists and experts Scientists and experts Professional decision makers Professional decision makers Policy setters Policy setters Layman decision makers Layman decision makers Re-compilations Declarations, data sheets etc. Labels, etc. In fo rm at io n s yst em Industrial data Industrial data Data on priorities and values Data on priorities and values Environmental data Nature data Tool for LC overview Scientists and experts Scientists and experts Professional decision makers Professional decision makers Policy setters Policy setters Layman decision makers Layman decision makers Re-compilations Declarations, data sheets etc. Labels, etc. In fo rm at io n s yst em
S6 Rekommendationer
Som nämndes i sektion ”S3 Användare” utgör professionella och övriga beslutsfat-tare de viktigaste användarna av informationssystemet. Dessa användare har emel-lertid inte intresse av hela miljöansvarskonceptet och hållbar utveckling utan är inriktade på beslut. Ansvaret för att upprätta ett informationssystem skall vila på politiska och proaktiva förespråkare och intressenter. Följande rekommendationer vänder sig till dessa förespråkare och intressenter.
Fastställ ramar för information
Det finns flera sätt att göra miljöinformation tillgänglig, men för att göra praktiska förbättringar av tillgången är det viktigt att klart ange vem informationen är avsedd för och hur den skall användas och för vilket ändamål. Jämför med sektion ”S3 Användare”.
Upprätta och harmonisera indikatorer för produkters livscykler I sektion ”S2 Miljöbedömning av produkters livscykler”, introducerades miljöindi-katorer som beteckning för enkel miljöinformation. När indimiljöindi-katorerna betyder samma sak för olika personer kan de förstås, diskuteras och användas i jämförelser och förbättringar etc. Detta är ett skäl för att harmonisera indikatorerna.
Det andra skälet för att harmonisera indikatorerna är den enorma mängd under-lagsdata som krävs för att framställa den komprimerade informationen i en miljö-indikator för en produkts livscykel. Tillgången till data kan underlättas om samma underlagsdata efterfrågas av många användare för en mängd applikationer så att arbetet med datainsamlingen inte splittras utan en stadig efterfrågan på data byggs upp.
Exempel på pågående aktiviteter är:
• UNEP/SETAC Life Cycle Initiative37 som syftar till att omvandla
livs-cykeltänkandet till praktisk handling och förbättra stödverktygen ge-nom bättre data och indikatorer.
• COST Action 53038 där målet är att överbrygga klyftan mellan
grund-läggande LCA-forskning och industrins behov av fungerande riktlinjer och modeller.
• Eco Procurement board har ingått avtal inom järnvägssektorn.
• CASCADE39 projektet där format för miljödata har integrerats i
existe-rande standarder för lagring och utbyte av material- och produktda-ta40,41 som används inom andra tekniska områden. Projektet tillhanda-håller också en lösning för hur nomenklaturer kan bibehållas på olika organisationsnivåer.
37
UNEP/SETAC Life Cycle Initiative, http://www.uneptie.org/pc/sustain/lcinitiative/home.htm
38
COST Action 530, www.empa.ch/cost530
39
CASCADE, http://192.107.71.126/cascade
40
International Organization of Standardization, ISO 15926 Integration of life-cycle data for process plants including oil and gas production facilities
41
International Organization of Standardization, ISO 10303-235 Materials information for product design and validation (under development)