This is a published version of a paper published in Nordic Pulp & Paper Research
Journal.
Citation for the published paper:
Alam, M., Thim, J., Manuilskiy, A., O'Nils, M., Westerlind, C. et al. (2011)
"Investigation of the surface topographical differences between the Cross Direction and
the Machine Direction for newspaper and paperboard"
Nordic Pulp & Paper Research Journal, 26(4): 468-475
Access to the published version may require subscription.
Permanent link to this version:
http://urn.kb.se/resolve?urn=urn:nbn:se:miun:diva-15060
Investigation of the surface topographical differences
between the Cross Direction and the Machine Direction
for newspaper and paperboard
Anzar Alam, Jan Thim, Anatoliy Manuilskiy, Mattias O’Nils, Christina Westerlind, Johan Lindgren and Joar Lidén. KEYWORDS: Paper surface measurement, Roughness
measurement, Surface topography, Optical measurement, spectral analysis, Cross Direction (CD), Machine Direction (MD), Paperboard, Newspaper
SUMMARY: Paper and paperboard surface quality is
constantly being improved by the industry. This improvement work deals with the essential fact that the surface topography must be measured, both in relation to offline and online measurements for the manufactured products. Most measurements relating to surface topography (especially online) are performed either in the machine direction (MD) or in the cross direction (CD). It has been the opinion of SCA Ortviken AB and Iggesund Paperboard AB that the surface topography amplitudes are almost always higher in the CD than in the MD, for their products which consist of newspaper and paperboard. This article aims to investigate the rela-tionship between the CD and the MD surface topography amplitudes for a wide range of spatial wavelength for both newspaper and paperboard. The tests and investiga-tions have been conducted using an FRT Microprof profilometer within the range 20 µm up to 8 mm, and the results confirm that the surface topography amplitudes are higher in the CD for most of the shorter spatial wavelength within this range. The results also show significant differences between measurements for different paper qualities, suggesting a requirement to investigate the relationship between the CD and the MD topography for all paper and paperboard qualities of interest for a paper or paperboard mill, before a decision is made in relation to a measurement method.
ADDRESSES OF THE AUTHORS: Anzar Alam
(anzar.alam@miun.se), Jan Thim (Jan.Thim@miun.se) ,
Anatoliy Manuilskiy (Anatoliy.Manuilskiy@miun.se)
and Mattias O’Nils (Mattias.Onils@miun.se): Mid Sweden University, Department of Information Technology and Media, SE-851 70, Sundsvall, Sweden.
Christina Westerlind (Christina.Westerlind@sca.com): SCA R&D Center Sundsvall, Sweden. Johan Lindgren (Johan.Lindgren@iggesund.com): Iggesund Paperboard
AB, Iggesund, Sweden. Joar Lidén
(joar.liden@sca.com): SCA Ortviken AB, Sundsvall,
Sweden.
Corresponding author: Anzar Alam
There are constant attempts by the paper and paperboard industry to improve the quality of their manufactured products in order to provide a high perceived surface quality once the products have
undergone printing. The surface topography is the very essence of the process in relation to the con-sumption, absorption and the spreading of inks on paper during printing (Vernhes at el. 2008, Aguilar et al. 2009, Pino et al. 2010). By knowing the true surface topography, an accurate quality measure of the manufactured product can be extracted and it is also possible to obtain an estimation relating to the relationship between basepaper/baseboard and coated paper/paperboard, thereby enabling an optimization of the coating process. Therefore, paper and paperboard manufacturers are interested in achieving reliable and accurate paper surface measurements. Paper topography measurements is also of interest during the printing and the post printing process, where the paper and paperboard products undergo changes on the product surface due to the printing process (Engstroem, Morin 1994; Åslund et al. 2004).
There are various methods for the measurement in relation to topography, including air leakage (destructive type), mechanical (Stylus: contact based), scanning electron microscopy (SEM), atomic force microscopy (AFM), laser optical scanning and photometric stereo (Barros, Johansson 2005). The majority of the applications for these methods are used in relation to offline measure-ments, with a few exceptions that are designed for online use, such as Honeywell’s FotoSurf device and the OnTop device using a line of light triangulation (Thim et al. 2008). The majority of these methods work in a satisfactory manner in those cases where the differences in the topography of the surfaces are large but difficulties do arise in the evaluation of paper surfaces which have very small topographical differences (Singh 2008). Furthermore, many of these techniques target a very limited wavelength spectrum and thus there remains the requirement for a topography measurement method which produces measurement data for a wide range of wavelength.
In the majority of the existing wavelength based measurement methods for paper and paperboard, particularly for online methods, adjacent points of measurement on the surface form a vector of values, which is processed using a Fourier transform in order to extract the frequency (f) and wavelength (λ)
information. This means that the measurements reflect either the topography in the machine direction (MD) or the topography in the cross direction (CD). In an offline measurement system, however, where the acquisition time is not crucial, adjacent measurement points can be obtained in both the CD and the MD, forming a two dimen-sional matrix of values that can be processed by a frequency transform. In an online measurement system the measuring device is fitted in a paper manufacturing machine and the paper web moves at high velocity. The fact is that the resolution of the online measurements should be sufficiently high so as to distinguish individual wood fibers. In order to reach accurate measurements for paper roughness, the online acquisition of a whole surface matrix becomes very difficult. Because of this, for online measurements there is usually only time for the extraction of a line vector, which results in a choice whether to extract a vector in the MD or in the CD.
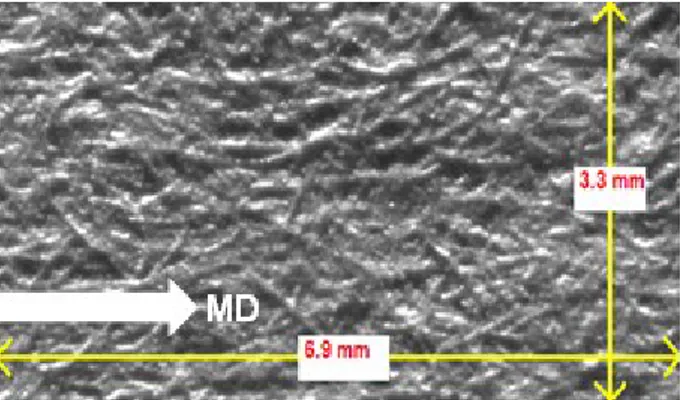
There are two major characteristics that influence the differences between the paper topography in the MD and the paper topography in the CD; wood fiber orientation (anisotropy) for shorter wavelength (Telschow, Deason 2002, Fiadeiro et al. 2002) and shrinkage waviness and cockling (Tydeman et al. 1966) for the longer wavelength. It has been stated that fiber orientation measurements are a key to discovering the quality of paper or paperboard (Paavola 2009). The paper structure/fibers tend to align in the MD rather than in the CD (Asplund 2011, Kwong, Farnood 2007, Kulachenko et al. 2007), shown by Fig 1.
It has been the opinion of SCA Ortviken AB and Iggesund Paperboard AB that the surface topography amplitudes are almost always higher in the CD than in the MD, for their newspaper and paperboard products. In this article the differences of the paper topography in the CD and the MD for newspaper and for paperboard have been studied. The results are compared in terms of the wavelength spectra. Measurements were taken for a number of samples in wavelength ranging from 20 µm to 8 mm.
Fig 1. figure shows the fiber orientation in one of the samples.
Materials and Methods
Sample Details
A total of 20 samples, each of size 60 by 60 mm, were selected for a comparison of 4 different groups of papers where the topography of each group differs from each other significantly. The samples are listed in Table 1.
The paperboard manufacturers involved in this project are interested in the surface characterization of their coated paperboard rather than on their uncoated paperboard. This is why in this study the number of coated paperboard samples was larger than the number of uncoated paperboard samples. The samples in group 4(a) are those taken from the edge of the paperboard web while the samples in 4(b) were taken from the middle of the web. The reason why there are samples both from the edge and the middle of the reel is to test the samples with very small differences of topography, and it is commonly known that the level of topography in general is higher at the edge position due to shrinkage during the production steps. The paperboard samples were provided by Iggesund Paperboard AB, Iggesund, Sweden whereas the newspaper and LWC samples were provided by SCA Ortviken AB, Sundsvall, Sweden.
FRT Profilometer
The measurements for the samples listed in Table 1 were obtained from an FRT (Fries Research & Technology GmbH) profilometer, MicroProf®. The FRT profilometer has a maximum resolution of 1 µm in the x and y directions and 10 nm in the z-direction. However, the measurements in this study were taken when the resolution was set to 10 µm in the x and y directions. The profilometer is equipped with a CCD optical sensor and scanning mechanism. The scan matrix was 6000 by 100 pixels. This means that each horizontal line, containing 6000 points (pixels), makes one line profile. The distance between the pixels is 10 µm and 6000 pixels were scanned horizontally resulting in a total length of line that is 60 mm. Such 100 lines were created by scanning 100 times vertically down with an equal spacing of 0.6 mm. Hence the physical area of the paper surface covered in the measurement was 60 by 60 mm.
Table 1. Samples Details.
Sample Groups Description Surface No. of samples
1 Paperboard Uncoated 2 2 Newspaper Uncoated 5 3 LWC Coated 5 4(a) 4(b) Paperboard (edge web) Paperboard (Middle web) Coated Coated 4 4
Surface roughness, waviness and cockling
Paper surface topography, in a broad sense, can be divided into roughness and waviness. Specifically, the surface of a paper is considered as the linear superposition of roughness, form, waviness, and surface flaws, according to the American National Standard (ASME B46.1-2002). Surface measurements consist of a range of spatial frequencies. The higher frequency ranges are termed as roughness while the lower frequency ranges are termed as waviness (Raja et al. 2002). Reis and Saraiva (2010) describe roughness as a fine length-scale phenomenon, which is generally length-scaled between 1 m to 1 mm and waviness is scaled above 1 cm. From 5 mm to onward cockling can exist which is usually overlaid by waves of waviness, however, these ranges can vary depending upon the type and material of the sample under tests. Fig 2 shows the difference between roughness and waviness for a particular topographical profile. In this case, the top profile is the total topographical profile. The middle profile shows the low frequency content, referred to as the waviness on the paper surface. The bottom profile shows the high frequency content, which represents the roughness of the total profile.
Paper exhibits hydrophilic properties (Åslund et al. 2004). The huge increase of moisture contents during the pre-drying process of paper causes the expansion of the fibers while the post-drying process causes the contraction of these fibers. The non-uniform expansion and contraction pheno-menon creates various types of out-of-plane surface irregularities, where one of them is cockling (Gepp et al. 2009, Lipponen et al. 2009,). Cockling is usually irregularly distributed on the surface and also depends on the local fiber orientation (Leppänen at el. 2008). Waviness, on the other hand, is the result of an almost uniform distribution pattern usually caused by vibration, chatter, heat treatment, wrapping strains (Thomas 1982) and inappropriate tensions on the paper web. Cockling and waviness are easily observable when paper is out of the machine web. Waviness is described to have lower frequency deformations of the paper surface compared to cockling. Niskanen (2008) describes cockling as 5 to 50 mm in-plane random deformations in diameter with out-of-plane deviations about 1 mm in the z direction. During the manufacturing and the printing process significant cockling can occur in thin papers whereas it has less affect on thick papers.
Processing of the raw data.
Each sample of paper and paperboard was scanned both in the MD and the CD by the FRT
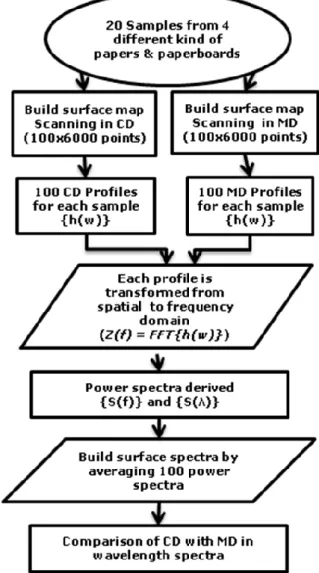
profilometer. The method of analysis adopted in this study is presented in the flow chart in Fig 3.
To analyze the surface profile in detail pixel by pixel the profile is first transformed from the time domain to the frequency domain by applying a Fast Fourier Transform FFT, so that each frequency component present in the profile can be considered in the surface topography calculations.
If “h(w)” is the spatial input topography profile along the width of the paper (either in the CD or the MD) then the FFT of the input signal returns the frequency spectrum Z(f) in the frequency domain.
Fig 2. The figure shows the total profile (top plot) and relationship between waviness (middle plot) and roughness (bottom plot). Length of scanned line is on horizontal axis while height of profile is on vertical axis.
Z(f) = FFT{h(w)} [1] Z(f) contains the surface height information in all possible frequency components both in real and imaginary parts. To calculate the power of the topo-graphy height at each frequency, the power spectrum was calculated as a product of the frequency spectrum Z(f) and the complex conjugate of Z(f). Hence, the power spectrum S(f) is defined as the power of the input signal per unit frequency and is mathematically represented as;
[2] where,
is the complex conjugate of Z(f).
The power spectrum calculations were repeated for all of the 100 vertically scanned lines and the average of all spectra was determined. The average power spectrum S(f) which was as a function of frequency (f) was further converted to S(λ) as a function of wavelength (λ), where λ is defined as;
λ = 1/ F [3]
Here F is number of pair of lines per mm (lp/mm). Range of F was found 0.017 – 50 lp/mm taking into account that length of scanned line was 60 mm and resolution of scanned line was 10 µm. In this study, however, the focus was on wavelengths in the 20 µm to 8 mm range to guarantee accuracy and reliability of the results. The wavelength power spectrum S(λ) contains a large number of wavelength components which when plotted, yields a figure that more resembles a surface than a line . Therefore, to make the wavelength spectra easier to read and compare, these large numbers of wavelength components are grouped into a smaller number of wavelength bands. The banded wavelength power spectrum can be defined as the integral of wavelength power spectrum over a small number of consecutive wavelength intervals. Finally the CD and the MD banded power spectra were plotted on the same graph for comparison purposes. The wavelength components are on the x-axis while the surface topographical heights in the wavelength power spectrum are on the y-axis. The power spectrum is also termed as variance spectrum in µm2
unit. The final result shows which direction of measurement has the higher variance value along the wavelength spectrum.
Measurement considerations
It is important to mention that the FRT profilometer has a vacuum table to hold the sample in place. This will have a significant influence on the longer wave-length measured (above 10 mm), especially if the
side of the paper/paperboard facing the vacuum table is uncoated and is thus subjected to a greater extent to deformations than a coated surface would be.
Results
Fig 4 shows the surface measurements in wave-length bands for all the 20 samples. The graph consists of four different groups of papers, uncoated paperboard, uncoated newspaper, LWC and coated paperboard. The graph classifies and clearly distinguishes between the four groups of papers on the basis of the surface amplitudes in the variance. The roughest surface is for the uncoated paperboard which has the highest variance amplitudes in relation to the irregularities on the surface while the smoothest surface is for the coated paperboard samples having the minimum surface irregularities.
Relative percent difference calculation between CD and MD
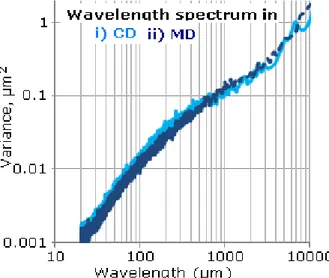
Fig 5 is a plot of the wavelength spectra for the measurements in the CD (i) and the MD (ii) for one of the uncoated board samples. This plot shows that the difference between CD and MD is very subtle, but is indeed noticeable. To evaluate the quantitative differences between the CD and the MD in order to compare the surface qualities throughout the length of the spectrum, Relative Percent Difference between the two power spectra were calculated and compared with each other in this study. The next plots have been drawn in terms of the relative percent difference.
The Relative Percent Difference in CD vs. MD =[(S(λ)_CD – S(λ)_MD)÷S(λ)_CD]*100 [4] where S(λ)_CD = variance of profile in the CD
S(λ)_MD = variance of profile in the MD The aim of this investigation is to find out the differences of topographical level if the sample is measured both in the CD and the MD. The relative percent differences between the CD and the MD for each sample were calculated and plotted. The results are presented for the four different groups of papers. The difference between the measurements of these two directions can easily be visualized. It is thus possible to evaluate the differences between the CD and the MD surface topography. In the relative percent difference plots, the values greater than zero indicate that measurements in the CD can extract a higher level of topography from the same surface as compared to the measurement if it would have been done in the MD.
(a)
(b)
Fig 4. Comparison of all 20 samples. The plot sorted all samples in four different categories which are correlating clearly by the samples group as listed in Table 1. Samples in group 1 being the roughest shows the highest surface height while on the other end the samples of group 4 being the smoothest have the lowest height throughout the entire wavelength spectrum. Fig (a) is for CD while (b) for MD.
Uncoated Paperboards
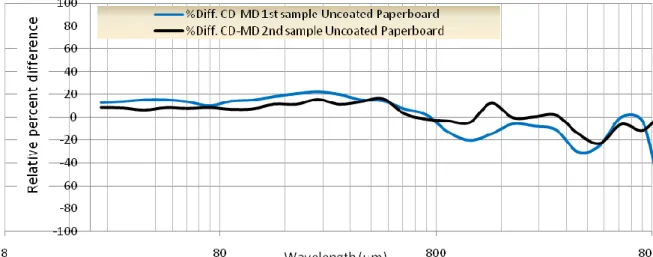
The relative percent difference graph is presented in Fig 6. This plot clearly distinguishes the measure-ments in both the directions. It can be noted that from wavelength 20 µm to 500 µm, the CD measu-rements always have a higher value (about 15%) in relation to the surface topography as compared to that for the MD. On the other hand, from 700 µm to 8 mm the trend average shows that MD measure-ments are gaining higher surface topographical value than those for the CD.
Fig 6. The Relative percent difference in the CD and the MD for uncoated paperboard samples.
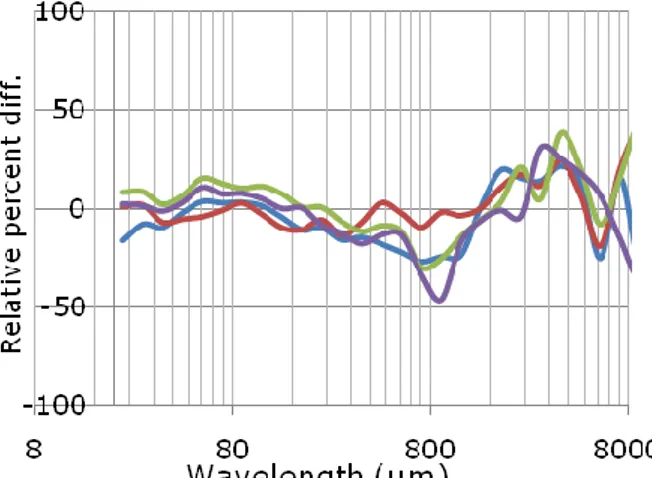
Fig 7. Newspaper uncoated: CD-MD Relative percent difference.
Newspaper samples.
The plot of the newspaper samples is presented in Fig 7. It can be stated, roughly, that for such kind of papers the CD measurements yield higher topo-graphical amplitudes than those of the MD within the range 20 µm to 4 mm with some exception from 800 µm to 950 µm. However beyond 4 mm the measurement results are fluctuating and unclear.
Lightweight Coated paper (LWC)
Fig 8 characterizes the LWC paper samples. These paper samples show a topography similar to those of the newspaper samples.
Coated Paperboard
The coated paperboard consists of samples from the edge web and from the middle web as mentioned in Table 1. Fig 9 is a relative percent difference plot for the edge paperboard samples, where the shrinkage in the CD is large, resulting in high values of relative percent difference, in the wavelength range 20 µm to 1 mm (except from 90 to 110 µm ) since the level of topography in the CD is considerably larger (about 15-20%) than the level of
Fig 8. (LWC papers): CD-MD Relative percent difference.
Fig 9. Edge web coated board: CD-MD relative percent differences.
topography in the MD. In contrast to this the relative percent difference for the middle web samples as shown in Fig 10, in the wavelength range 20 to 90 µm, seems very close to zero. However, for middle web samples a few valleys and peaks beyond the wavelength of 500 µm can also be observed.
Fig 10. Middle web coated board: CD-MD relative percent differences.
Discussion and conclusions
This article investigates the topography height differences in the CD and the MD of four different grades of papers and paperboards. Close similarities are found in the shorter wavelength range 20 µm to 500 µm among uncoated paperboards, uncoated newspapers and LWC where the CD topography levels are higher than MD. Again the topographical similarities for these grades of papers and paperboards started with the dip in the MD from 500 µm wavelength. For the edge-web coated paperboards the higher topography in the CD were found in the shorter wavelength from 20 to 90 µm whereas for the samples of middle-web coated paperboards the relative percent difference in the CD and the MD is close to zero for shorter wave-length up to 90 µm. The dip for the majority of the measurements in the MD at different wavelength ranges depending upon the paper quality grades, suggests an increase in the topography height in the MD for this specific wavelength band. This could be explained by the fact that the wood fibers in the majority of cases align in the MD, and those fibers in the length direction could influence these wavelengths, which will have a particular effect on the measurements of the uncoated surfaces.
The results vary between paper and paperboard qualities, which suggests that this type of investigation is required to be performed on each specific paper and paperboard quality before any decision is taken in relation to a measurement method (especially online), for measurements in either the CD or the MD. These types of measurements can also contribute to estimate the tendency of fiber orientation along the CD and the MD.
Since there are substantial differences in the CD and the MD topography amplitudes, performing measurements in both the CD and the MD, forming
a surface matrix, could prove to be beneficial in characterizing the surface quality of a paper or a paperboard. This, however, can be difficult to achieve in an online situation because of the high velocities of the paper webs and the large amount of data that would have to be gathered and processed in real-time.
Acknowledgements
Knowledge Foundation, SCA Ortviken AB, Sundsvall and Iggesund Paperboard, Iggesund are gratefully acknowledged for their financial and technical support. Thanks to Professor Bengt Oelmann, Mid Sweden University, Sundsvall Sweden for his great moral help and departmental support in order to maintain the motivation for research.
Literature
Aguilar, J. R., Arenas J.P. and Salinas, R. (2009): Friction
noise technique for the measurement of surface roughness of papers, Applied Acoustics, 70(9), 1235-1240.
Åslund, P., Johansson, P.-Å. and Blohm, E. (2004):
Photometric method for dynamic measurements of paper roughening after a moistening printing nip , Nord. Pulp Paper Res. J., 19(4), 460-465.
ASME B46.1-2002 (2002): Surface Texture, Surface
Roughness, Waviness and Lay. An American National Standard, the American Society of Mechanical Engineers.
Asplund, G, (2011): Local fibre orientation in paper forming,
KTH Research Project Database, Paper Tech. http://researchprojects.kth.se/index.php/kb_1/io_8548/io.html
Barros, G.G. and Johansson, P. -Å (2005): The OptiTopo
technique for fast assessment of paper topography –Limitatios, applications and improvements, J. Imaging Sci. Tech., 49(2), 170-178.
Engstroem, G. and Morin, V. (1994): Quantitative description
of the increase in surface roughness of the base paper during coating, Nord. Pulp Paper Res. J., 9(2), 106-110.
Fiadeiro, P.T., Pereira, M.J.T., Jesus, M.E.P, Jesus, M.E.P, and Silvy, J.J. (2002): The surface measurement of fibre
orientation anisotropy and misalignment angle by laser diffraction, J. Pulp Paper Sci., 28(10), (669KB).
Gepp, S., Örtegren, J., Hägglund, J.-E., Alfthan, E. (2009):
Measuring cockling on-line in high speed inkjet printing. Int. Conf. on Digital Printing Tech. 521-523.
Kulachenko, A., Gradin, P., Uesaka, T. (2007): Basic mechanisms of fluting formation and retention in paper. Mechanics of Materials 39 (7), 643-663.
Kwong, K., Farnood, R. (2007): Application of wavelet
transformation for paper anisotropy Pulp Paper Can. 108 (3), 41-44.
http://www.pulpandpapercanada.com/paptac/PDFs/Mar07/pape rquality.pdf
Leppänen, T., Erkkilä, A.-L., Hämäläinen, J.(2008): Effect of fiber orientation structure on simulated cockling of paper. J. Pulp Paper Sci. 34 (4), 226-233.
Lipponen, P., Leppänen, T., Hämäläinen, J. (2009): On the role of drying induced cross-machine shrinkage on paper cockling phenomenon. Nord. Pulp Paper Res. J., 24(1), 60-65.
Niskanen, K. (2008): Papermaking Science and Technology,
Book 16:Paper Physics, Paperi ja Puu Oy, Helsinki, 338-343.
Paavola, A. (2009): Taking the twist out of orientation, Paper Making and Distribution 17 (11), 37-39.
Pino, A.O., Pladellorens, J. and Colon, J.F. (2010): Method of
measure of roughness of paper based in the analysis of the texture of speckle pattern, Proceedings of SPIE –The Int. Society for Optical Engineering, 73871W.
Raja, J., Muralikrishnan, B. and Fu, S. (2002): Recent
advances in separation of roughness, waviness and form, J. Int. Societies for Precision Engineering and Nanotechnology, 20, 222-235.
Reis, M.S. and Saraiva, P.M (2010): Analysis and
Classification of the Paper Surface, Ind. Eng. Chem. Res., 49(5), 2493-2502.
Singh, S.P. (2008): A comparison of different methods of paper
surface smoothness evaluation, BioResources, 3(2), 503-516.
Telschow, K.L., and Deason, V.A. (2002): Imaging anisotropic
elastic properties of an orthotropic paper sheet using
photorefractive dynamic holography, Ultrasonics, 40(10), 1025-1035.
Thim, J. O’Nils, M. Manuilskiy, A. and Thörnberg, B. (2008):
Simulating the impact of topographical microstructures on triangulation measurement setups using MATLAB. Matlabe User Conf. Nordic Stockholm.
http://www.mathworks.com/company/events/conferences/mlnor dic_conf08/abstracts.html,
Thomas,T. R. (1982): Rough Surfaces, Longman Inc., New York, 88-90.
Tydeman, P:A., Wembridge, D.R., and Page, D.H. (1966):
Transverse shrinkage of individual fibers by microradiography. In Bolam, F., editor, Consolidation of the paper Web: Transactions of the symposium held at Cambridge, 1965, 119-144.
Vernhes, P., Bloch, J.-F., Mercier, C., Blayo, A. and Pineaux, B. (2008): Statistical analysis of paper surface microstructure: A
multi-scale approach, Applied Surface Science, 254(22), 7431-7437.
Manuscript received April 20, 2010 Accepted July 27, 2011