IN
DEGREE PROJECT MEDIA TECHNOLOGY,
SECOND CYCLE, 30 CREDITS
,
STOCKHOLM SWEDEN 2020
Total cost of ownership of electric
cars as a tool for the public
LUCAS AHLGREN
Abstract
Sustainability and the role of battery electric vehicles (BEVs) in the shift to more sustainable
transportation are gaining more and more attention in society today. However, only 4.3% of new
passenger car registrations in Sweden were BEVs in 2019. High purchase prices are considered a major
barrier to BEV purchases. But the purchase price alone does not reflect what the consumer pays for
owning a vehicle. Previous research shows that BEVs could be cheaper compared to conventional
vehicles such as internal combustion engine vehicles (ICEVs) from a Total Cost of Ownership (TCO)
perspective. Lack of knowledge about TCO can lead to uneconomical purchase decisions. Moreover,
lower adoption rates of BEVs, although BEVs can be more cost-effective and better for the
environment in the long run.
This paper reports on an exploratory research process including the development and user study of a
TCO tool aimed for the public. The purpose is to better understand how a TCO tool influences peoples’
inclination towards purchasing a BEV. Based on an iterative design process, a web application was
developed to help car consumers calculate and visualize TCO of new passenger cars. The web
application was then used in a user study consisting of think-aloud evaluations and semi-structured
interviews with car consumers about the prototype.
The conclusion point towards an interesting direction for a TCO tool moving forward. This study
suggests that a TCO tool can make users aware of the cost benefits of owning a BEV. However, more
research is needed to understand if this realisation is enough to have an effect on BEV purchases.
Sammanfattning
Hållbarhet och elbilens roll i skiftet till mer hållbara transporter är två områden som får allt mer
uppmärksamhet i samhället idag. Trots det var det endast 4.3% av alla nyregistrerade personbilar som
var elbilar i Sverige under 2019. Höga inköpspriser anses vara ett stort hinder som begränsar
försäljningen av elbilar. Dock reflekterar inte inköpspriset vad konsumenten faktiskt betalar för att
äga en bil. Tidigare forskning visar att elbilar kan vara billigare i jämförelse med konventionella
fordon såsom förbränningsbilar baserat på den totala ägandekostnaden (TCO). Brist på kunskap om
TCO kan leda till oekonomiska inköpsbeslut. Men också lägre försäljning av elbilar, trots att elbilen
kan vara mer kostnadseffektiv och bättre för miljön i längden.
Denna uppsats beskriver en undersökande forskningsprocess med målet att utveckla ett TCO-verktyg
för allmänheten. Därtill genomfördes en användarstudie för att studera hur verktyget påverkar
människors benägenhet att köpa en elbil. Utifrån en iterativ designprocess, utvecklandes en
webbapplikation. Detta med syftet att hjälpa bilkonsumenter beräkna samt visualisera TCO för
nyproducerade personbilar. Webbapplikationen användes sedan i en användarstudie bestående av
think-aloud utvärderingar samt efterföljande intervjuer med bilkonsumenter kring prototypen.
Slutsatsen tyder på en intressant riktning för användandet av ett TCO-verktyg i framtiden. Denna
studie pekar på att ett TCO-verktyg kan hjälpa användarna att förstå kostnadsfördelarna med att äga
en elbil. Dock behövs mer forskning för att svara på om denna insikten är tillräckligt för att ha en
effekt på elbilsköp.
Total cost of ownership of electric cars as a tool for the public
Lucas Ahlgren
KTH Royal Institute of Technology
EECS School of Electrical Engineering and Computer Science Stockholm, Sweden
lucasah@kth.se
ABSTRACT
Sustainability and the role of battery electric vehicles (BEVs) in the shift to more sustainable transportation are gaining more and more attention in society today. However, only 4.3% of new passenger car registrations in Sweden were BEVs in 2019. High purchase prices are considered a major barrier to BEV purchases. But the purchase price alone does not reflect what the consumer pays for owning a vehicle. Previous research shows that BEVs could be cheaper compared to conventional vehicles such as internal combustion engine vehicles (ICEVs) from a Total Cost of Ownership (TCO) perspective. Lack of knowledge about TCO can lead to uneconomical purchase decisions. Moreover, lower adoption rates of BEVs, although BEVs can be more cost-effective and better for the environment in the long run.
This paper reports on an exploratory research process including the development and user study of a TCO tool aimed for the public. The purpose is to better understand how a TCO tool influences peoples’ inclination towards purchasing a BEV. Based on an iterative design process, a web application was developed to help car consumers calculate and visualize TCO of new passenger cars. The web application was then used in a user study consisting of think-aloud evaluations and semi-structured interviews with car consumers about the prototype.
The conclusion point towards an interesting direction for a TCO tool moving forward. This study suggests that a TCO tool can make users aware of the cost benefits of owning a BEV. However, more research is needed to understand if this realisation is enough to have an effect on BEV purchases.
KEYWORDS
Total cost of ownership; Electric cars; Human-computer interaction; Sustainability.
1. INTRODUCTION
Sustainable transportation is gaining more and more attention in society today. Transport-related greenhouse gas (GHG) emissions account for 8.6 Gt CO2e per year,
equivalent to 16% of the global total [12]. The majority of these emissions (73%) come from short-haul journeys e.g. in cars, motorbikes and buses [12]. To mitigate these emissions, a transformation of the global transportation sector is needed. Vehicles using fossil fuels must be replaced by more sustainable options. A way to achieve this is the adoption of battery electric vehicles (BEVs). BEVs have great potential as they can be zero-emitters of GHG emissions [12]. Despite this and a gradually increasing interest for BEVs and electrified transportation, sales of BEVs are still low. This is true both in Sweden and internationally except for Norway [2, 27]. Low adoption rates of BEVs on the Swedish market can be explained by multiple factors. Part of the answer is due to situational factors such as high purchase prices, limited driving range and lack of charging infrastructure [1, 23]. Other factors include e.g. attitude, personality and lifestyle also called psychological factors [6, 23]. Still, BEVs have one cost advantage compared to conventional vehicles such as internal combustion engine vehicles (ICEVs) in lower operating costs. E.g. lower need for service and maintenance, better fuel economy and lower taxes [17]. In a study by Hagman et al. [17], they found that BEVs could be cheaper compared to conventional vehicles from a Total Cost of Ownership (TCO) perspective. However, vehicle buyers rarely base their choice of vehicle on calculating total cost [16, 24]. Only 3% of vehicle buyers do a complete ex-ante TCO analysis before a vehicle purchase. On the contrary, 58% of vehicle buyers do not conduct any structured vehicle cost computation at all [16]. One reason for it is that creating a TCO model is a challenging task. Including e.g. gathering data and make assumptions of future conditions and prices. As a result, it requires effort, time and cognitive abilities from the consumer [17]. Not considering TCO in the vehicle choice process can lead to uneconomical purchase decisions. Hagman et al. call this the TCO paradox [16]. This is turn
can have negative effects on the consumer’s economy, but also the environment.
Some researchers [10, 16, 17, 24] argue that increasing consumer knowledge is one way to overcome a problem like the TCO paradox. Other researchers argue that creating a credible and easy-to-use TCO comparison tool would help consumers to make more economical purchase decisions [17]. Today, TCO tools and services available to the public are rather few. Additionally, studies on designing such tools are scarce in Human-Computer Interaction (HCI) research. This offers an opportunity to provide knowledge on how to design a TCO tool and how the tool influences the consumer.
Previous research studying the effects of providing life-cycle cost (LCC) and TCO information are showing promising results. One study showed that providing LCC information on a price comparison website influence people to choose more energy-efficient products [7]. Moreover, another study showed that providing a TCO calculation increased the probability that small and mid-sized car consumers would purchase a hybrid electric vehicle (HEV) or a BEV [9]. Ultimately, TCO can be a natural part of the car purchasing process and a tool designed for the public could hence influence consumers to choose more energy-efficient cars and reduce their total cost at the same time.
In this paper, a web application for calculating and visualizing TCO of new passenger cars was developed and studied. Based on think-aloud evaluations with car consumers, this paper focused on how TCO and a TCO tool influences the consumers and their inclination towards purchasing a BEV. Secondly, based on an exploratory research approach, the design process of creating such a tool. The following research questions guided the research process: How do you design a web application for calculating and visualizing TCO of electric- and conventional cars aimed for the public? and how does it influence peoples’ inclination towards purchasing a BEV?
2. BACKGROUND
This section presents key concepts, theory and related research for this paper.
2.1. Sustainable HCI
Sustainability and the use of interactive technologies have gained an increasing interest in the HCI community [8]. This has led to a new sub-field in HCI called Sustainable HCI (SHCI) [21]. SHCI can be categorised into two
orientations according to Mankoff et al. [26]. The first one being sustainability in design and the second one being sustainability through design. The former focuses on how to make the technology itself sustainable. While the latter focuses on how to support sustainable lifestyles through the design of technology. The work in this paper is related to the latter, sustainability through design.
Thus far, a lot of SHCI research has focused on sustainability related to energy [18, 20, 29], food [4, 13], transportation and mobility [19, 22, 25]. Numerous studies have investigated the effects of Information and Communication Technology (ICT) solutions for encouraging sustainable behaviour and increase user knowledge. For instance, related to food consumption, energy usage and GHG emissions. Several of these solutions use various techniques to promote sustainable behaviour. A common strategy is feedback techniques that help the user to become aware of its behaviours. It includes design strategies such as gamification and personalised feedback. Another common strategy is the use of persuasion and persuasive technologies. Fogg [15] defines persuasive technologies as “Any interactive computer system designed to change people’s attitude and behaviours”. However, to understand how ICT and computer systems affect the user, one must understand what factors are driving human behaviour.
2.2. The Fogg Behaviour Model
Human behaviour and behaviour change can be understood with the help of The Fogg Behaviour Model (FBM) [14]. FBM is a psychological model consisting of three principal driving factors: motivation, ability, and triggers. Motivation consists of three underlying core motivators that drive human behaviour: pleasure/pain, hope/fear and social acceptance/rejection. The second factor ability, also called simplicity factors means how simple it is for the user to do something at a particular situation in time. Fogg defines six elements to understand ability: time, money, physical effort, brain cycles (mental effort), social deviance and non-routine. These elements are considerations that should be taken into account to increase ability. The last factor is triggers, a trigger is something that calls to action or tells the user to perform a certain behaviour. Fogg mention three different triggers: sparks, facilitators and signals. Each of these triggers is used to increase motivation, ability or as a reminder to call to action. For a target behaviour to occur, each of these three principal factors must be present at the same time. Meaning a user must have sufficient motivation, sufficient ability together with an effective trigger for a target
behaviour to occur. The higher the motivation and the ability are, the more likely the target behaviour will occur.
2.3. BEV sales and adoption barriers
Between 2018 and 2019 new registered BEVs on the Swedish market increased by 121% from 7147 cars in 2018 to 15 795 cars in 2019. Although the number of new registrations more than doubled over the course of one year, BEVs only accounted for 4.3% of all new registrations of passenger cars in Sweden in 2019 [27]. This number can be compared to Norway where 31.2% of all new registrations were BEVs in 2018 [2].
Previous research has studied consumers’ perceptions and attitudes regarding BEV adoption. Several studies [3, 23, 24] point towards high purchase prices as a major barrier to BEV purchases. This is also acknowledged in the Exponential Roadmap report from 2019 [12]:
“The growth of electric vehicles, which beat traditional vehicles on performance and are better for the health of cities, is likely to accelerate at a time when they are increasingly competitive in terms of purchasing price. The total cost of ownership is already better for electric cars in some countries and contexts” (Falk et al., p. 87).
This statement was particularly true in the case of Norway. Norway has one of the largest adoption rates of BEVs in the world. This was possible thanks to strong financial incentive packages. Two of the most critical incentives were according to Norwegian BEV owners’ exemptions from purchase tax and value added tax (VAT). These financial incentives reduced the purchase price for BEVs to be almost the same as for comparable ICEVs [3]. The importance of financial incentives was also highlighted in a TCO study conducted in the USA [5]. In that study, researchers found that BEVs lower operating costs were not enough to cover for high purchase prices and rapid depreciation rates in nearly all the 14 cities included in the study e.g. New York, Los Angeles and Boston. Thus, suggesting BEVs need subsidies to be cost competitive compared to conventional vehicles. As long as purchase prices for BEVs are not significantly reduced.
2.4. Total Cost of Ownership
TCO is a method and a purchasing tool that is used to understand the true cost of a product or service from a particular supplier [11]. Calculating TCO is a complex process where firms and consumers must identify the different cost factors associated with a purchase [11]. Products and services may have different cost factors depending on the type of product or service and context.
For a consumer purchasing a car, such cost factors include e.g. purchase price, fuel costs, service and repair costs and insurance costs. In the next step, one must create a TCO model representative for the product and the context to calculate TCO. In this study, it is important to focus on the consumer and use a consumer centric TCO model. The TCO model used in this study was created by Hagman et al. and is described in section 2.5.
2.5. Consumer centric TCO model
To build a tool for calculating TCO, a TCO model relevant for car consumers must be adopted. In this study, the calculation is based on a consumer centric TCO model created by Hagman et al. [17]. The model consists of seven cost factors: depreciation of the vehicle, fuel, interest, insurance, maintenance and repairs, government taxes and government subsidies. The total cost is calculated according to the following equation:
𝑇𝐶𝑂 = (𝑃𝑃 − 𝑅𝑃) + 𝐹𝐶(𝑇𝐾𝐷) + ( 𝑟𝑃
1−(1+𝑟)−𝑁𝑁 − 𝑃) +
𝐼𝐶 + 𝑀𝑅 + 𝑇 − 𝑆
Depreciation is calculated by taking the difference between the purchase price (PP) and the resale price (RP) for the total ownership period. Furthermore, the total fuel cost is calculated by taking fuel cost per kilometre (FC) multiplied by the total kilometres driven (TKD). The total interest cost is calculated by the following formula: (𝑟𝑃/(1 − (1 + 𝑟)−𝑁) ) 𝑁 − 𝑃 where r is the monthly interest rate, P is the amount borrowed and N is the number of monthly payments. Insurance is IC, maintenance and repairs are MR, government taxes is T and government subsidies is S. This TCO model uses direct costs only. Therefore, indirect costs are omitted.
2.6. TCO tools
A review of existing tools for calculating TCO of cars revealed that there is room for improvement. Generally, these tools lack design elements to make TCO calculations easier to comprehend, such as charts and visualizations. One of those tools is Teslakalkylen [30]. Teslakalkylen is an online TCO tool created and operated by Danni Efraim. In the tool, you can create your own personalised TCO calculation by putting in relevant data in a form. The tool takes into account several different cost factors including purchase price, taxes, fuel consumption etc. However, the tool only provides calculation data in a table and therefore make information processing and data gathering more demanding for the user.
Another online TCO calculator [28] was developed by the Mobility and Automotive Technology Research Center (MOBI) at Vrije University in Brussels (VUB). The project was a collaboration with the European Copper Institute to help policy makers and consumer organisations make fair comparisons between BEVs and conventional vehicles. Unlike Teslakalkylen MOBI’s TCO tool require less input from the user, but at the cost of accuracy. Input is limited to a selection of cars with different drivetrains, annual mileage and years of ownership. Additionally, not much effort has been put on the layout or the user instructions to help the user use the tool. However, one advantage is that the tool provides an interactive bar chart where each cost factor is stacked on top of each other. The bar chart makes it easier for the user to understand the relation between different cost factors and their respective size. In the bar chart view, the user can also change fuel prices (e.g. diesel and electricity) and policy measures to adjust for local differences.
In one way these two tools could be considered opposites of each other. Teslakalkylen demands more input from the user, while MOBI’s is based on predefined assumptions. Each tool has its strengths and weaknesses and a good TCO tool is probably a combination of both. An easy to use design with the option to adjust input variables if necessary, but also visuals to ease information processing for the user.
3. METHOD
This section covers the methodology used for creating the web application prototype and the user study. The work in this paper had an exploratory approach and included several methods focusing on qualitative aspects of developing and evaluating a TCO tool. It was an iterative process including defining, developing and evaluating the prototype with users and experts in the field of TCO and HCI. The user study consisted of a think-aloud evaluation studying how the user reason while using the prototype, to better understand how it influences the user and to find potential design issues.
3.1. Limitations
Due to the outbreak of the coronavirus COVID-19, this study was adapted to comply with Sweden’s national recommendations to reduce the spread of COVID-19. In practice, this meant that the user study was conducted remotely online instead of in a physical room.
3.2. The design process
During the design process, several different design methods were used for the different design phases. In the early define phase, a qualitative survey aimed at car owners and potential car consumers was published on Facebook. This with the goal to better understand their relationship to the vehicle choice process, electric cars and TCO. Publishing it on Facebook had the advantage that a large group of people could be reached, including people with different backgrounds that can contribute with different perspectives on the topic.
The survey got 42 responses from people in the age of 26-73. All answers were treated anonymously. All participants except two owned one or more cars, 40 of them did not own an electric car. Through a thematic analysis, two themes could be identified from the survey. The first one was that majority of people think high purchase prices is the largest barrier to BEV purchases. This is in line with previous research. Furthermore, even though the participants have a rather good understanding of TCO as a concept, most of them only consider a few of the cost factors in new car purchases. Suggesting TCO is underused as a tool for car purchases. Moreover, 73.8% of participants were interested in using a TCO tool, only 4.8% answered that they did not. It shows that there is an interest and a demand for a TCO tool available to the public. Additionally, the participants also provided some design ideas for the TCO tool. For example, the possibility to compare TCO between different cars. Furthermore, the ability to change individual parameters and see how adjusting them affects TCO. These suggestions were later considered in the prototyping phase.
Based on data from the survey and previous research, personas were created as a way to identify, understand and communicate the user’s goal, needs and limitations for the prototype. The primary persona represents the general public and hence the general car consumer. As a result, the primary persona only takes into account a few cost factors before a new car purchase. They need an easy to use tool requiring minimal input and effort from the user. The secondary persona represents consumers that do a semi-complete or complete TCO analysis before a new car purchase. They need a TCO tool that can ease their TCO analysis process, providing them with options and features that could help them do the analysis.
In the next step, a review of existing TCO tools together with the design ideas from the survey spurred ideas for the prototyping phase. These ideas were translated into basic illustrations and put together as a low-fidelity
prototype in a prototyping tool called Adobe XD (See Figure 1). The low-fidelity prototype was shared with a TCO expert and an HCI expert to get feedback and improve the concept. This formed the template for creating the web application or the high-fidelity prototype. Once finished the web application was shared with the two experts once more. This was to clear uncertainties and make sure that the tool worked as expected before the user study.
Figure 1: An illustration of a TCO breakdown in Adobe XD. 3.3. The prototype
The web application was created using the following frameworks: React.js, Redux, Bootstrap 4 and ApexCharts.js. It was designed for the Swedish market and Swedish regulations. Thus, including vehicle tax and subsidies (bonus malus) based on information from the Swedish Transport Agency. The application lets the user search and filter for a specific type of car including car brand, fuel type and car size (see Figure 2). The search result includes a basic three-year TCO calculation for each car sorted from cheapest to most expensive. It provides an indication of how TCO differ between cars, without any need for user input.
Figure 2: List of cars from the search feature.
The application also lets the user do their own TCO calculation or see a breakdown of the TCO calculation mentioned above in detail. Clicking on a car opens up a
page with details about the car and the TCO calculation (see Figure 3).
Figure 3: Car details for a Nissan Leaf.
Here the user can pick between different engine types and drivetrains through a dropdown menu. At the bottom of the page is a breakdown of the TCO calculation and the individual cost factors. Through input fields on the right side, the user can adjust individual input variables for the TCO calculation. For example, time of ownership, annual mileage, down payment and interest rate (see Figure 4). Adjusting a variable automatically updates the TCO calculation on the left side. It includes a TCO summary including total cost, monthly cost, mile cost and total cost in relation to the purchase price in percent. The user can also save the TCO calculation for later and compare it against other cars on the “compare page”.
Figure 4: A TCO breakdown for a Nissan Leaf.
On the “compare page” (see Figure 5) the user can compare TCO calculations against each other. The application lets the user select which TCO calculations to compare. Clicking on a TCO calculation from the list on the right side updates a bar chart showing either total cost, individual cost factors or a stacked bar chart showing the cost distribution for each TCO calculation. The user can also download all TCO calculations as an Excel-file in the bottom right corner.
Figure 5: A cost distribution comparison between two TCO calculations.
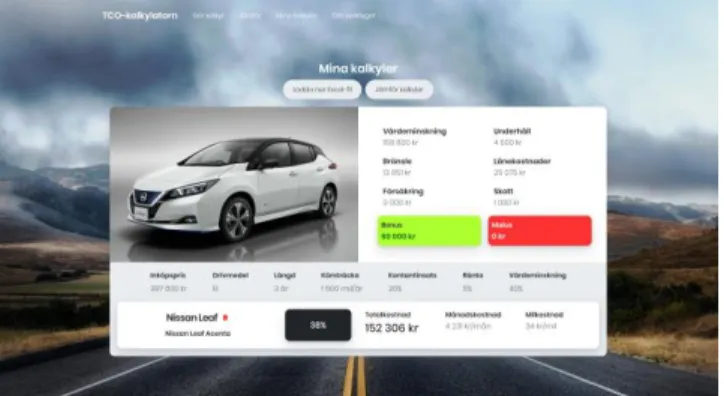
Lastly, all saved TCO calculations are available on the “my calculations” page (see Figure 6). Here the user can see a summary of each TCO calculation, but also download an Excel-file with all calculations to store, share or process later.
Figure 6: A summary for a Nissan Leaf TCO calculation. 3.4. User study
For the purpose of answering the research questions, a think-aloud evaluation was chosen. In this context, it provides a cost-effective way to get in contact with participants. Because it can be conducted remotely online through various video conferencing software with screen sharing functionality. In this study, two different software applications were used for the think-aloud evaluation. Zoom Video Communications for communicating, screen sharing and audio- and video recordings. Furthermore, TeamViewer was used to remote control the participant’s computer to set up the user study including the prototype and Zoom.
3.4.1 Participants
Participants were recruited on Facebook. A prerequisite was that they had a driver’s license to qualify for the user study. Five people (n=5), two women and three men
participated in the think-aloud evaluation of the prototype. Participants’ ages ranged from 24 to 63 years. At the time of the user study, all participants but one owned at least one ICEV car. None of the participants owned a BEV. Important factors in the car purchasing process were according to the participants: purchase price, fuel consumption, car size, warranty, trim level and car brand. Most of the participants thought that the purchase price was the single most important factor.
3.4.2 Procedure
In the think-aloud evaluation, each participant was asked to perform tasks using the prototype and think out loud while solving them. Before each session, each participant was introduced to the concept of a think-aloud evaluation and the purpose of the study. Each participant answered a short questionnaire to get information about the participant and what cost factors they consider during the car purchasing process. Furthermore, each participant was asked to read an about page explaining what TCO is and how the prototype works. In the next phase, each participant was asked to perform tasks with the help of the prototype. The following tasks were used for the think-aloud evaluation:
• Do a TCO calculation for an optional electric car and then save the calculation.
• Do a TCO calculation for an optional petrol or diesel car and then save the calculation.
• Based on these calculations, find the car with the lowest total cost and the car with the lowest fuel cost and tax.
• Explore the tool on your own.
At the end of each session, each participant engaged in a semi-structured interview about the prototype and the user study. Questions included: How would you describe your overall experience with the tool? What did you like with the tool? What did you not like with the tool? What could be improved? What did you learn from using the tool? If you were to purchase a new car today, would you use this tool and if so how and why? After using the tool, how would say that your inclination for purchasing an electric car has changed (more, less, unchanged) and why? Data from the think-aloud evaluation was collected through paper notes and audio- and video recordings. All participants were asked for permission to record audio
and video prior to the think-aloud evaluation. To ensure the confidentiality of the participants, each participant was coded from P1 to P5.
3.4.3 Analysis
Data from the questionnaire, the think-aloud evaluation and the semi-structured interview was processed and analysed using thematic analysis. The analysis process started with getting to know the data by going through paper notes, audio- and video recordings and transcribing the interview. In the next phase, relevant data were coded and grouped into themes. This included e.g. the prototype itself, consumer knowledge and BEV adoption. In the final stage, all themes were reviewed and only relevant themes for the study were selected and used.
4. RESULTS
This section presents the results of the user study. The results are divided into subsections corresponding to the themes from the thematic analysis and an evaluation with the FBM. The themes were identified as “Prototype feedback”, “Consumer knowledge” and “BEV adoption”.
4.1. Prototype feedback
This theme summarises the participants’ comments and experiences with the prototype. Overall the participants thought that the tool was helpful, informative and easy to use. It was helpful to get an overview of the individual cost factors. Moreover, to find out how different cost factors contribute to the total cost. P3 said, “The tool was easy to understand and easy to use”. P2 commented, “I liked how easy it was to find a car and do a calculation”. P5 said, “When you learned how to use it, it was pretty easy to use”.
A couple of participants highlighted the overall design of the prototype. P1 and P4 said that the tool was good-looking. P4 commented, “I think it is a good-looking website. The colours and the images made it more interesting to use”. Furthermore, P1 and P4 also commented about colours for highlighting the bonus malus-system. Bonus malus is a financial initiative from the Swedish Government to reward environmentally friendly vehicles and punish vehicles that emit large amounts of CO2. Bonus vehicles get a subsidy and malus
vehicles are punished with higher taxes for the first three years. P1 said, “I like the colours for bonus and malus, it made it easy to understand”. P4 commented, “I am looking
for a car where the green bonus value is high and the red malus value is low”.
Regarding the features in the prototype, several participants liked the feature where they could compare TCO calculations. P5 commented, “It is great because you get black on white which is the cheapest”. Moreover, the participants also found different compare options useful. P2 said that the cost distribution chart was easy to use and preferred it instead of individual cost factors one by one. P2 said, “The cost distribution chart is clearer because you can choose multiple costs at the same time and hover over them to see the cost”. P4 mentioned that both individual cost factors and the cost distribution chart were good in different ways. P4 said, “The cost distribution chart is good to get an overview, but individual cost factors are easier for comparing”. Furthermore, P2 also liked the possibility to download the TCO calculations as an Excel-file, “It is great to be able to save the calculations after you have done them”.
Although most comments were positive about the prototype, some design issues became clear during the user tests. The first one being lack of information explaining what different computations mean, but also general information about cost factors. One example concerned the term malus. Some participants asked, “What is malus?” Although an information icon was added next to it to help the user, it was not used by all participants asking the question. The same problem existed for individual cost factors on the “my calculations page”. But on the “my calculations page” those icons were not included, hence a couple of participants suggested to include them there as well. P2 commented, “Otherwise you have to go back and do a new calculation to read it”. Another issue concerned the computation presenting TCO as a percentage of the purchasing price. For several participants, this computation caused confusion and was not explained everywhere. E.g. P4 asked, “Is it beneficial if the value is low?”. The last issue concerned hidden information. For example, how information about a calculation was presented on the “compare page”. After having selected which TCO calculations to compare, P1 commented, “Did I choose petrol or diesel for the Hyundai i30”. Because this information was not present on the screen, only the calculation name, left P1 somewhat pondering. Information about the TCO calculation was hidden behind an expand button, but P1 never used.
4.2. Consumer knowledge
This theme captures how the prototype contributed to the participants' overall knowledge about TCO and car-related costs. In several situations, the participants reacted with surprise over cost differences between BEVs and ICEVs. The most common one concerned the difference in fuel cost between BEVs and ICEVs. P1 commented “That was a big difference, is it like this in real life? What a difference”. P2 commented, “Wow, what a big difference”. A similar reaction could be noted when participants read about the aggregated mile cost for different cars. P4 commented, “69 crowns! What makes it so expensive?”. P3 reacted in a similar way, “49 crowns per mile, is it that expensive to drive a car?”.
Furthermore, many participants answered that they expected BEVs to be more expensive than they were from a TCO perspective. P2 commented, “I knew partially that electric cars had lower operating costs than petrol cars, but I thought that the total cost would be higher than it was”. P4 said, “Electric cars are not as expensive as I thought from the beginning”.
In regard to learnings, several participants touched upon the difference in operating costs between BEVs and ICEVs. P3 and P5 commented specifically about BEVs and low operating costs. P3 said, “I learned that electric cars have low operating costs. Normally it is easy to focus only on the purchase price”. P5 noticed how the length of ownership affects TCO and operating costs, “I learned what a difference one year makes with lower fuel cost and tax, it is a significant difference compared to petrol cars”. Moreover, P4 also talked about learnings related to the purchase price and TCO. P4 commented, “Now I know that purchase price is not the only thing that matters”. Another learning from using the prototype related to the interest cost. E.g. P1 commented about high purchase prices and interest costs, “You do not always think about that the more expensive a car is to buy, the higher the interest cost is”.
4.3. BEV adoption
This theme touch upon the implications of providing a TCO tool aimed for the public, including its potential effects on BEV adoption. In the user study, four out of five participants ended up with TCO calculations where the total cost for the BEV was cheaper compared to the ICEV. In those cases, the participants answered that they were more inclined to purchase a BEV than before the user test. However, P3 ended up with TCO calculations where the ICEV had the lowest total cost compared to the BEV. This
was mostly caused by a significant difference in purchase price between the BEV and the ICEV. In that case, the depreciation cost got too large to counter for the BEV’s lower operating costs and subsidies. During the interview, P3 was neither more inclined nor less inclined to purchase a BEV. P3 said, “BEVs are still too expensive”, but also highlighted BEVs’ limited driving range and long charging times as important factors as well. Furthermore, despite being more inclined to purchase a BEV, P5 also commented about the future development of BEVs. P5 said, “Electric cars will become more and more common, but you never know how the technical development will be like in a couple of years. If electric cars will get better in terms of driving range and charging times”.
4.4. FBM evaluation
These results suggest that a TCO tool can increase the user’s ability to understand the financial benefits of owning a BEV. Furthermore, to gain insights on car-related costs with the help of TCO. This is likely because a TCO tool can reduce the time and the mental effort needed from the user to come to this realisation. However, this puts more focus on user motivation to get a better understanding of its effects on BEV adoption. Both motivation in regard to using a TCO tool, but perhaps more importantly, motivation to purchase a BEV. Including aspects beyond economy e.g. values and beliefs. Ultimately, because the higher the motivation and the ability are, the more likely the target behaviour will occur. A better understanding of user motivation and user ability increases the ability to design for a specific target behaviour.
5. DISCUSSION
The purpose of this study is to understand how a TCO tool aimed for the public influences peoples’ inclination towards purchasing a BEV. Furthermore, understand how such a TCO tool should be designed. This section will discuss and analyse the results of the study. Furthermore, directions for future development and future research will be suggested.
5.1. Prototype insights
Considering the TCO tool is aimed at general car consumers, one cannot assume every person to have sufficient knowledge about all cost factors. Therefore, to design an easy-to-use TCO tool, it is important to provide information about what certain cost factors mean and consists of. Particularly for temporary or changing cost factors such as subsidies like the bonus malus-system.
Thus, a TCO tool should not only focus on making the calculations easy to perform but should also consider including educational content. This is to help the user understand the computations and the cost factors in order for them to do fair comparisons. Therefore, information about cost factors and computations should be available and stated clearly when the user needs it.
Furthermore, computations that require extensive mental effort to interpret should be avoided. Such computations are likely overlooked if the interpretation is not clear nor useful to the user. In this case, the computation presenting TCO in relation to the purchase price was a clear example of this.
On a positive note, the focus on including visual elements seemed to help the participants during the user tests. Not only did participants comment about charts being useful for comparing TCO calculations. They also took notice on the use of colours to make data easier to comprehend. As in the case of presenting the bonus malus numbers. Thus, visual elements can be useful for designing easy-to-use TCO tools.
5.2. BEV adoption
Even though BEVs can be cheaper compared to ICEVs, it brings to question when the difference in total cost is enough to be in favour of the BEV. Evaluated through the lens of the FBM suggests that more research focusing on user motivation is needed to understand this. But also, how psychological factors, as well as situational factors are considered in relation to differences in total cost. However, this study suggests that a TCO tool can increase the user’s ability to understand the financial benefits of owning a BEV. Thus, it could have a positive effect on BEV adoption with an effective trigger. In this case, triggers that call to action or work to increase user motivation could prove effective. As lack of knowledge is likely a hindrance, a possible trigger could be using marketing to promote TCO as a useful tool for car purchases.
5.3. Persuasive technology and behaviour change
Behaviour change can be hard to achieve no matter how convincing the argument is. However, to achieve behaviour change, it is important to bring new perspectives and challenge why we do or base our decisions in a particular way. To do this, it is important to recognize what is important and why it is important. For a consumer purchasing a car, high purchase prices is considered a major barrier. The rationale behind car purchases is mainly related to economics. Therefore, bringing new perspectives on car-related costs could cause
consumers to change their behaviour if it proves to be of value to them. In this study, it is about making a complex process easy to perform and understand by the user. Conducting a TCO analysis will always be more complex and demanding compared to looking at purchase prices. Here technology is one way to bring these new perspectives and lower the threshold for everyone to understand. Forcing behaviour change is probably not going to be as effective as empowering the user to come to this realisation. However, designers of persuasive technologies have options to highlight or bring forward perspectives that stand out compared to established ways of doing things. In this study, one example concerns how to calculate the mile cost of driving a car. In most cases, this is likely calculated by taking into account the fuel cost only. However, as suggested from this study, the aggregated mile cost based on TCO led to reactions of surprise from the participants, questioning their way of calculating mile cost. Thus, to increase the likeliness of achieving behaviour change one has to identify what is important and bring new perspectives that challenge established ways of doing things.
5.4. Method discussion
Despite the extraordinary circumstances with the outbreak of COVID-19 and social distancing restrictions, the user study could be conducted without any major difficulties. However, conducting the user study remotely have downsides. The first is that you have less control over the test environment and the technical equipment. This assumes that the participant has access to the necessary equipment and a reliable internet connection. Most likely, this will differ between participants. Both equipment e.g. laptops and desktops, but also, different operating systems. This could potentially cause uneven results when testing the prototype, but at the same time reflects more likely how the participants would have used it in a real-life scenario. Ultimately, having the user tests in a lab setting would have helped to remove some of those potential issues.
Moreover, the schedule could have been structured a little bit differently. During the study, a lot of time was spent in the define phase preparing for the prototype phase. This left less time for prototyping which was the most time-consuming part of the design process. A better approach would have been to start the prototyping phase earlier at the same time as the define phase. It would have allowed for at least one more design iteration to improve the prototype before the user study. Which in turn could have led to other results.
Lastly, the user study would likely have benefited from having more participants. As more participants would have generated more qualitative data and possibly a stronger support for how a TCO tool influences the car consumer. Moreover, the focus on qualitative data also made it harder to analyse and compare comments and answers between participants. For that purpose, a quantitative questionnaire with Likert scale questions could have helped to support findings from the qualitative data. Furthermore, to capture nuances within an answer e.g. with an attitude scale ranging from strongly disagree to strongly agree.
5.5. Future work
As the results of this study show, indicate an interesting direction for TCO as a method and a tool moving forward. The prototype in its current state still requires some knowledge from the user to do a personalised TCO calculation. Some computations such as vehicle tax and fuel costs can be estimated relatively easy with available data. However, some cost factors are more difficult to estimate. Especially cost factors that depend on the user. For example, insurance cost, that is based on several different subfactors both vehicle-based and owner-based. Thus, one suggestion for future work could be to focus on making it easier to personalise TCO calculations. Moreover, as mentioned in section 5.1, another direction for future studies could focus on the educational aspects of designing a TCO tool.
6. CONCLUSION
This study point towards an interesting direction for the use of a TCO tool in car purchasing processes. First of all, to help consumers get a holistic view of the costs associated with new car purchases, but also for educational purposes. For instance, to enlighten how financial incentives from the Swedish Government such as the bonus malus-system affects the total cost. A TCO tool could thus work as a hub and become a natural part of the car purchasing process. Not only a hub for making cost comparisons, but also a home for consumer information regarding car purchases and car-related costs.
A TCO tool can make users aware of the cost benefits with BEVs. However, more research is needed to understand if this realisation is enough to have an effect on BEV purchases. Because it is important to note that psychological- and situational factors also play a crucial role in the decision process. Granting those factors are satisfied, an easy-to-use TCO tool could be a good
catalyser to advance the transition to electrified transportation and BEVs.
ACKNOWLEDGEMENTS
First, I would like to thank my supervisor Anders Lundström for his valuable support and constructive feedback during the whole research process. I also would like to thank Jens Hagman for his support in the process of adopting the TCO model and designing the prototype. Finally, I would like to thank all participants for making this study possible.
REFERENCES
[1] Axsen, J. and Kurani, K.S. 2013. Hybrid, plug-in hybrid, or electric-What do car buyers want? Energy Policy. (2013). DOI:https://doi.org/10.1016/j.enpol.2013.05.122.
[2] Bieker, G. et al. 2019. European vehicle market statistics, 2019/2020.
[3] Bjerkan, K.Y. et al. 2016. Incentives for promoting Battery Electric Vehicle (BEV) adoption in Norway. Transportation Research Part D: Transport and Environment. (2016). DOI:https://doi.org/10.1016/j.trd.2015.12.002.
[4] Bohné, U. et al. 2015. The EcoPanel - designing for reflection on greener grocery shopping practices BT - EnviroInfo and ICT for Sustainability 2015. (Sep. 2015).
[5] Breetz, H.L. and Salon, D. 2018. Do electric vehicles need subsidies? Ownership costs for conventional, hybrid, and electric vehicles in 14 U.S. cities. Energy Policy. 120, (Sep. 2018), 238–249. DOI:https://doi.org/10.1016/J.ENPOL.2018.05.038. [6] Choo, S. and Mokhtarian, P.L. 2004. What type of vehicle do
people drive? The role of attitude and lifestyle in influencing vehicle type choice. Transportation Research Part A: Policy and Practice. (2004). DOI:https://doi.org/10.1016/j.tra.2003.10.005. [7] Deutsch, M. 2010. The effect of life-cycle cost disclosure on
consumer behavior: evidence from a field experiment with cooling appliances. Energy Efficiency. 3, 4 (2010), 303–315. [8] DiSalvo, C. et al. 2010. Mapping the Landscape of Sustainable
HCI. Proceedings of the SIGCHI Conference on Human Factors in Computing Systems (New York, NY, USA, 2010), 1975–1984. [9] Dumortier, J. et al. 2015. Effects of providing total cost of
ownership information on consumers’ intent to purchase a hybrid or plug-in electric vehicle. Transportation Research Part A: Policy and Practice. 72, (2015), 71–86.
[10] Egbue, O. and Long, S. 2012. Barriers to widespread adoption of electric vehicles: An analysis of consumer attitudes and perceptions. Energy Policy. (2012). DOI:https://doi.org/10.1016/j.enpol.2012.06.009.
[11] Ellram, L.M. 1995. Total cost of ownership: An analysis approach for purchasing. International Journal of Physical Distribution & Logistics Management. 25, 8 (Oct. 1995), 4–23. DOI:https://doi.org/10.1108/09600039510099928.
[12] Falk, J. et al. 2019. Exponential Roadmap 1.5. Future Earth. [13] Farr-Wharton, G. et al. 2013. EatChaFood: challenging
562.
[14] Fogg, B.J. 2009. A Behavior Model for Persuasive Design. Proceedings of the 4th International Conference on Persuasive Technology (New York, NY, USA, 2009).
[15] Fogg, B.J. 2002. Persuasive technology: using computers to change what we think and do. Ubiquity. 2002, December (2002), 2.
[16] Hagman, J. et al. 2017. The TCO Paradox—A Key Problem in the Diffusion of Energy Efficient Vehicles? American Journal of Industrial and Business Management. 7, 12 (2017), 1267–1284. [17] Hagman, J. et al. 2016. Total cost of ownership and its potential
implications for battery electric vehicle diffusion. Research in Transportation Business and Management. 18, (Mar. 2016), 11– 17. DOI:https://doi.org/10.1016/j.rtbm.2016.01.003.
[18] Hargreavesn, T. et al. 2010. Making energy visible: A qualitative field study of how householders interact with feedback from smart energy monitors. Energy Policy. (2010). DOI:https://doi.org/10.1016/j.enpol.2010.05.068.
[19] Hasselqvist, H. et al. 2016. Challenging the Car Norm: Opportunities for ICT to Support Sustainable Transportation Practices. Proceedings of the 2016 CHI Conference on Human Factors in Computing Systems (New York, NY, USA, 2016), 1300–1311.
[20] Heller, F. and Borchers, J. 2011. PowerSocket: Towards on-Outlet Power Consumption Visualization. CHI ’11 Extended Abstracts on Human Factors in Computing Systems (New York, NY, USA, 2011), 1981–1986.
[21] Hilty, L.M. and Aebischer, B. 2015. ICT for Sustainability: An Emerging Research Field BT - ICT Innovations for Sustainability. (Cham, 2015), 3–36.
[22] Jylhä, A. et al. 2013. MatkaHupi: A Persuasive Mobile Application for Sustainable Mobility. Proceedings of the 2013 ACM Conference on Pervasive and Ubiquitous Computing Adjunct Publication (New York, NY, USA, 2013), 227–230. [23] Lane, B. and Potter, S. 2007. The adoption of cleaner vehicles in
the UK: exploring the consumer attitude-action gap. Journal of
Cleaner Production. (2007).
DOI:https://doi.org/10.1016/j.jclepro.2006.05.026.
[24] Larson, P.D. et al. 2015. Consumer attitudes about electric cars: Pricing analysis and policy implications. Transportation Research Part A: Policy and Practice. (2015). DOI:https://doi.org/10.1016/j.tra.2014.09.002.
[25] Lundström, A. 2016. Designing energy-sensitive interactions: conceptualising energy from the perspective of electric cars. KTH Royal Institute of Technology.
[26] Mankoff, J.C. et al. 2007. Environmental sustainability and interaction. CHI’07 extended abstracts on Human factors in computing systems (2007), 2121–2124.
[27] New registration of cars increased by 107 percent in December: 2020. https://www.scb.se/en/finding-statistics/statistics-by-
subject-area/transport-and-communications/road- traffic/registered-vehicles/pong/statistical-news/new-registrations-december-2019/. Accessed: 2020-02-03.
[28] Passenger Car TCO Calculator Tool: http://www.ev-app.eu/. Accessed: 2020-02-18.
[29] Pierce, J. and Paulos, E. 2012. Beyond Energy Monitors: Interaction, Energy, and Emerging Energy Systems. Proceedings of the SIGCHI Conference on Human Factors in Computing Systems (New York, NY, USA, 2012), 665–674.
[30] Teslakalkylen: https://www.teslakalkylen.com. Accessed: 2020-02-14.