Proficiency Testing
Food Microbiology
January 2018
Edition
Version 1 (2018-04-19)
Editor in chief
Hans Lindmark, head of Biology department, National Food Agency
Responsible for the scheme
Jonas Ilbäck, microbiologist, Biology department, National Food Agency PT January 2018 is registered as no.2017/03176 at the National Food Agency.
Proficiency Testing
Microbiology – Food
January 2018
Quantitative analyses • Aerobic microorganisms, 30 °C • Enterobacteriaceae • Thermotolerant Campylobacter • Listeria monocytogenes Qualitative analyses • Thermotolerant Campylobacter • Listeria monocytogenes • Salmonella• Escherichia coli O157 • Pathogenic Vibrio spp. • Yersinia enterocolitica
Abbreviations
Media
ALOA Agar for Listeria according to Ottaviani & Agosti APW 2% Alcaline peptone water, 2 % NaCl
BGA Brilliant Green Agar
BPW Buffered Peptone Water
BS Bromthymol blue Saccharose agar
CIN Cefsulodin Irgasan Novobiocin agar
CT-SMAC Cefixime Tellurite Sorbitol MacConkey agar ITC Irgasan Ticarcillin potassium Chlorate broth LMBA Listeria monocytogenes Blood Agar
mCCDA Modified Charcoal Cephoperazone Deoxycholate Agar MKTTn Muller-Kauffmann Tetrathionate/novobiocin broth MPCA Milk Plate Count Agar
MRB Modified Rappaport Broth
MSRV Modified Semi-solid Rappaport-Vassiliadis enrichment media mTSB Modified Tryptone Soya Broth
OCLA Oxoid Brilliance™ Listeria agar PSB Peptone Sorbitol Bile salts broth PCA Plate Count Agar
RVS Rappaport-Vassiliadis Soy peptone broth SMAC Sorbitol MacConkey agar
SP Salt Polymyxin broth
SSDC Salmonella/Shigella Sodium Deoxycholate Calcium chloride agar TCBS Thiosulphate Citrate Bile salts Sucrose agar
TGE Tryptone Glucose Extract agar
TSA Tryptic Soya Agar
TSBY Tryptone Soya Broth with Yeast extract XLD Xylose Lysine Deoxycholate agar VRBG Violet Red Bile Glucose agar
Organisations
AOAC AOAC International
AFNOR French National Standardisation Association ISO International Organization for Standardization NMKL Nordic Committee for Food Analyses
Contents
General information on results evaluation... 4
Results of the PT round January 2018 ... 5
- General outcome ... 5 - Aerobic microorganisms, 30 °C... 6 - Enterobacteriaceae ... 8 - Thermotolerant Campylobacter ... 10 - Listeria monocytogenes ... 11 - Salmonella ... 14
- Escherichia coli O157 ... 15
- Pathogenic Vibrio spp. ... 16
- Yersinia enterocolitica ... 18
Outcome of the results of individual laboratory – assessment ... 20
- Box plot ... 21
Test material and quality control ... 26
- Test material ... 26
- Quality control of the mixtures ... 27
References ... 28
Annex 1: Results obtained by the participants
General information on results evaluation
Statistical evaluation of the results
Highly deviating values that did not belong to a strictly normal distribution after log10 transformation were identified as statistical outliers (Grubbs’ test modified by Kelly (1)). In some cases, subjective adjustments were made to set limits based on knowledge of the mixture’s contents. Outliers and false results were not included in the calculations of means and standard deviations. Results reported as “> value” were excluded from the evaluation. Results reported as “< value” were interpreted as being zero (negative result). All reported results are presented in Annex 1.
According to EN ISO/IEC 17043, for which the proficiency testing programme is accredited, it is mandatory for the participating laboratories to report method information for all their analyses. Method information is sometimes difficult to interpret, since many laboratories report a medium that that is not included in the standard method they refer to. Results from laboratories that report contradictory data on methods/media have either been excluded from the method analysis, or been added to the group of “Others”, together with results from methods and media that are only used by 1-2 laboratories.
Mean values and standard deviations are normally provided for the different analyses. When the total number of reported results for an analysis is fewer than 20, the median is provided instead of the mean value. For method groups with fewer than 5 results, only the number of false results and outliers are provided.
Uncertainty of measurement for the assigned values
The uncertainty of measurement for an assigned value is calculated as the standard deviation divided by the square root of the number of correct results (”standard error”). The assigned value of evaluated parameters is the mean value of the participants results.
Table and figure legends
Tables
N number of laboratories that performed the analysis n number of laboratories with satisfactory result m mean value in log10 cfu ml
-1
(false results and outliers excluded) s standard deviation (false results and outliers excluded)
F number of false positive or false negative results < number of low outliers
> number of high outliers global results for the analysis values discussed in the text
Figures
Histograms of the analytical results for each mixture are presented. The mean value of the results is indicated in each histogram.
values within the interval of acceptance (Annex 1) outliers
false negative results
Results of the PT round January 2018
General outcome
Samples were sent to 154 laboratories, 32 in Sweden, 106 in other European countries, and 16 outside Europe. Of the 144 laboratories that reported results, 44 (31 %) provided at least one result that received an annotation. In the previous round with similar analyses (January 2017), the proportion was 44 %.
Individual results for each analysis of the PT round are listed in Annex 1 and are also available on the website after logging in: www2.slv.se/absint.
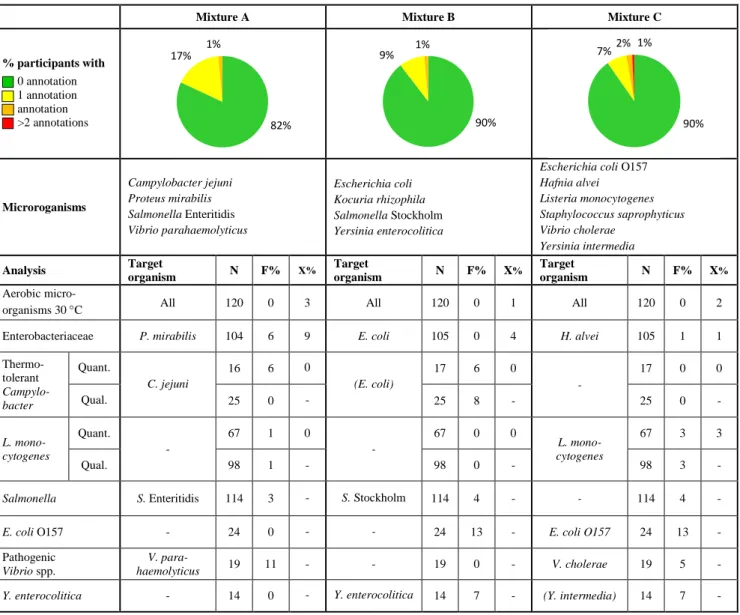
Table 1 Microorganisms in each mixture and % of deviating results (N: number of
reported results, F%: false positive or false negative, X%: outliers).
Mixture A Mixture B Mixture C
% participants with 0 annotation 1 annotation annotation >2 annotations Microroganisms Campylobacter jejuni Proteus mirabilis Salmonella Enteritidis Vibrio parahaemolyticus Escherichia coli Kocuria rhizophila Salmonella Stockholm Yersinia enterocolitica
Escherichia coli O157 Hafnia alvei Listeria monocytogenes Staphylococcus saprophyticus Vibrio cholerae Yersinia intermedia Analysis Target organism N F% X% Target organism N F% X% Target organism N F% X% Aerobic
micro-organisms 30 °C All 120 0 3 All 120 0 1 All 120 0 2
Enterobacteriaceae P. mirabilis 104 6 9 E. coli 105 0 4 H. alvei 105 1 1
Thermo-tolerant Campylo-bacter Quant. C. jejuni 16 6 0 (E. coli) 17 6 0 - 17 0 0 Qual. 25 0 - 25 8 - 25 0 - L. mono-cytogenes Quant. - 67 1 0 - 67 0 0 L. mono-cytogenes 67 3 3 Qual. 98 1 - 98 0 - 98 3 -
Salmonella S. Enteritidis 114 3 - S. Stockholm 114 4 - - 114 4 -
E. coli O157 - 24 0 - - 24 13 - E. coli O157 24 13 -
Pathogenic Vibrio spp.
V.
para-haemolyticus 19 11 - - 19 0 - V. cholerae 19 5 -
Y. enterocolitica - 14 0 - Y. enterocolitica 14 7 - (Y. intermedia) 14 7 - - no target organism or no value; (microorganism) false positive before confirmation
* the results are not evaluated
82% 17% 1% 90% 9% 1% 90% 7%2% 1%
Aerobic microorganisms, 30
°C
Mixture A
The strain of Proteus mirabilis was present in the highest concentration and was main target organism for the analysis. The results were distributed around a distinct peak, and two low and two high outliers were reported. Three laboratories reported swarming of the strain on the plates; problems with counting colonies however does not appear to have been an overall issue for the laboratories.
Mixture B
The strains of Escherichia coli and Kocuria rhizophila were present in the highest concentrations and were the main target organisms for the analysis. The results were distributed around a distinct peak. One low outlier was reported.
Mixture C
The strains of Hafnia alvei and Staphylococcus saprophyticus were present in the highest concentrations and were the main target organisms for the analysis. The results were distributed around a distinct peak, and two low outliers were reported.
General remarks
As a whole, the analyses were unproblematic for the laboratories. The mean values for the different methods and media were similar. Outliers could not be attributed to the use of a specific method or medium.
The majority of the laboratories followed either NMKL 86:2013 (33 %), ISO 4833-1:2013 (22 %) or used 3M™ Petrifilm™ Aerobic Count (19 %). Compared to previous PT rounds, only a small number of laboratories followed the older versions NMKL 86:2003 or ISO 4833:2003. Four laboratories (3 %) used TEMPO® AC (bioMérieux® SA, Marcy l`Etoile, France), which is based on MPN (Most Probable Number). The sample is here incubated in a card that contains small wells with different volumes. A substrate in the card emits fluorescence when hydrolysed by the microorganisms, and the concentration is determined by the emitted fluorescence. The remaining 10 % of the laboratories followed national or laboratory/company-specific methods.
Both the NMKL and ISO methods prescribe incubation on Plate Count Agar (PCA) at 30 °C for 72 h. For Petrifilm AC there is however a variation, depending on which method that is followed. For example, AOAC® 990.12 prescribes incubation at 35 °C for 48 h while AFNOR 3M 01/1-09/89 prescribes 30 °C for 72 h.
In addition to PCA and Petrifilm AC, Milk Plate Count Agar (MPCA), Tryptic Soya Agar (TSA) and Tryptone Glucose Extract agar (TGE) were used.
Note: After the publication of the preliminary results, a few laboratories have noted that some of their results were incorrectly reported. E.g. the two low outliers for mixture A are (according to the laboratories themselves) incorrectly reported, and the correct results are within the accepted intervals for the analysis. The same has been noted for one of the low outliers for mixture C. Corrections of the reported results are however not possible to make after the publication of the preliminary results. The first reported values have therefore been used in the statistical evaluation, and they also remain in tables and figures in this report.
Results from analysis of aerobic microorganisms
Medium N Mixture A Mixture B Mixture C
n m s F < > n m s F < > n m s F < > All results 120 116 4.230 0.134 0 2 2 119 4.529 0.235 0 1 0 118 4.814 0.152 0 2 0 PCA 67 66 4.199 0.127 0 1 0 66 4.551 0.234 0 0 0 65 4.809 0.155 0 1 0 Petrifilm AC 23 22 4.271 0.126 0 1 0 23 4.473 0.262 0 0 0 22 4.827 0.147 0 1 0 MPCA 9 8 4.282 0.210 0 0 1 8 4.539 0.272 0 1 0 9 4.826 0.135 0 0 0 TSA 8 8 4.290 0.101 0 0 0 9 4.586 0.240 0 0 0 9 4.810 0.202 0 0 0 TGE 4 4 - - 0 0 0 4 - - 0 0 0 4 - - 0 0 0 TEMPO AC 4 4 - - 0 0 0 4 - - 0 0 0 4 - - 0 0 0 Other* 5 4 4.266 0.177 0 0 1 5 4.385 0.152 0 0 0 5 4.799 0.085 0 0 0
* The group Other includes e.g. nutrient agar (NA) and Compact Dry™ TC.
A A B B C C 0 10 20 30 40 50 2 2.5 3 3.5 4 4.5 5 5.5 6 Aerobic microorganisms 30 C Without remark False negative Outlier log 10 CFU per ml N um b e r of r e s u lt s ↓ 4.230 0 10 20 30 40 50 2 2.5 3 3.5 4 4.5 5 5.5 6 Aerobic microorganisms 30 C PCA Petrifilm AC MPCA TSA TGE TEMPO AC Other log 10 CFU per ml N um b e r of r e s u lt s ↓ 4.230 0 10 20 30 40 50 2 2.5 3 3.5 4 4.5 5 5.5 6 Aerobic microorganisms 30 C Without remark False negative Outlier log 10 CFU per ml N um b e r of r e s u lt s 4.529 ↓ 0 10 20 30 40 50 2 2.5 3 3.5 4 4.5 5 5.5 6 Aerobic microorganisms 30 C PCA Petrifilm AC MPCA TSA TGE TEMPO AC Other log 10 CFU per ml N um b e r of r e s u lt s 4.529 ↓ 0 10 20 30 40 50 2 2.5 3 3.5 4 4.5 5 5.5 6 Aerobic microorganisms 30 C Without remark False negative Outlier log 10 CFU per ml N um be r of r e s u lt s 4.814 ↓ 0 10 20 30 40 50 2 2.5 3 3.5 4 4.5 5 5.5 6 Aerobic microorganisms 30 C PCA Petrifilm AC MPCA TSA TGE TEMPO AC Other log 10 CFU per ml N um be r of r e s u lt s 4.814 ↓
Enterobacteriaceae
Mixture A
The strain of Proteus mirabilis was target organism for the analysis. The majority of the results were distributed around a distinct peak. However nine low outliers were reported, as well as six false negative results. The same mixture was used in the PT round January 2017 – and similar number of deviating results were reported at that time. Among users of 3M™ Petrifilm™ Enterobacteriaceae (Petrifilm EB) only one low outlier was reported, and it is possible that P. mirabilis was easier to distinguish due to the colour indicator present in this medium. Low outliers and false negative results in the mixture were otherwise reported almost exclusively by users of Violet Red Bile Glucose agar (VRBG), which however at the same time was the most common medium.
Mixture B
The strain of Escherichia coli was target organism for the analysis. The results were distributed around a distinct peak, and two low and two high outliers were reported.
Mixture C
The strain of Hafnia alvei was target organism. The results were distributed around a distinct peak, and one low outlier and one false negative result were reported.
General remarks
As a whole, the analyses were unproblematic for the laboratories. The exceptions were the low outliers and the false negative results for mixture A. The mean values for the different methods and media were however very similar, for all three mixtures.
As in previous PT rounds, most laboratories reported following either NMKL 144:2005 (47 %), Petrifilm EB (21 %) or ISO 21528-2:2004 (11 %). Six laboratories (6 %) stated that they followed ISO 21528-1:2004, which is a method based on MPN (Most Probable Number) for the analysis of Enterobacteriaceae. The two ISO methods were during 2017 replaced by ISO 21528-1:2017 (MPN) and ISO 21528-2:2017 (colony-count technique). The MPN method is recommended when the expected level of Enterobacteriaceae is lower than 100 cfu g-1. The new ISO methods were however not implemented by more than a few laboratories. Three laboratories reported following ISO 21528-2:2017, whereas no laboratory reported following ISO 21528-1:2017. Still, the mean values were highly similar, irrespective of which ISO version that was used, for all three mixtures. As in the analysis of aerobic microorganisms, a few laboratories used fluorescence-based methods (TEMPO® Enterobacteriaceae).
Enterobacteriaceae are Gram-negative and oxidase-negative bacteria that ferment glucose with the production of acid by-products. On VRBG – which is used in both NMKL 144 and ISO 21528-2 – they form pink/red colonies, with our without a bile precipitation zone. The appearance is similar on Petrifilm EB, which also includes a colour indicator for the detection of acid by-products and a plastic film for detection of gas production. It is possible that these factors contributed to the low numbers of false negative results and low outliers for Petrifilm EB.
Presumptive colonies in VRBG shall according to NMKL 144:2005 be confirmed with an oxidase test. In comparison, ISO 21528-2:2004 states that presumptive colonies shall be confirmed with both an oxidase test and a glucose fermentation test. In the new revision ISO 21528-2:2017 this has been modified slightly and glucose agar has been replaced by glucose oxidation/fermentation (OF) medium. Oxidase-negative colonies that produce acid from glucose in the OF medium are confirmed as Enterobacteriaceae.
Results from analysis of Enterobacteriaceae
Medium N Mixture A Mixture B Mixture C
n m s F < > n m s F < > n m s F < > All results 105 89 4.085 0.224 6 9 0 101 4.193 0.175 0 2 2 103 4.345 0.232 1 1 0 VRBG 72 58 4.052 0.226 5 8 0 69 4.189 0.174 0 1 2 71 4.359 0.242 0 1 0 Petrifilm EB 22 21 4.149 0.242 0 1 0 22 4.216 0.197 0 0 0 21 4.356 0.201 1 0 0 TSA/VRB 3 3 - - 0 0 0 3 - - 0 0 0 3 - - 0 0 0 TEMPO EB 3 3 - - 0 0 0 3 - - 0 0 0 3 - - 0 0 0 Other* 5 4 4.064 0.096 1 0 0 4 4.150 0.156 0 1 0 5 4.258 0.203 0 0 0
* The group Other includes e.g. Compact Dry™ ETB.
A A B B C C 0 10 20 30 40 2 2.5 3 3.5 4 4.5 5 5.5 6 Enterobacteriaceae Without remark False negative Outlier log 10 CFU per ml N um b e r of r e s u lt s 4.085 ↓ * 0 10 20 30 40 2 2.5 3 3.5 4 4.5 5 5.5 6 Enterobacteriaceae VRBG Petrifilm EB TSA/VRB TEMPO EB Other log 10 CFU per ml N um b e r of r e s u lt s 4.085 ↓ * 0 10 20 30 40 2 2.5 3 3.5 4 4.5 5 5.5 6 Enterobacteriaceae Without remark False negative Outlier log 10 CFU per ml N um b e r of r e s u lt s 4.193 ↓ 0 10 20 30 40 2 2.5 3 3.5 4 4.5 5 5.5 6 Enterobacteriaceae VRBG Petrifilm EB TSA/VRB TEMPO EB Other log 10 CFU per ml N um b e r of r e s u lt s 4.193 ↓ 0 10 20 30 40 2 2.5 3 3.5 4 4.5 5 5.5 6 Enterobacteriaceae Without remark False negative Outlier log 10 CFU per ml N um be r of r e s u lt s 4.345 ↓ * 0 10 20 30 40 2 2.5 3 3.5 4 4.5 5 5.5 6 Enterobacteriaceae VRBG Petrifilm EB TSA/VRB TEMPO EB Other log 10 CFU per ml N um be r of r e s u lt s 4.345 ↓ *
Thermotolerant Campylobacter
Mixture A
The strain of Campylobacter jejuni was target organism for the analysis. One laboratory reported a false negative result in the quantitative analysis.
Mixture B
No target organism was present in mixture B. Laboratories may however have identified Escherichia coli, which is false positive for the analysis. False positive results were reported by one laboratory in the quantitative analysis and by two laboratories in the qualitative analysis.
Mixture C
No target organism was present in the mixture. All laboratories reported correct results, in both the quantitative and in the qualitative analysis.
General remarks
Only 17 and 25 laboratories participated in the quantitative and qualitative analysis, respectively. The results are therefore difficult to evaluate statistically. However, the analyses appear to have been unproblematic for the majority of the laboratories.
NMKL 119 and ISO 10272 (different versions) were the most used methods in both the quantitative and the qualitative analysis. The majority of the laboratories had also started using the new ISO 10271-2:2017 and 10272-2:2017 instead of the older ISO 10272-1:2006 and 10272-2:2006. The three laboratories that followed the older ISO 10272-2:2006 in the quantitative analysis all reported lower results compared to the other methods, but it cannot be ruled out that it is simply due to chance. In the qualitative analysis, one laboratory stated that they followed ISO 17995, which is a method for detection of Campylobacter in water. Here, it can also be mentioned that NMKL 119:2007 being revised and the new version will likely be more similar to the new ISO 10272-2:2017 and 10272-1:2017.
The results in the quantitative analysis had a relatively large distribution, something that has been observed in several earlier PT rounds. Campylobacter spp. are sensitive to mechanical stress and to dehydration. Differences in the results might therefore be a consequence of a too harsh surface spreading. At the National Food Agency, Campylobacter spp. are carefully spread onto pre-warmed plates and the final drying of the bacterial suspension is done by leaving the lids of the plates slightly open (maximum five minutes).
The majority of the laboratories (76 %) in the qualitative analysis used Bolton broth for the enrichment step, but Preston broth was also used. In the selective step, most laboratories used modified charcoal cephoperazone deoxycholate agar (mCCDA) (84 %) but CampyFood Agar and CHROMagar™ were also used. In the quantitative analysis all laboratories except one reported using mCCDA.
All laboratories except one in each analysis reported performing some kind of confirmation. Campylobacter spp. are Gram-negative, oxidase-positive and catalase-positive – they can also be confirmed by their appearance in a microscope. The bacteria are normally spiral-shaped rods that display a characteristic darting/rotating movement. C. jejuni, C. coli and C. lari can further be separated by differences in their hydrolysis of hippurate and indoxyl acetate, and their sensitivity/resistance to nalidixic acid and cephalothin. A few laboratories in this PT also reported using Maldi-TOF or API CAMPY for the confirmation.
Results from quantitative analysis of thermotolerant Campylobacter
Method N Mixture A Mixture B Mixture C
n Med* s F < > n m s F < > n m s F < > All results 17 15 1.97 - 1 0 0 16 - - 1 - - 17 - - 0 - - ISO 10272-2:2017 9 7 2.10 - 1 0 0 8 - - 1 - - 9 - - 0 - - NMKL 119:2007 5 5 2.10 - 0 0 0 5 - - 0 - - 5 - - 0 - - ISO 10272-2:2006 3 3 - - 0 0 0 3 - - 0 - - 3 - - 0 - - Other 0 - - - - * Med = median
Results from qualitative analysis of thermotolerant Campylobacter
Method N Mixture A Mixture B Mixture C
n +/- F n +/- F n +/- F
All results 25 25 Pos 0 23 Neg 2 25 Neg 0
NMKL 119:2007 13 13 Pos 0 11 Neg 2 13 Neg 0
ISO 10272-1:2017 6 6 Pos 0 6 Neg 0 6 Neg 0
ISO 10272-1:2006 3 3 Pos 0 3 Neg 0 3 Neg 0
Other* 3 3 Pos 0 3 Neg 0 3 Neg 0
* The group Other includes e.g. ISO 17995, VIDAS, and one PCR method.
A A
Listeria monocytogenes
Mixture A
No target organism for the analysis was present in the mixture. One laboratory in the quantitative analysis and one laboratory in the qualitative analysis reported a false positive result.
Mixture B
No target organism for the analysis was present in the mixture. All laboratories in both the quantitative and the qualitative analysis reported correct results.
Mixture C
The strain of Listeria monocytogenes was target organism. The results in the quantitative analysis were distributed around a distinct peak and two low outliers, as
0 2 4 6 8 10 0 0.5 1 1.5 2 2.5 3 3.5 4 Thermotolerant Campylobacter Without remark False negative Outlier log 10 CFU per ml N um b e r of r e s u lt s 1.890 ↓ 0 2 4 6 8 10 0 0.5 1 1.5 2 2.5 3 3.5 4 Thermotolerant Campylobacter ISO 10272-2:2017 NMKL 119:2007 ISO 10272-2:2006 log 10 CFU per ml N um b e r of r e s u lt s 1.890 ↓
well as two false negative results were reported. In the qualitative analysis, three false negative results were reported.
General remarks
As a whole, the analyses were without major problems for the laboratories. Outliers and false results could not be attributed to the use of a specific method or medium.
New versions of ISO 11290-1 (qualitative) and 11290-2 (quantitative) were published during 2017. The revised methods distinguish between detection/enumeration of Listeria spp. and Listeria monocytogenes, and changes have also been made e.g. in which confirmation tests that should be performed. The qualitative method ISO 11290-1:2017 is based on primary enrichment in half-Fraser broth, followed by secondary enrichment in Fraser broth. Aliquots from both enrichments are plated onto selective agar for Listeria according to Ottaviani & Agosti (ALOA) and onto another selective medium chosen by the laboratory. In the quantitative method ISO 11290-2:2017 the sample is first suspended in buffered peptone water (BPW) or in half-Fraser broth and material is then transferred from these to ALOA. The quantitative and qualitative methods used in NMKL 136:2010 are similar to the ones in the ISO methods.
Typical colonies of L. monocytogenes are on ALOA blue-green due to β-glucosidase activity, and are surrounded by an opaque halo due to hydrolysis of inositol in the medium. The halo is sometimes weak, or may not be present at all. L. monocytogenes can be confirmed by microscopy, catalase test, and by tests of β-haemolysis and carbohydrate utilazation (fermentation of rhamnose and xylose). L. monocytogenes is catalase-positive, displays β-haemolysis on blood agar, and ferments rhamnose but not xylose. Confirmation can also be done by the increased and decreased β-haemolysis displayed by L. monocytogenes in the presence of Staphylococcus aureus and Rhodococcus equi respectively (CAMP test).
ISO 11290-1 and ISO 11290-2 were the most commonly used methods in both the quantitative and the qualitative analysis (29 % and 45 % of the laboratories respectively). The majority of the laboratories however still followed the older versions of the respective methods. In addition to ISO 11290 and NMKL 136, many laboratories used RAPID'L.mono or VIDAS. Listeria Precis™ was also used by a few laboratories in both analyses. RAPID'L.mono uses a chromogenic medium that identifies the enzyme phosphatidylinositol phospholipase C (PI-PLC) in L. monocytogens, and that also identifies both Listeria spp. and L. monocytogens by the fact that they do not metabolize xylose. The method in Listeria Precis™ in a similar way uses a chromogenic medium that detects Listeria spp. and L. monocytogenes β-glucosidase cleavage of X-glucoside in the medium Brilliance™ Listeria. In comparison, VIDAS is based on detection of specific L. monocytogenes antigen, by a method based on ELFA (Enzyme Linked Fluorescent Assay). The alternative methods are all validated by AFNOR and/or NordVal.
As in previous proficiency testing rounds, ALOA and Oxoid Brilliance™ Listeria-agar (previously OCLA) were the most used media. However PALCAM, Listeria monocytogenes blood agar (LMBA), Oxford Listeria selective agar, and other types of chromogenic media were also used. Confirmation was carried out by most laboratories. In total, confirmation (in various forms) was carried out by 85 % and 88 % of the laboratories in the qualitative and quantitative analyses respectively.
Results from quantitative analysis of Listeria monocytogenes
Method N Mixture A Mixture B Mixture C
n m s F < > n m s F < > n m s F < > All results 67 66 - - 1 - - 67 - - 0 - - 63 2.418 0.114 2 2 0 ISO 11290-2:1998 /Amd 1:2004 16 16 - - 0 - - 16 - - 0 - - 15 2.405 0.069 0 1 0 NMKL 136:2010* 16 15 - - 1 - - 16 - - 0 - - 15 2.417 0.122 1 0 0 RAPID'L.mono 15 15 - - 0 - - 15 - - 0 - - 14 2.416 0.094 0 1 0 ISO 11290-2:2017 10 10 - - 0 - - 10 - - 0 - - 9 2.393 0.110 1 0 0 Listeria Precis 4 4 - - 0 - - 4 - - 0 - - 4 - - 0 0 0 ISO 11290-2:1998 4 4 - - 0 - - 4 - - 0 - - 4 - - 0 0 0 Other 2 2 - - 0 - - 2 - - 0 - - 2 - - 0 0 0
* The group NMKL 136:2010 includes one laboratory that followed NMKL 136:2007.
Results from qualitative analysis of Listeria monocytogenes
Method N Mixture A Mixture B Mixture C
n +/- F n +/- F n +/- F
All results 98 97 Neg 1 98 Neg 0 95 Pos 3
RAPID'L.mono 17 17 Neg 0 17 Neg 0 17 Pos 0
VIDAS 16 16 Neg 0 16 Neg 0 16 Pos 0
NMKL 136:2010* 14 13 Neg 1 14 Neg 0 14 Pos 1
ISO 11290-1:1996
/Amd 1:2004 14 14 Neg 0 14 Neg 0 14 Pos 0
ISO 11290-1:2017 12 12 Neg 0 12 Neg 0 12 Pos 1
PCR method 9 9 Neg 0 9 Neg 0 9 Pos 0
Listeria Precis 5 5 Neg 0 5 Neg 0 5 Pos 0
ISO 11290-1:1996 2 2 Neg 0 2 Neg 0 2 Pos 0
Other** 9 9 Neg 0 9 Neg 0 9 Pos 1
* The group NMKL 136:2010 includes one laboratory that followed NMKL 136:2007.
** The group Other includes IDF 143A:1995, SwabSure ListeriaP, as well as national and/or company-specific methods. C C 0 10 20 30 40 0 0.5 1 1.5 2 2.5 3 3.5 4 Listeria monocytogenes Without remark False negative Outlier log 10 CFU per ml N um be r of r e s u lt s ↓ 2.418 0 10 20 30 40 0 0.5 1 1.5 2 2.5 3 3.5 4 Listeria monocytogenes ISO 11290-2:2004 NMKL 136:2010 RAPID' L .mono ISO 11290-2:2017 Listeria Precis ISO 11290-2:1998 Other log 10 CFU per ml N um be r of r e s u lt s ↓ 2.418
Salmonella
Mixture A
The strain of Salmonella Enteritidis was target organism for the analysis. Three laboratories reported a false negative result.
Mixture B
The strain of Salmonella Stockholm was target organism for the analysis. Five laboratories reported a false negative result. The concentration of the strain in the mixture was low, approximately 5 CFU ml-1 in the internal tests at the National Food Agency. With the reservation that all laboratories appear to have performed some type of enrichment step, the low concentration is however unlikely to be the reason for the false negative results, unless only a very small volume was inoculated into the enrichment medium.
Mixture C
No target organism for the analysis was present in the mixture. Four laboratories reported a false positive result.
General remarks
Most laboratories followed the traditional methods ISO 6579-1:2017 or NMKL 71:1999, which are highly similar. Both are based on pre-enrichment in buffered peptone water (BPW), followed by selective enrichment in Rappaport-Vassiliadis soy peptone broth (RVS) and subsequent inoculation onto selective xylose lysine deoxycholate agar (XLD) and another selective medium chosen by the laboratory. In contrast to NMKL 71:1999, ISO 6579-1:2017 also includes selective enrichment in Muller-Kauffmann tetrathionate/novobiocin broth (MKTTn). RVS can also be replaced by modified semi-solid Rappaport-Vassiliadis enrichment media (MSRV) for the analysis of motile Salmonella. Confirmation is by biochemical (e.g. mannitol and urea) and serological (e.g. Salmonella polyvalent O and H antisera) tests. Confirmation (in various forms) was in this proficiency testing carried out by the majority (95 %) of the laboratories.
The new ISO 6579-1:2017 was published in the beginning of 2017 and replaced previous ISO-methods for the detection of Salmonella. The majority of the 33 laboratories that analysed according to ISO however still followed the older versions 6579:2002 or ISO 6579:2002/Amd 1:2007. Among the changes in the new version from 2017 are that detection of β-galactosidase and indole is optional in the confirmation step, whereas positive results for agglutination against both O and H antigen is required for a strain to be considered as Salmonella.
Users of NMKL methods can in addition to NMKL 71:1999 also choose to follow NMKL 187:2016. The latter method is intended for detection of motile Salmonella and, similarly to ISO 6579-1:2017, uses MSRV instead of RVS during the selective enrichment step. Notably, all three laboratories that followed NMKL 187 stated that they followed the older version NMKL 187:2006. The new version from 2016 contains clarifications regarding the choice of the selective agar medium complementary to XLD, and the concentration of Novobiocin in MSRV. It also contains new paragraphs regarding pre-enrichment of samples from primary animal production, faecal samples and swab samples.
On XLD, which was used by the majority of the laboratories, typical Salmonella form transparent red colonies with a black center. As a complementary medium to
XLD, the laboratories mainly used chromogenic media such as Brilliance™ Salmonella, Rambach™ agar, and brilliant green agar (BGA).
Similar to the analysis of Listeria monocytogenes, several laboratories chose to analyse with VIDAS or RAPID'Salmonella, instead of with the traditional ISO and NMKL methods. Regardless of the choice of method or medium, the analyses were without major problem for the laboratories. No obvious differences between results from the different methods and media could be identified. No false results were reported by the 5 % of the laboratories that did not perform a confirmation.
Results from qualitative analysis of Salmonella
Method N Mixture A Mixture B Mixture C
n +/- F n +/- F n +/- F
All results 114 111 Pos 3 109 Pos 5 110 Neg 4
NMKL 71:1999 31 30 Pos 1 30 Pos 1 31 Neg 0
ISO 6579-1:2017 15 15 Pos 0 15 Pos 0 13 Neg 2
VIDAS* 15 15 Pos 0 14 Pos 1 15 Neg 0
PCR method 14 14 Pos 0 14 Pos 0 13 Neg 1
ISO 6579:2002 10 10 Pos 0 9 Pos 1 9 Neg 1
ISO 6579:2002/Amd 1:2007 8 8 Pos 0 8 Pos 0 8 Neg 0
RAPID'Salmonella 6 5 Pos 1 6 Pos 0 6 Neg 0
NMKL 187:2007 3 3 Pos 0 3 Pos 0 3 Neg 0
Other** 12 11 Pos 1 10 Pos 2 12 Neg 0
* The group VIDAS includes two laboratories that analysed with MINI VIDAS®.
** The group Other includes Neogen® Reveal® 2.0 Salmonella, Oxoid Salmonella Precis™, as well as national
and/or company-specific methods.
Escherichia coli O157
Mixture A
No target organism for the analysis was present in the mixture. All laboratories reported a correct negative result.
Mixture B
No target organism for the analysis was present in the mixture. Three laboratories reported a false positive result.
Mixture C
The strain of Escherichia coli O157 was target organism for the analysis. Three laboratories reported a false negative result. The concentration of the strain in the mixture was low, approximately 6 CFU ml-1 in the internal tests at the National Food Agency. With the reservation that all laboratories appear to have performed some type of enrichment step, the low concentration is however unlikely to be the reason for the false negative results, unless only a very small volume was inoculated into the enrichment medium.
General remarks
Only 24 laboratories performed the analysis, and the results are therefore difficult to evaluate statistically. However no obvious differences between the methods and media
can be identified. Confirmation test (in various forms) were performed by 20 of the laboratories (83 %) which is a similar number compared to the January PT round 2017.
Most laboratories followed either of the traditional methods NMKL 164:2005 or ISO 16654:2001. The methods in these are similar: enrichment in modified tryptone soya broth (mTSB), followed by immunomagnetic separation and isolation on cefixime tellurite sorbitol MacConkey agar (CT-SMAC) and another medium selected by the laboratory. Confirmation is by a test for indole production as well as agglutination with E. coli O157 antiserum. Here, it can also be mentioned that NMKL 164:2005 is undergoing revision – there is however no estimated date for when a new version will be available.
The majority of the laboratories (63 %) incubated on CT-SMAC, but sorbitol MacConkey agar (SMAC) and CHROMagar™ O157 were also used. On CT-SMAC and SMAC, bacteria that ferment sorbitol (most non-pathogenic E. coli) are distinguished from those that do not (most E. coli O157). The inclusion of cefimixin and tellurite in CT-SMAC makes it more selective compared to SMAC, and it inhibits growth of many Proteus spp. och Aeromonas spp., which often are sorbitol-negative. Sorbitol-negative E. coli O157 form transparent colonies on CT-SMAC and SMAC, approximately 1-2 mm in diameter and with a dark center. Sorbitol-positive E. coli instead form red colonies on these media. In comparison, on CHROMagar™ E. coli O157 form mauve (purple) colonies that can be distinguished from other colonies (blue or colourless) that may grow on this medium.
Results from qualitative analysis of E. coli O157
Method N Mixture A Mixture B Mixture C
n +/- F n +/- F n +/- F
All results 24 24 Neg 0 21 Neg 3 21 Pos 3
ISO 16654:2001* 6 6 Neg 0 5 Neg 1 4 Pos 2
NMKL 164:2005 4 4 Neg 0 4 Neg 0 4 Pos 0
PCR method 4 4 Neg 0 4 Neg 0 4 Pos 0
VIDAS 3 3 Neg 0 3 Neg 0 3 Pos 0
Other** 7 7 Neg 0 5 Neg 2 6 Pos 1
* The group ISO 16654:2001 includes one laboratory that used a modified version of the standard. ** The group Other includes national and/or company-specific methods.
Pathogenic Vibrio spp.
Mixture A
The strain of Vibrio parahaemolyticus was target organism for the analysis. Two laboratories reported a false negative result.
Mixture B
No target organism for the analysis was present in the mixture. All laboratories reported a correct negative result.
Mixture C
The strain of Vibrio cholerae was target organism for the analysis. One laboratory reported a false negative result.
General remarks
Only 19 laboratories performed the analysis, and most used similar methods and media. The results are therefore difficult to evaluate statistically. The majority of the laboratories however reported correct results, and the small number of false negative results could not be attributed to the use of a specific method or medium. All laboratories except one also stated that they performed some kind of confirmation.
A new version of the ISO method, ISO 21872-1:2017, was published during 2017. It replaces the previous ISO/TS 21872-1:2007, as well as ISO/TS 21872-2:2007. The new method contains several changes, including the performance of confirmation with biochemical and/or PCR methods.
The majority of the laboratories followed either NMKL 156:1997 or ISO/TS 21872-1:2007. Only one laboratory stated that they followed the new ISO 21872-1:2017. The new ISO method follows roughly the same principle as the previous version. Primary and secondary enrichment is in alkaline peptone water with 2 % NaCl (APW 2 %) and is followed by inoculation onto selective thiosulphate citrate bile salts sucrose agar (TCBS). Another medium, chosen by the laboratory, is inoculated in parallel to TCBS. Subcultured colonies are subsequently confirmed by biochemical tests, PCR and/or real-time PCR. The procedure in NMKL 156:1997 is similar to ISO 21872-1:2017, but also includes enrichment in salt polymyxin broth (SP). The NMKL method only includes biochemical confirmation tests.
All laboratories stated that colonies were isolated on TCBS. One laboratory reported parallel isolation on CHROMagar™ Vibrio. Bile salts in TCBS inhibit the growth of Gram-positive microorganisms, whereas a high pH promotes the growth of V. cholerae. On this medium, Vibrio spp. form either green of yellow colonies, depending on if they ferment sucrose or not. V. parahaemolyticus and V. vulnificus (sucrose-negative) normally form blue-green colonies, 2-3 mm in diameter, whereas V. cholerae (sucrose-positive) normally form yellow colonies, 1-2 mm in diameter.
At the National Food Agency, the strain of V. parahaemolyticus in mixture A formed typical colonies on TCBS, regardless of whether the enrichment was carried out in APW 2 % or in SP. Similarly, the strain of V. cholerae in mixture C formed characteristic yellow colonies on TCBS. On a few plates, for unknown reasons, some colonies of V. cholerae were however smaller than the rest. Still, during the confirmation both of these colony morphologies were oxidase-positive and sensitive to vibriostaticum O129. During an initial test of mixture A, P. mirabilis formed small, atypical and light green colonies on TCBS. These colonies were however oxidase-negative and could therefore be distinguished from V. parahaemolyticus during the confirmation.
Results from qualitative analysis of pathogenic Vibrio spp.
Method N Mixture A Mixture B Mixture C
n +/- F n +/- F n +/- F
All results 19 17 Pos 2 19 Neg 0 18 Pos 1
NMKL 156:1997 9 8 Pos 1 9 Neg 0 9 Pos 0
ISO/TS 21872-1:2007 7 6 Pos 1 7 Neg 0 7 Pos 0
ISO/TS 21872-1:2007/Cor 1:2008 1 1 Pos 0 1 Neg 0 0 Pos 1
ISO 21872-1:2017 1 1 Pos 0 1 Neg 0 1 Pos 0
Other* 1 1 Pos 0 1 Neg 0 1 Pos 0
Yersinia enterocolitica
Mixture A
No target organism for the analysis was present in the mixture. All laboratories reported a correct negative result.
Mixture B
The strain of Yersinia enterocolitica was target organism for the analysis. One laboratory reported a false negative result.
Mixture C
No target organism for the analysis was present. The mixture did however contain a strain of Yersinia intermedia, which is false positive for the analysis. At the National Food Agency, the strain was oxidase-negative and did not display agglutination against neither O:3 nor O:9 antisera. It was however difficult to identify as Y. intermedia with API 20E. One laboratory reported a false positive result.
The concentration of Y. intermedia in the mixture was low, approximately 5 CFU ml-1 in the internal tests at the National Food Agency. With the reservation that all laboratories appear to have performed some type of enrichment step, it is unlikely that any of the (correct) negative results are due to Y. intermedia not being detected at all.
General remarks
Only 14 laboratories performed the analysis, and the results are therefore difficult to evaluate statistically. The low number of false results that were reported could not be attributed to the use of a specific method or medium. All laboratories stated that they performed some type of confirmation.
The majority of the laboratories followed ISO 10273 (different versions) or NMKL 117:1996. Half of the laboratories that used the ISO method followed the new ISO 10273:2017, which contains several important changes compared to the previous version. These include that characteristic Y. enterocolitica can be confirmed either by the traditional biochemical methods or by detection of the chromosomal virulence-associated gene ail by real-time PCR. Here, it can also be mentioned that NMKL 117:1996 is currently being revised – there is however no estimated date for when a new version will be available.
The method in ISO 10273:2017 is based on parallel enrichment in peptone sorbitol bile salts broth (PSB) and irgasan ticarcillin potassium chlorate broth (ITC). Samples are subsequently streaked onto cefsulodin irgasan novobiocin agar (CIN) as well as (optionally) on a second chromogenic medium selected by the laboratory. Characteristic colonies are confirmed by biochemical methods or by real-time PCR. Cold enrichment can also be performed, but is not mandatory. The method in NMKL 117:1996 differs somewhat and is instead based on pre- and cold enrichment in PSB, as well as selective enrichment in modified Rappaport broth (MRB). After the enrichment steps, samples are inoculated onto CIN, but Salmonella/Shigella sodium deoxycholate calcium chloride agar (SSDC) can also be used. Presumptive colonies are subcultured onto bromthymol blue saccharose agar (BS) and sucrose-positive colonies (yellow) are selected for confirmation.
On CIN, colonies of Y. enterocolitica have a typical appearance; a red “bull’s eye” center and an outer transparent zone. At the National Food Agency, the strain of Y. enterocolitica in mixture B formed typical colonies on both CIN and BS. The strain was also oxidase-negative in the confirmation. All laboratories in this proficiency
testing reported incubating on CIN. Chromogenic media that can be used in parallel with CIN are e.g. YECA (2), YeCM (3) and CHROMagar™ Yersinia.
Laboratories that use NMKL methods can also choose a method based on real-time PCR, NMKL 163:2013. The sample is here enriched in semi-selective PSB or in non-selective tryptone soya broth with yeast extract (TSBY). The enrichment step is followed by DNA extraction and real-time PCR aimed at the ail gene in Y. enterocolitica, in a similar way as in ISO 10273:2017. Inoculation from the enrichment broth onto CIN is optional. NMKL 163:2013 is suitable when high contamination levels are suspected, and the use of NMKL 117:1996 or ISO 10273:2003 is recommended for samples with low suspected levels of Y. enterocolitica.
Results from qualitative analysis of Yersinia enterocolitica
Method N Mixture A Mixture B Mixture C
n +/- F n +/- F n +/- F
All results 14 14 Neg 0 13 Pos 1 13 Neg 1
ISO 10273:2017 4 4 Neg 0 4 Pos 0 4 Neg 0
ISO 10273:2003 4 4 Neg 0 4 Pos 0 3 Neg 1
NMKL 117:1996 3 3 Neg 0 3 Pos 0 3 Neg 0
Other* 3 3 Neg 0 2 Pos 1 3 Neg 0
Outcome of the results of individual laboratory - assessment
The reported results of all participating laboratories are listed in Annex 1, together with the minimum and maximum accepted values for each analysis. Results that received a remark (false results and outliers) are highlighted in yellow, with bold font.
It is the responsibility of the participating laboratories to correctly report results according to the instructions. When laboratories incorrectly report their results, for example by stating “pos” or “neg” for quantitative analyses, the results cannot be correctly processed. Such incorrectly reported results are normally excluded. Inclusion and further processing of such results may still be done, after manual assessment in each individual case.
Z-scores (see below) for individual analyses are shown in Annex 2 and can be used as a tool by laboratories when following up on the results.
The laboratories are not grouped or ranked based on their results. The performance of a laboratory as a whole can only be evaluated from the number of false results and outliers that are listed in Annex 1 and below the box plots.
Information on the results processing and recommendations for follow-up work are given in the Scheme Protocol (4). Samples for follow-up can be ordered, free of charge via our website: www.livsmedelsverket.se/en/PT-extra
In order to allow comparison of the results from different analyses and mixtures, all results are transformed into standard values (scores). For quantitative analyses, a z-score is either positive or negative, depending on whether the individual result is higher or lower than the mean value calculated from all laboratory results for each analysis. The box plots are based on the z-scores listed in Annex 2, and give a comprehensive view of the achievement of each laboratory. A small box, centred around zero, indicates the results of that individual laboratory, with false results excluded, are close to the general mean values calculated for all laboratory results. The range of z-scores is indicated by the size of the box and, for most laboratories, by lines and/or circles above and beneath the box. For each laboratory, the number of false results and outliers are also listed in the tables below the box plots.
Box plots and numbers of deviating results for each laboratory
- Z-scores are calculated according to the formula: z = (x-m)/s, where x is the result of the individual laboratory, m is the mean of the results of all participating laboratories, and s is the standard deviation of the participating laboratories, after removing outliers and false results.
- Outliers are included in the figures after being calculated to z-scores in the same way as for other results.
- False results do not generate any z-scores, and are not included in “No. of results”. - Correct results for qualitative analyses and correct negative results for quantitative
analyses without target organism generate a z-score of 0.
- The laboratory median value is illustrated by a horizontal red line in the box.
- The box includes 50 % of a laboratory’s results (25 % of the results above the median and 25 % of the results below the median). The remaining 50 % are illustrated by lines and circles outside the box.
- A circle is for technical reasons shown in the plot when a value deviates to certain degree* from the other values. This does not by itself indicate that the value is an outlier.
- z-scores >+4 and <−4 are positioned at +4 and −4, respectively, in the plot.
- The background is divided by lines and shaded fields to simplify identifying the range in which the results are located.
* < [lowest value in the box −1,5 × (highest value in the box− lowest value in the box)] or > [highest value in the box + 1,5 × (highest value in the box − lowest value in the box)].
z -val ue Lab no. 1254 1545 1594 1970 2035 2043 2050 2058 2072 2151 2221 2324 2386 2402 2637 2704 2745 2764 2842 2920 No. of results 15 15 12 24 15 3 9 12 23 18 15 5 9 9 15 15 15 14 19 9 False positive - - - -False negative - - - 1 - - 1 - - - 2 -Low outliers - - - - 2 - - 2 - - - 1 - - 1 - - -High outliers - - - -False negative ? - - - --4 -2 0 2 4
z -val ue Lab no. 2944 3031 3057 3155 3159 3305 3327 3347 3457 3587 3595 3626 3868 3878 3923 4064 4100 4171 4246 4288 No. of results 12 18 23 15 15 21 15 3 14 6 17 19 21 5 10 6 15 12 12 -False positive - - 1 - - - 1 - - - 1 - - - - -False negative - - 3 - - - 1 - - - - 1 1 - - - - -Low outliers 1 - - - 1 - - -High outliers - - - -False negative ? - - - -RSZ - - - -SD - - - -z -val ue Lab no. 4339 4352 4400 4560 4562 4633 4635 4664 4683 4817 4840 4879 4889 4944 4980 5018 5028 5100 5128 5182 No. of results 15 24 5 6 27 15 12 18 - 21 20 - 18 15 15 21 3 6 9 5 False positive - - - - 1 - - - 1 - - - -False negative - - 1 - 2 - - - 1 Low outliers - - - 1 - - - 1 -High outliers - - 1 - - - 1 False negative ? - - - --4 -2 0 2 4 -4 -2 0 2 4
z -val ue Lab no. 5204 5220 5221 5329 5333 5342 5352 5447 5545 5553 5615 5632 5701 5801 5808 5883 5950 5993 6109 6175 No. of results 21 15 - 6 6 - 15 3 8 20 12 5 3 6 6 14 30 3 9 11 False positive - - - -False negative - - - 1 - - - 1 - - - 1 Low outliers - - - 1 - - - -High outliers - - - -False negative ? - - - -RSZ - - - -SD - - - -z -val ue Lab no. 6224 6232 6253 6343 6352 6368 6443 6456 6594 6658 6686 6720 6762 6870 6944 6971 7182 7232 7242 7248 No. of results - 8 12 12 9 18 3 12 - 6 14 9 5 3 3 6 6 3 - 17 False positive - - - 1 False negative - 1 - - - 1 - 1 - - - -Low outliers - 1 - 2 - - - 2 - - - 1 High outliers - - - -False negative ? - - - --4 -2 0 2 4 -4 -2 0 2 4
z -val ue Lab no. 7253 7282 7330 7334 7564 7627 7688 7728 7750 7825 7876 7882 7930 7940 7962 7968 8019 8042 8066 8068 No. of results 18 9 12 8 6 9 24 12 9 15 15 8 15 3 15 17 24 3 9 15 False positive - - - 1 - - - - 1 - - - 1 - - - -False negative - - - 2 - - 1 - - - -Low outliers - - - 1 High outliers - - - 1 - - - -False negative ? - - - -RSZ - - - -SD - - - -z -val ue Lab no. 8165 8252 8260 8313 8333 8397 8435 8568 8626 8628 8734 8742 8756 8766 8862 8918 8955 9002 9034 9078 No. of results 21 12 15 15 15 12 15 14 11 18 6 9 - 18 3 12 30 17 15 6 False positive - - - 2 - - - 1 - -False negative - - - 1 2 - - - -Low outliers - - 1 - - - -High outliers - - - 1 False negative ? - - - --4 -2 0 2 4 -4 -2 0 2 4
z -val ue Lab no. 9217 9269 9429 9436 9441 9453 9512 9555 9662 9716 9747 9890 9903 9950 No. of results 7 3 9 24 15 12 6 6 15 12 6 6 11 -False positive 1 - - - -False negative 1 - - - 1 -Low outliers - - - -High outliers - - - -False negative ? - - - --4 -2 0 2 4
Test material and quality control
Test material
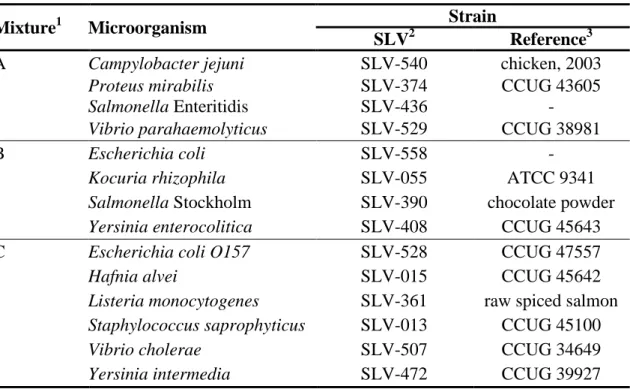
Each laboratory received three manufactured freeze-dried microbial mixtures, designated A-C. The test material was freeze-dried in portions of 0.5 ml in vials, as described by Peterz and Steneryd (5). Before analysing the samples, the contents of each vial had to be dissolved in 254 ml of sterile diluent. The organisms present in the mixtures are listed in Table 2.
Table 2. Microorganisms present in mixtures A-C.
Mixture1 Microorganism Strain
SLV2 Reference3
A Campylobacter jejuni SLV-540 chicken, 2003
Proteus mirabilis SLV-374 CCUG 43605
Salmonella Enteritidis SLV-436 -
Vibrio parahaemolyticus SLV-529 CCUG 38981
B Escherichia coli SLV-558 -
Kocuria rhizophila SLV-055 ATCC 9341
Salmonella Stockholm SLV-390 chocolate powder
Yersinia enterocolitica SLV-408 CCUG 45643
C Escherichia coli O157 SLV-528 CCUG 47557
Hafnia alvei SLV-015 CCUG 45642
Listeria monocytogenes SLV-361 raw spiced salmon
Staphylococcus saprophyticus SLV-013 CCUG 45100
Vibrio cholerae SLV-507 CCUG 34649
Yersinia intermedia SLV-472 CCUG 39927
1
The links between the mixtures and the randomised sample numbers are shown in Annex 1. 2 Internal strain identification no. at the National Food Agency.
3 Origin or culture collection (CCUG: Culture Collection University of Gothenburg, Sweden ; ATCC: American Type Culture Collection)
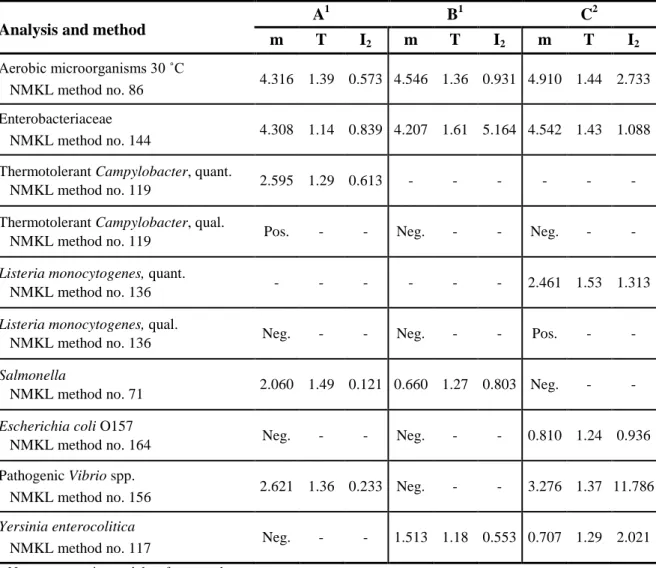
Quality control of the mixtures
It is essential to have aliquots of homogeneous mixture and equal volume in all vials in order to allow comparison of all freeze-dried samples from one mixture. Quality control is performed on 10 randomly chosen vials in conjunction with manufacturing of the mixtures or on 5 vials if an “old” mixture was used and the last quality control was performed more than 6 months ago. Homogeneity of a mixture is approved if, for each analysis, the values obtained for the test of reproducibility (T) and the test “Index of dispersion” between vials (I2) do not simultaneously exceed 2.6 and 2.0, respectively. (For definitions of T and I2, see references 6 and 7 respectively.)
Table 3. Concentration mean (m), T and I2 values from the quality control of the mixtures; m is expressed in log10 cfu (colony forming units) per ml of sample.
Analysis and method A
1 B1 C2 m T I2 m T I2 m T I2 Aerobic microorganisms 30 ˚C NMKL method no. 86 4.316 1.39 0.573 4.546 1.36 0.931 4.910 1.44 2.733 Enterobacteriaceae NMKL method no. 144 4.308 1.14 0.839 4.207 1.61 5.164 4.542 1.43 1.088 Thermotolerant Campylobacter, quant.
NMKL method no. 119 2.595 1.29 0.613 - - - - Thermotolerant Campylobacter, qual.
NMKL method no. 119 Pos. - - Neg. - - Neg. - -
Listeria monocytogenes, quant.
NMKL method no. 136 - - - 2.461 1.53 1.313
Listeria monocytogenes, qual.
NMKL method no. 136 Neg. - - Neg. - - Pos. - -
Salmonella
NMKL method no. 71 2.060 1.49 0.121 0.660 1.27 0.803 Neg. - -
Escherichia coli O157
NMKL method no. 164 Neg. - - Neg. - - 0.810 1.24 0.936 Pathogenic Vibrio spp.
NMKL method no. 156 2.621 1.36 0.233 Neg. - - 3.276 1.37 11.786
Yersinia enterocolitica
NMKL method no. 117 Neg. - - 1.513 1.18 0.553 0.707 1.29 2.021
– No target organism and therefore no value
1 n = 5 vials analysed in duplicate
2
References
1. Kelly, K. 1990. Outlier detection in collaborative studies. J. Assoc. Off. Anal. Chem. 73:58–64.
2. Denis, M., Houard, E., Labbé, M., Fondrevez, M. & Salvat., G. 2011. A selective chromogenic plate, YECA, for the detection of pathogenic Yersinia enterocolitica: specificity, sensitivity, and capacity to detect pathogenic Y. enterocolitica from pig tonsils. J. Pathog. 2011:296275.
3. Weagant, S.D. 2008. A new chromogenic agar medium for detection of potentially virulent Yersinia enterocolitica. J. Microbiol. Methods. 72:185–190 4. Anonymous, 2015. Protocol, Microbiology. Drinking Water & Food, The
National Food Agency, Sweden.
5. Peterz, M., Steneryd, A.C. 1993. Freeze-dried mixed cultures as reference samples in quantitative and qualitative microbiological examinations of food. J. Appl. Bacteriol. 74:143–148.
6. Mooijman, K.M., During, M. & Nagelkerke, N.J.D. 2003. MICROCRM: Preparation and control of batches of microbiological materials consisting of capsules. RIVM report 250935001/2003. RIVM, Bilthoven, Holland.
7. Heisterkamp, S.H., Hoekstra, J.A., van Strijp-Lockefeer, N.G.W.M., Havelaar, A.H., Mooijman, K.A., in’t Veld, P.H., Notermans, S.H.W., Maier, E.A., Griepink, B. 1993. Statistical analysis of certification trials for microbiological reference materials. Luxembourg: Commission of the European Communities, Report EUR 15008 EN.
Lab no. Lab no.
A B C A B C A B C A B C A B C A B C A B C A B C A B C A B C A B C
1254 1 3 2 4.18 4.41 4.57 3.91 4.04 3.93 - - - <1 <1 2.45 - - - Neg Neg Pos Pos Pos Neg - - - 1254
1545 3 2 1 4.28 4.76 5.04 4.19 4.54 4.69 - - - <0 <0 2.48 - - - Neg Neg Pos Pos Pos Neg - - - 1545
1594 3 1 2 4.23 4.6 4.94 4.2 4.34 4.53 - - - Pos Pos Neg Neg Neg Pos - - - 1594
1970 3 1 2 4.11 4.45 4.95 3.79 4.52 4.52 1.97 <1 <1 <1 <1 2.38 Pos Neg Neg Neg Neg Pos Pos Pos Neg - - - Pos Neg Pos - - - 1970
2035 3 1 2 - - - 2 3.5 3.5 - - - <1 <1 2.3 - - - Neg Neg Pos - - - Pos Neg Pos Neg Pos Neg 2035 2043 3 2 1 - - - Pos Pos Neg - - - 2043
2050 3 2 1 4.15 4.43 4.84 4.09 4.24 4.33 - - - Pos Pos Neg - - - 2050
2058 1 2 3 3.1 4.06 3.78 - - - <1 <1 2.4 - - - Neg Neg Pos Pos Pos Neg - - - 2058
2072 2 1 3 4.23 4.65 4.79 4.11 4.34 4.48 0.95 <1 <1 <1 <1 2.08 Pos Neg Neg Neg Neg Pos Pos Pos Neg - - - Neg Neg Pos - - - 2072
2151 1 3 2 4.53 4.45 4.65 - - - 2.2 0 0 0 0 2.46 Pos Neg Neg Neg Neg Pos Pos Pos Neg - - - 2151
2221 2 3 1 4.43 4.4 4.7 4.38 4.05 4.2 - - - <2 <2 2.44 - - - Neg Neg Pos Pos Pos Neg - - - 2221
2324 1 3 2 4.18 4.45 4.82 <1 4.17 4.47 - - - 2324
2386 3 1 2 4.28 4.4 4.91 - - - Neg Neg Pos Pos Pos Neg - - - 2386
2402 1 2 3 4.34 5.08 4.96 1.9 4.72 4.34 - - - Pos Pos Neg - - - 2402
2637 3 1 2 4.22 4.53 4.71 4.2 4.27 4.23 - - - <1 <1 2.58 - - - Neg Neg Pos Pos Pos Neg - - - 2637
2704 2 3 1 4.38 4.45 4.88 3.9 4.16 4.57 - - - <1 <1 2.46 - - - Neg Neg Pos Pos Pos Neg - - - 2704
2745 1 2 3 4.15 4.41 4.72 4.17 4.19 4.41 - - - 0 0 1.34 - - - Neg Neg Pos Pos Pos Neg - - - 2745
2764 3 1 2 - 4.71 4.79 4.11 3.97 4 - - - Neg Neg Pos Pos Pos Neg Neg Neg Pos - - - 2764
2842 3 1 2 - - - <1 <1 <1 <1 <1 2.28 Pos Neg Neg Neg Neg Pos - - - Neg Neg Pos Pos Neg Pos Neg Neg Neg 2842 2920 2 1 3 4.19 4.68 4.98 4.1 4.4 4.61 - - - Pos Pos Neg - - - 2920
2944 2 3 1 4.14 4.97 5.14 3.15 4.16 4.12 - - - Neg Neg Pos Pos Pos Neg - - - 2944
3031 2 3 1 4.2 4.11 4.86 4.11 4.08 4.32 - - - <1 <1 2.43 - - - Neg Neg Pos Pos Pos Neg - - - Pos Neg Pos - - - 3031
3057 3 1 2 4.23 4.6 5 4.57 4.36 4.6 - - - <1 <1 <1 Pos Neg Neg Neg Neg Neg Pos Pos Pos Neg Neg Pos Pos Neg Neg Neg Pos Neg 3057 3155 1 2 3 4.25 4.49 4.76 4.06 4.13 4.18 - - - 0 0 2.45 - - - Neg Neg Pos Pos Pos Neg - - - 3155
3159 3 2 1 4.22 4.47 4.77 3.36 4.2 4.32 - - - <1 <1 2.49 - - - Neg Neg Pos Pos Pos Neg - - - 3159
3305 3 2 1 4.46 4.57 4.86 4.2 4.43 4.56 - - - 0 0 2.3 Pos Neg Neg Neg Neg Pos Pos Pos Neg Neg Neg Pos - - - 3305
3327 2 1 3 4 4.36 4.63 3.91 3.9 4.28 - - - 0 0 2.37 - - - Neg Neg Pos Pos Pos Neg - - - 3327
3347 3 2 1 - - - Pos Pos Neg - - - 3347
3457 1 2 3 - - - 4.06 4.04 4.44 - - - 0 0 2.21 - - - Neg Neg Pos Pos Pos Neg - - - Neg Neg Pos - - - 3457
3587 2 3 1 4.09 4.35 4.7 3.69 4.03 4.4 - - - 3587
3595 2 1 3 4.19 4.35 4.65 3.95 4.04 4.35 1.28 <1 <1 <1 <1 2.22 - - - Neg Neg Pos Pos Pos Pos - - - 3595
3626 2 1 3 4.2 - - 3.9 4 4.2 2.1 <1 <1 <1 <1 2.4 Pos Neg Neg Neg Neg Pos Pos Pos Neg - - - 3626
3868 1 2 3 4.15 4.39 4.76 4.08 4.08 4.15 2.11 0 0 0 0 2.4 Pos Neg Neg Neg Neg Pos Pos Pos Neg - - - 3868
3878 2 1 3 4.16 4.97 4.68 - - - Pos Neg Neg - - - 3878
3923 3 1 2 4.43 5.41 4.89 3.5 4.11 4.25 - - - Pos Neg Pos - - - Pos Neg Pos - - - 3923
4064 2 3 1 4.2 4.33 4.8 4.1 4.15 4.37 - - - 4064
4100 2 3 1 4.1 4.5 4.84 2 4.27 4.44 - - - <1 <1 2.38 - - - Neg Neg Pos Pos Pos Neg - - - 4100
4171 2 1 3 4.3 4.56 4.8 4.11 4.32 4.49 - - - Pos Pos Neg Neg Neg Pos - - - 4171
4246 3 1 2 4.21 4.21 4.63 4.08 4.05 4.1 - - - Neg Neg Pos Pos Pos Neg - - - 4246
4288 1 3 2 - - - 4288
4339 2 3 1 - - - <1 <1 2.3 - - - Neg Neg Pos Pos Pos Neg Neg Neg Pos - - - Neg Pos Neg 4339 4352 1 3 2 4.26 4.2 4.94 4.23 4.2 4.59 - - - <1 <1 2.38 Pos Neg Neg Neg Neg Pos Pos Pos Neg Neg Neg Pos Pos Neg Pos - - - 4352
4400 2 1 3 4.78 4.48 4.82 0 4.23 4.1 - - - 4400
4560 1 3 2 - - - Neg Neg Pos Pos Pos Neg - - - 4560
4562 1 2 3 4.3 4.51 4.84 <2 4.4 4.28 1.47 <1 <1 <1 <1 2.5 Pos Neg Neg Neg Neg Pos Pos Pos Neg Neg Neg Neg Pos Neg Pos Neg Pos Pos 4562 4633 1 3 2 4.23 4.76 4.89 4.15 4.17 4.52 - - - <1 <1 2.7 - - - Neg Neg Pos Pos Pos Neg - - - 4633
4635 3 1 2 3.94 4.88 5 1.78 4.13 4.07 - - - Neg Neg Pos Pos Pos Neg - - - 4635
4664 3 1 2 4.11 4.58 4.87 4.56 4.43 4.71 - - - 0 0 2.36 - - - Neg Neg Pos Pos Pos Neg - - - Pos Neg Pos - - - 4664
4683 2 3 1 - - - 4683
4817 3 1 2 4.18 4.76 4.72 - - - <1 <1 2.41 - - - Neg Neg Pos Pos Pos Neg Neg Neg Pos Pos Neg Pos Neg Pos Neg 4817 4840 1 3 2 4.06 4.5 5.32 3.66 4.14 4.84 1.54 <1 <1 <1 <1 2.67 Pos Neg Neg Neg Neg Pos Pos Pos Pos - - - 4840
4879 1 3 2 - - - 4879
4889 1 3 2 4.2 4.45 4.97 4.15 4.23 4.83 - - - 0 0 2.38 - - - Neg Neg Pos Pos Pos Neg - - - Pos Neg Pos - - - 4889
Listeria
monocytogenes Salmonella
Escherichia coli O157
(VT-neg)
Pathogenic
Vibrio spp. Yersinia enterocolitica
Thermotolerant
Campylobacter
Vial Aerobic
micro-organisms 30 °C Enterobacteriaceae
Thermotolerant
Campylobacter Listeria monocytogenes
Annex 1 Results of the participating laboratories - January 2018
All results are in log10 cfu per ml sample. Results reported as "< value" have been regarded as zero. Results reported as "> value" are exluded from the calculations. A dash indicates the analysis was not performed. Outliers and false results are highlighted and summarized for each analysis at the end of the table