Rapport 5 - 2013
by Laurence Nachin, Christina Normark and Irina Boriak
Proficiency testing
Food Microbiology
Internal and external control for microbiological analyses of food and drinking water
All analytical activities require work of a high standard that is accurately documented. For this purpose, most laboratories carry out some form of internal quality assurance, but their analytical work also has to be evaluated by an independent party. Such external quality control of laboratory competence is commonly required by accreditation bodies and can be done by taking part in proficiency testing (PT).
In a proficiency test, identical test material is analysed by a number of laboratories using their routine methods. The organiser evaluates the results and compiles them in a report.
The National Food Agency’s PT program offers
External and independent evaluation of laboratories analytical competence.
Improved knowledge of analytical methods used by laboratories with respect to various types of organisms.
Expert support
Tool for inspections regarding accreditation. Free extra material for follow-up analyses
For more information visit our website: www.slv.se/absint/index.aspx
The National Food Agency’s reference material
As a complement to the proficiency testing, National Food Agency produces also reference material (RM) for internal quality control: a total of 7 RM for food and drinking water microbiological analyses, including pathogens, are available.
Information available on our website: www.slv.se/RM-micro
Edition
Version 1 (2013-03-18)
Editor in chief
Annika Rimland, Head of Science Department, National Food Agency
Responsible for the scheme
Proficiency Testing
Microbiology – Food
January 2013
- Quantitative analyses Aerobic microorganisms, 30 °C Enterobacteriaceae Thermotolerant campylobacter Listeria monocytogenes - Qualitative analyses Thermotolerant campylobacter Listeria monocytogenes SalmonellaEscherichia coli O157 Pathogenic Vibrio spp. Yersinia enterocolitica
Laurence Nachin, Christina Normark, Irina Boriak
Abbreviations
Media
ALOA Agar Listeria Ottaviani & Agosti APW 2% Alcaline peptone water, 2 % NaCl BriS Brilliance Salmonella-agar
BPW Buffered peptone water
CIN Cefsulodin-irgasan-novobiocin-agar
CT-SMAC Cefixime-tellurite-sorbitol-MacConkey-agar LMBA Listeria monocytogenes Blood-agar
MPCA Milk Plate Count Agar PSB Phosphate-sorbitol-broth
PCA Plate Count Agar
RVS Rappaport-Vassiliadis-soya peptone-broth SMAC Sorbitol MacConkey Agar
SPB Salt-polymyxin-broth
TCBS Thiosulfate citrate salt sucrose Agar XLD Xylose lysine deoxycholate agar VRBG Violet Red Bile Glucose agar Organisations
ISO International Organization for Standardization NMKL Nordic Committee for Food Analyses
Contents
General information on results evaluation... 4
Results of the PT round January 2013 ... 5
- General outcome ... 5 - Aerobic microorganisms, 30°C... 6 - Enterobacteriaceae ... 7 - Thermotolerant campylobacter ... 8 - Listeria monocytogenes ... 10 - Salmonella ... 11
- Escherichia coli O157 ... 11
- Pathogenic Vibrio spp.. ... 12
- Yersinia enterocolitica ... 13
Outcome of the results of individual laboratory – assessment ... 14
- Box plot ... 14
Test material and quality control ... 20
- Test material ... 20
- Quality control of the mixtures ... 21
References ... 22
Annex 1: Results obtained by the participants
General information on results evaluation
Statistical evaluation of the results
Highly deviating values that did not belong to a strictly normal distribution were identified as statistical outliers (Grubbs’ test modified by Kelly (1). In some cases, subjective adjustments were made to set limits, based on knowledge of the mixture’s contents. Outliers and false results were not included in the calculations of means and standard deviations. Results reported as “>value” were excluded from the evaluation. Results reported as “<value” were interpreted as being zero (negative result). All reported results are presented in Annex 1.
According to EN ISO/IEC 17043, for which the proficiency testing programme organised by the National Food Agency is accredited since early 2012, it is mandatory for the participating laboratories to give method information for all analyses for which they report results. For this PT round, between 52 and 98 % of the participants reported which method and/or medium they used for the different analyses. Method information is sometimes difficult to interpret, e.g. many laboratories choose a medium that differs from that in the reported standard methods. Therefore, in the following section, results have been grouped according to the method or the medium used to perform the analysis.
Tables and figures legend Tables
n number of laboratory that performed the analysis
m results mean value in log10 cfu/ml (false results and outliers excluded)
s results standard deviation
F number of false positive or false negative results
< number of low outliers
> number of high outliers
global results for the analysis values discussed in the text
Figures
Histograms of all analytical results obtained for each mixture are presented. The mean value of the analysis results is indicated in each histogram.
values within the interval of acceptance (Annex 1) outliers
false negative results
Results of the PT round January 2013
General outcome
Samples were sent to 180 laboratories, 34 in Sweden, 126 in other European countries, and 20 outside Europe. 175 laboratories reported results, 114 (65 %) provided at least one result that received an annotation. In the previous round (January 2011) with similar analyses, the proportion was 38 %.
Individual results for each analysis of the PT round are listed in annex 1 and are also available on the website after logging in: www.slv.se/absint/index.aspx .
Table 1 Microorganisms in each mixture and % of deviating results (F%: false positive
or false negative, Out: outliers).
Mixture A Mixture B Mixture C
% participants with 0 annotation 1 annotation 2 annotations >2 annotations Organisms Staphylococcus saprophyticus Hafnia alvei Listeria seeligeri Listeria ivanovii Salmonella Enteritidis Vibrio cholera Micrococcus sp. Aeromonas caviae Campylobacter lari Listeria monocytogenes Vibrio parahaemolyticus Micrococcus sp. Yersinia enterocolitica Campylobacter jejuni Salmonella Dublin Escherichia coli O157
Analysis Target F% Out Target F% Out Target F% Out
Aerob. microorg, 30 oC S. saprophyticus H. alvei 0 4 Micrococcus A. caviae 0 3 Micrococcus 1 7
Enterobacteriaceae H. alvei 1 3 (A. caviae) 28 - Y. enterocolitica 40 16
Thermo. camp. Quant. - 1 - C. lari 45 0 C. jejuni 10 0 Qual. 2 - 17 - 7 - L. mono-cytogenes Quant. (L. ivanovii) (L. seeligeri) 6 - L. monocytogenes 0 5 - 0 - Qual. 11 - 1 - 3 -
Salmonella S. Enteritidis 0 - - 2 - S. Dublin 5 -
E. coli O157 - 3 - - 3 - E. coli O157 3 -
Path. Vibrio spp. V. cholera 11 - V.
parahaemoly-ticus 33 - - 6 - Y. enterocolitica - 0 - - 0 - Y. enterocolitica 0 - 86% 9% 5% 0% 67% 27% 6% 0% 53% 41% 5% 1%
Aerobic microorganisms, 30 °C
Mixture AThe colonies counted for this analysis were mainly from the strains of Staphylococcus
saprophyticus and Hafnia alvei present at the highest concentration in mixture A.
Mixture B
The colonies counted for this analysis were mainly from the strains of Micrococcus sp. and Aeromonas caviae present at the highest concentration in mixture B.
Mixture C
The colonies counted for this analysis were mainly from the strain of Micrococcus sp. present at the highest concentration in mixture C.
Results of aerobic microorganisms analysis
Medium Mixture A Mixture B Mixture C
n m s F < > n m s F < > n m s F < > Total 150 4.98 0.25 0 2 4 151 4.67 0.27 0 2 3 151 4.46 0.14 1 4 6 PCA 68 4.95 0.26 0 1 2 68 4.61 0.24 0 1 2 68 4.46 0.12 1 2 2 Petrifilm™ 19 5.10 0.21 0 0 1 19 4.77 0.33 0 0 0 19 4.39 0.16 0 1 1 MPCA 6 4.85 0.12 0 0 0 6 4.63 0.19 0 0 0 6 4.46 0.10 0 0 0 A A B B C C 0 5 10 15 20 25 30 2 2,5 3 3,5 4 4,5 5 5,5 6
log10 CFU per ml
5.0 N o o f re s u lt s * * 0 4 8 12 16 20 2 2,5 3 3,5 4 4,5 5 5,5 6 PCA Petrifilm MPCA N o o f re s u lt s
log10 CFU per ml
0 5 10 15 20 25 30 2 2,5 3 3,5 4 4,5 5 5,5 6
log10 CFU per ml
4.7 N o o f re s u lt s 0 5 10 15 20 2 2,5 3 3,5 4 4,5 5 5,5 6
log10 CFU per ml
N o o f re s u lt s 0 10 20 30 40 50 60 2 2,5 3 3,5 4 4,5 5 5,5 6
log10 CFU per ml
4.5 N o o f re s u lt s * * 0 10 20 30 40 2 2,5 3 3,5 4 4,5 5 5,5 6
log10 CFU per ml
N o o f re s u lt s
No obvious differences in the results can be seen depending on the medium used for this analysis. However, the results are noticeably more spread for the mixture A and B than for mixture C. In the two first mixtures, counted colonies are from two different microorganisms while only from one in mixture C. It is not obvious that this is the reason for the differences in results but it can be speculated that a bigger variability in colonies appearance can lead to a higher variation in colonies enumeration.
Enterobacteriaceae
Mixture AHafnia avei was the target organism for this analysis which did not reveal special
difficulty.
Mixture B
Mixture B contained a strain of Aeromonas caviae which forms small red colonies on VRBG but is oxidase positive and therefore differentiates from enterobacteriaceae. The 34 laboratories that reported a false positive result have failed or not performed the confirmation test.
Mixture C
Yersinia enterocolitica was the main target organism for the analysis but single colonies
of Salmonella Dublin could appear as well if non- or low-diluted sample was analysed. Even though the concentration of Y. enterocolitica in mixture C was 3.5 log10 cfu/ml,
40% of the laboratories reported a false negative result. Moreover, many laboratories reported results considered as low outliers, which probably accounted for the enumeration of S. Dublin colonies only.
At NFA, Y. enterolitica formed typical but small colonies on VRBG and their enumeration did not cause difficulty after 24±2 hours incubation at 37 °C. However the small size of the colonies could explain the very high dispersion of the results as well as the high amount of false results if plates were incubated for a shorter period.
Results of enterobacteriaceae analysis
Medium Mixture A Mixture B Mixture C
n m s F < > n m s F < > n m s F < >
Total 123 4.55 0.15 1 1 3 121 - - 34 - - 121 3.26 0.14 48 19 1
VRBG 62 4.53 0.13 0 1 1 60 - - 11 - - 60 3.25 0.16 22 7 1
Petrifilm™ 17 4.65 0.12 0 0 1 17 - - 7 - - 16 3.14 0.12 7 6 0
A A
C C
Most of the laboratories used VRBG plate or Petrifilm™ for the analysis of enterobacteriaceae which did not lead to significant results differences when analysing mixture A. On the other hand, the use of Petrifilm™ is almost exclusively linked to false negative results or low outliers for the analysis of mixture C. The reason for this correlation is difficult to assess, but it might be possible that the strain of Y.
enterocolitica present in mixture C grew slower or formed colonies difficult to see on
Petrifilm™.
Thermotolerant campylobacter
Mixture AMixture A did not contain any strain of thermotolerant campylobacter
Mixture B
A strain of Campylobacter lari was target organism for this analysis but was present at low concentration in mixture B (1.4 log10 cfu/ml). It was the first time this strain was
used in the PT program. At NFA, we noticed that it grew slower than other Campylobacter strains. This, together with the low concentration, can explain the big dispersion of the results and the false negative results obtained for both the quantitative and qualitative analysis.
Mixture C
Mixture C contained a strain of Campylobacter jejuni at a concentration of 1.5 log10
cfu/ml. The analysis did not cause special difficulties but the results distribution is big. 0 10 20 30 40 50 2 2,5 3 3,5 4 4,5 5 5,5 6 log 10 CFU per ml 4.6 N o o f re s u lt s 0 6 12 18 24 30 2 2,5 3 3,5 4 4,5 5 5,5 6 VRBG Petrifilm N o o f re s u lt s log 10 CFU per ml 0 10 20 30 40 50 0 0,5 1 1,5 2 2,5 3 3,5 4 log 10 CFU per ml 3.2 N o o f re s u lt s * 0 2 4 6 8 10 0 0,5 1 1,5 2 2,5 3 3,5 4 N o o f re s u lt s log 10 CFU per ml
Results of thermotolerant campylobacter quantitative analysis
Quantitative Mixture A Mixture B Mixture C
n m s F < > n m s F < > n m s F < >
Total 19 - - 1 - - 19 1.03 0.57 9 0 0 19 0.92 0.36 1 0 0
ISO 5 - - 0 - - 5 0.90 0.53 2 0 0 5 0.98 0.15 0 0 0
NMKL 5 - - 1 - - 5 0.85 0.49 2 0 0 5 0.75 0.53 0 0 0
Results of thermotolerant campylobacter qualitative analysis
Qualitative n F n F n F Total 39 1 39 7 39 2 ISO 3 0 3 0 3 1 NMKL 9 0 9 1 9 0 B B C C
Few laboratories participate in the analysis of thermotolerant campylobacter, it is therefore quite difficult to draw any conclusion regarding the use of different methods. As a general comment, for both mixture B and C, quantitative results obtained by NFA are higher than the average results of the participants: 1.36 versus 1.03 and 1.52 versus 0.92, respectively.
The moisture of the medium can have an influence on the result: campylobacter cells are sensitive to dry plates; therefore, it is preferable to use moist plates and let the sample dry on the plate before incubation. However, if the plates are too moist, colonies tend to flow together which makes the reading more difficult. Moreover, the surface spreading on plates should be done carefully. Studies at NFA have shown that strong surface spreading gives fewer colonies on the plates than careful spreading. At NFA, a spiral spreader is used, which eliminates the variation caused by manual spreading, and can explain the higher results obtained.
0 2 4 6 8 10 0 0,5 1 1,5 2 2,5 3 3,5 4 log 10 CFU per ml 1.0 N o o f re s u lt s 0 1 2 3 4 5 0 0,5 1 1,5 2 2,5 3 3,5 4 ISO NMKL N o o f re s u lt s log 10 CFU per ml 0 2 4 6 8 10 0 0,5 1 1,5 2 2,5 3 3,5 4 log 10 CFU per ml 0.9 N o o f re s u lt s 0 1 2 3 4 5 0 0,5 1 1,5 2 2,5 3 3,5 4 N o o f re s u lt s log 10 CFU per ml
Listeria monocytogenes
Mixture A
A strain of Listeria seeligeri and of Listeria ivanovii were included in mixture A. On ALOA medium and other chromogenic medium, colonies of L. ivanovii can be misjudged as L. monocytogenes. On blood-based medium (LMBA), and medium revealing esculine hydrolysis (PALCAM and Oxford) both L. seeligeri and L. ivanovii form colonies similar to L. monocytogenes.
However, upon confirmation, these strains can be differentiated: L. seeligeri and L.
ivanovii ferment xylose while L. monocytogenes does not.
Mixture B
A strain of L. monocytogenes was present in mixture B.
Mixture C
No target organism was present in mixture C for this analysis.
Results of L. monocytogenes quantitative analysis
Method Mixture A Mixture B Mixture C
n m s F < > n m s F < > n m s F < >
Total 73 - - 4 - - 76 2.00 0.14 0 2 2 74 - - 0 - -
ISO 17 1 18 2.03 0.11 0 1 0 17 0
NMKL 12 2 13 1.98 0.12 0 1 1 12 0
Rapid L.m 16 2 15 2.00 0.12 0 0 1 15 0
Results of L. monocytogenes qualitative analysis
Method n F n F n F Total 108 11 109 0 109 2 ISO 19 2 19 0 19 0 NMKL 12 2 12 0 12 0 Rapid L.m 14 2 14 0 14 0 PCR 7 0 7 0 7 0 B B
Most of the laboratories used a chromogenic medium for isolation. No correlation between method used and false results or outliers can be concluded.
0 10 20 30 40 50 0 0,5 1 1,5 2 2,5 3 3,5 4 log 10 CFU per ml 2.0 N o o f re s u lt s 0 6 12 18 24 30 0 0,5 1 1,5 2 2,5 3 3,5 4 ISO NMKL Rapid Lm N o o f re s u lt s log 10 CFU per ml
Salmonella
Mixture A
Mixture A contained a strain of Salmonella Enteritidis.
Mixture B
Mixture B did not contain any Salmonella strain. Few atypical colonies could appear on XLD medium.
Mixture C
A strain of Salmonella Dublin, at a concentration of 13 cfu/ml, was target organism for this analysis. At NFA, this strain formed typical colonies on XLD medium but atypical white colonies on BriS chromogenic medium, after enrichment in BPW and RVS. Moreover, this strain is sensitive to temperature above 42 °C and to high concentration of MgCl2 in RVS medium (2). According to NMKL method this concentration should
not be higher than 29 g/l. These characteristics might explain the report of 7 false negative results.
Results of Salmonella qualitative analysis
Method Mixture A Mixture B Mixture C
n F n F n F Total 141 0 142 3 141 7 ISO 26 0 25 0 25 0 NMKL 32 0 32 0 32 3 VIDAS 16 0 16 0 16 1 PCR 11 0 11 0 11 0
Most of the laboratories used XLD agar together with another medium for the isolation step. No correlation between the method used and false negative result can be concluded.
Escherichia coli O157
Mixture A
Mixture A did not contain any E. coli O157 strain but a strain of Hafnia alvei which, as
E. coli O157, does not ferment sorbitol and can form beige colonies on SMAC or
CT-SMAC. However, H. alvei differentiates from E. coli O157 upon confirmation.
Mixture B
Mixture B did not contain any E. coli O157 strain but a strain of Aeromonas caviae which, as E. coli O157, does not ferment sorbitol. Although it can form beige colonies on SMAC or CT-SMAC upon direct isolation after enrichment, A. caviae differentiates from E. coli O157 in the confirmation steps of the analysis. However, at NFA, no such colonies were observed if an immuno-separation step was performed between enrichment and isolation. Only atypical pink colonies grew on SMAC plates.
Results of E. coli O157 qualitative analysis
Method Mixture A Mixture B Mixture C
n F n F n F
Total 33 1 33 1 33 1
ISO 5 0 5 0 5 0
NMKL 5 0 5 1 5 0
Almost all laboratories that reported method information for this analysis used CT-SMAC together with another medium for the isolation step. No link between method/medium used and false results can be concluded.
Pathogenic Vibrio spp.
Mixture AA strain of Vibrio cholera was target organism for this analysis and was present at a concentration of 5.0 log10 cfu/ml in mixture A. At NFA, the strain formed typical
yellow colonies on TCBS plate after enrichment in APW 2 % or SPB.
Mixture B
A strain of Vibrio parahaemolyticus was target organism for this analysis. Although the strain was present at a concentration of 4.3 log10 cfu/ml in mixture B, one third of the
laboratories that performed the analysis reported a false negative result. Upon the quality control performed at NFA, the strain formed typical blue-green colonies on TCBS plate after enrichment in APW 2 % or SPB.
Mixture C
No target organism was present in mixture C for this analysis.
Results of pathogenic Vibrio spp. qualitative analysis
Method Mixture A Mixture B Mixture C
n F n F n F
Total 18 2 18 6 18 1
ISO 6 1 6 1 6 0
NMKL 6 1 6 2 6 0
Almost all laboratories that performed the analysis used APW 2% for enrichment and TCBS agar for isolation. No correlation between method used and false results can be concluded.
Yersinia enterocolitica
Mixture A
No target organism was present in mixture A.
Mixture B
No target organism was present in mixture B.
Mixture C
Mixture C contained a Yersinia enterocolitica strain at a concentration of 3.5 log10
cfu/ml, which was also target organism for the analysis of enterobacteriaceae.
Results of Y. enterocolitica qualitative analysis
Method Mixture A Mixture B Mixture C
n F n F n F
Total 15 0 15 0 15 0
ISO 5 0 5 0 5 0
NMKL 4 0 4 0 4 0
Outcome of the results of individual laboratory - assessment
In order to allow comparison of the results from different analyses and mixtures, all the results of the analyses were transformed into standard values (z-scores). For quantitative analyses, a z-score is either positive or negative, depending on whether the individual result is higher or lower than the mean value calculated from all laboratory results for each analysis. For qualitative analyses, a z-score of zero is attributed for a correct answer. The z-scores obtained, which are listed in Annex 2, can be used as a tool by laboratories when following up on the results.
All the results from each laboratory – outliers included and false results excluded – were compiled into a box plot (Figure 1) based on their z-scores. The smaller and more centred round zero the box of a laboratory is, the closer its results are to the general mean values calculated for all laboratory results.
The laboratories were not grouped or ranked based on their results. However, for each laboratory, the numbers of false results and outliers are presented below the box plots. These results are also highlighted in Annex 1, where all the reported results are listed, and the minimum and maximum accepted values for each analysis are stated.
Information on the results processing and recommendations for follow-up work are given in the Scheme Protocol (3). Samples for follow-up can be ordered, free of charge via our website:www.slv.se/pt_extra
Box plots and numbers of deviating results for each laboratory
- The plots are based on the laboratory results from all analyses transformed into z-scores calculated according to the formula: z = (x-m)/s, where x is the result of the individual laboratory, m is the mean of the results of all participating laboratories, and s is the standard deviation.
- Correct results for quantitative analyses without target organism and for qualitative analyses generate a z-value of 0.
- The laboratory median value is illustrated by a horizontal red line in the box.
- The box includes 50 % of a laboratory’s results (25 % of the results above the
median and 25 % of the results below the median). The remaining 50 % are illustrated by lines and circles outside the box.
- Very deviating results are represented by circles and are calculated as follow: the lowest result in the box − 1.5 × (the highest result in the box − the lowest result in the box) or the highest result in the box + 1.5 × (the highest result in the box − the lowest result in the box). z-scores higher than +4 and less than −4 are positioned at +4 and −4, respectively, in the plot.
- The background is divided by lines and shaded fields to indicate ranges in order to
z-sc ore Lab no 1081 1254 1594 1970 2035 2050 2058 2072 2151 2324 2386 2402 2458 2553 2637 2670 2704 2720 2745 2764 No. of results 15 18 12 23 14 9 6 21 6 8 9 9 29 27 14 6 14 5 15 14 False positive - - - 1 - - 1 - - - 1 - 1 False negative - - - 1 1 - 1 - - - 1 - 1 3 1 - - -Low outliers - - - 1 - - - 1 High outliers 1 - - - - z-sc ore Lab no 2842 2920 3126 3159 3305 3346 3457 3511 3533 3588 3626 3803 3825 3829 3868 3923 3925 4064 4100 4153 No. of results 17 8 10 11 15 23 17 8 8 15 21 17 6 6 19 12 6 6 21 20 False positive 2 - 1 - - 1 - 3 - - - -False negative 5 1 1 1 1 - 1 1 1 - - 1 - - 2 - - - - 1 Low outliers - - 1 - - - 1 1 - - - - 1 - - - -High outliers - - - --4 -2 0 2 4 -4 -2 0 2 4
z-sc ore Lab no 4171 4246 4288 4339 4352 4353 4400 4562 4586 4633 4635 4664 4683 4713 4817 4840 4889 4955 4980 5018 No. of results 10 10 - 21 20 6 - 30 3 9 11 17 13 15 23 17 14 14 14 24 False positive 1 1 - - 1 - - - -False negative 1 1 - - - 1 1 2 - 1 1 1 1 1 -Low outliers - - - - 1 - - 1 - - - 1 1 - - 1 1 - - -High outliers - - - - 4 - - - 1 - - - - z-sc ore Lab no 5028 5100 5188 5197 5200 5204 5220 5304 5329 5333 5350 5352 5447 5533 5545 5553 5615 5632 5701 5774 No. of results 3 6 2 8 12 22 12 8 5 6 10 7 2 6 5 19 12 8 3 17 False positive - - 1 1 - 1 - 1 - - 1 - - - 1 - - - - -False negative - - - 1 - - 1 - 1 2 1 - - 1 - - - 1 Low outliers - 3 - - - -High outliers - - - 1 - - - --4 -2 0 2 4 -4 -2 0 2 4
z-sc ore Lab no 5801 5850 5883 5893 5993 6109 6138 6175 6224 6232 6253 6343 6352 6368 6380 6443 6456 6527 6594 6658 No. of results 5 2 15 10 3 9 15 3 4 7 12 9 7 18 10 9 10 6 11 6 False positive 1 - - 1 - - - - 1 1 - - 1 - 2 - 1 - 1 -False negative - 1 - 1 - - - - 1 1 - - 1 - - - 1 - - -Low outliers - - - 1 -High outliers - - - - z-sc ore Lab no 6707 6762 6860 6971 7024 7096 7182 7191 7207 7232 7242 7248 7253 7282 7302 7330 7334 7449 7543 7564 No. of results 14 5 29 4 4 11 4 7 5 6 8 18 12 10 6 8 9 6 12 26 False positive - 1 1 1 1 1 1 - - - 1 - - 1 - 1 - - - 2 False negative - - - 1 1 - 1 2 1 - - 3 - - - 2 Low outliers - - - 3 - - - -High outliers - - - --4 -2 0 2 4 -4 -2 0 2 4
z-sc ore Lab no 7596 7627 7631 7688 7728 7793 7825 7876 7882 7930 7940 7962 8066 8068 8165 8247 8255 8260 8313 8333 No. of results 15 9 3 24 10 8 14 15 9 13 3 14 9 14 14 18 15 15 11 11 False positive - - - - 1 - 1 - - 1 - - 1 - - - 1 False negative - - - - 1 - - - - 1 - 1 2 1 1 - - - 1 -Low outliers 1 - - 1 - - - 1 - -High outliers - 1 - - - 3 3 - - - - z-sc ore Lab no 8380 8397 8428 8435 8529 8568 8626 8628 8657 8734 8742 8756 8766 8891 8918 8955 9002 9034 9217 9245 No. of results 17 10 17 11 15 12 13 15 4 11 14 8 17 - 12 19 14 13 - 5 False positive - 2 - - - 3 - - 1 1 - 1 - - - 2 - 1 - -False negative 1 - 1 1 - - - - 1 - 1 - 1 - - - 1 1 - 1 Low outliers - 1 - - - 1 - 1 - 1 - - - 1 - - - -High outliers - - - 4 - - - --4 -2 0 2 4 -4 -2 0 2 4
z-sc ore Lab no 9420 9429 9436 9441 9451 9453 9465 9512 9555 9569 9589 9662 9716 9747 9753 9783 9890 9903 9923 9950 No. of results 8 15 17 14 15 10 9 - 8 17 12 12 6 6 8 3 6 11 8 3 False positive - - - 1 - - 1 - - - 1 - - - - -False negative 1 - 1 1 - 1 - - - 1 - - - 1 1 -Low outliers - 1 - - - 1 - 1 - - - -High outliers - - 1 - - - --4 -2 0 2 4
Test material and quality control
Test material
Each laboratory received three freeze-dried microbial mixtures designated A-C. The manufactured test material was freeze-dried in portions of 0.5 ml in vials, as described by Peterz and Steneryd (4). Before analysing the samples, the contents of each vial had to be dissolved in 254 ml of diluent. The organisms present in the mixtures are listed in Table 2.
Table 2. Microorganisms present in mixture A-C supplied to participants
Mixture 1 Microorganism Strain no.
A Staphylococcus saprophyticus SLV-013 Hafnia alvei SLV-015 Listeria seeligeri SLV-347 Listeria ivanovii SLV-348 Salmonella Enteritidis SLV-436 Vibrio cholera SLV-530 B Micrococcus sp. SLV-055 Aeromonas caviae SLV-206 Campylobacter lari SLV-559 Listeria monocytogenes SLV-361 Vibrio parahaemolyticus SLV-529 C Micrococcus sp. SLV-055 Yersinia enterocolitica SLV-408 Campylobacter jejuni SLV-540 Salmonella Dublin SLV-242
Escherichia coli O157 SLV-479
1
Quality control of the mixtures
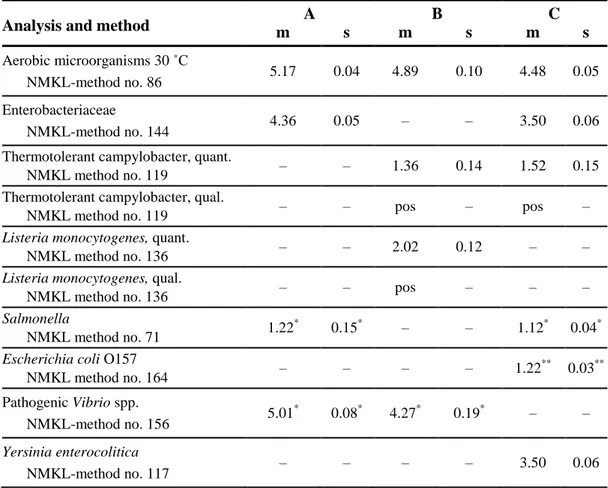
It is essential to have aliquots of homogeneous mixture and equal volume in all vials in order to allow comparison of all freeze-dried samples from one mixture. Quality control was performed in conjunction with manufacturing of the mixtures according to Scheme Protocol (3). The results are presented in Table 3. Homogeneity requires that the standard deviation and the difference between the highest and lowest value of results from 10 samples analysed do not exceed 0.15 log10 units and 0.5 log10 units,
respectively.
Table 3. Concentration mean (m) and standard deviation (s) from analyses of 10
randomly selected vials per mixture, expressed in log10 cfu (colony forming units) per
ml of sample.
Analysis and method m A s m B s m C s
Aerobic microorganisms 30 ˚C
NMKL-method no. 86 5.17 0.04 4.89 0.10 4.48 0.05
Enterobacteriaceae
NMKL-method no. 144 4.36 0.05 – – 3.50 0.06
Thermotolerant campylobacter, quant.
NMKL method no. 119 – – 1.36 0.14 1.52 0.15
Thermotolerant campylobacter, qual.
NMKL method no. 119 – – pos – pos –
Listeria monocytogenes, quant.
NMKL method no. 136 – – 2.02 0.12 – – Listeria monocytogenes, qual.
NMKL method no. 136 – – pos – – –
Salmonella
NMKL method no. 71 1.22 *
0.15* – – 1.12* 0.04*
Escherichia coli O157 NMKL method no. 164 – – – – 1.22 ** 0.03** Pathogenic Vibrio spp. NMKL-method no. 156 5.01 * 0.08* 4.27* 0.19* – – Yersinia enterocolitica NMKL-method no. 117 – – – – 3.50 0.06 – No target organism
* Internal values based on the analyses results of parallel mixtures
References
1. Kelly, K. 1990. Outlier detection in collaborative studies. J. Assoc. Off. Anal. Chem. 73:58-64.
2. Peterz, Mats et al. 1989. The effect of incubation temperature and magnesium chloride concentration on growth of salmonella in home-made and in
commercially available dehydrated Rappaport-Vassiliadis broths. J. of Applied Bacteriology. 523-528.
3. Anonymous, 2012. Protocol. Microbiology. Drinking Water & Food. The National Food Agency.
4. Peterz. M. Steneryd. A.C. 1993. Freeze-dried mixed cultures as reference samples in quantitative and qualitative microbiological examinations of food. J. Appl. Bacteriol. 74:143-148.
Lab no.
Lab no. A B C A B C A B C A B C A B C A B C A B C A B C A B C A B C A B C
1081 1 3 2 5.28 4.46 4.58 4.59 <1 4 - - - Neg Pos Neg Pos Neg Pos Neg Neg Pos - - - 1081
1254 1 2 3 4.76 4.38 4.38 4.27 <2 3.2 - - - <1 2 <1 Neg Pos Pos Neg Pos Neg Pos Neg Pos - - - 1254
1594 1 3 2 5.3 4.76 4.65 4.78 <2 3.26 - - - Pos Neg Pos Neg Neg Pos - - - 1594
1970 1 3 2 5.21 4.8 4.54 4.79 <2 <2 <1 1.85 1 <1 2.03 <1 Neg Pos Pos Neg Pos Neg Pos Neg Pos Neg Neg Pos - - - 1970
2035 2 3 1 - - - 4.6 <2 <2 <0.5 1.1 1.2 - - - Neg Pos Pos Neg Pos Neg - - - Neg Neg Pos 2035 2050 2 3 1 5.03 4.75 4.51 4.55 <2 3.34 - - - Pos Neg Pos - - - 2050
2058 2 1 3 - 4.3 4.45 - - - 1.95 0 - - - - Pos Neg - Pos Neg - - - 2058
2072 2 1 3 5.15 4.71 4.49 4.54 <1 3.11 <1 0.3 0.84 <1 2.25 <1 Neg Pos Pos Neg Pos Neg Pos Neg Pos - - - 2072
2151 2 1 3 - - - Neg Pos Pos - - - Pos Neg Pos - - - 2151
2324 1 2 3 - - - Pos Pos Neg Pos Neg Pos Neg Neg Pos - - - 2324
2386 1 3 2 5.35 4.48 4.48 - - - Neg Pos Neg Pos Neg Pos - - - 2386
2402 3 2 1 5.51 4.64 4.53 4.54 <1 1.26 - - - Pos Neg Pos - - - 2402
2458 2 1 3 5.34 4.56 4.28 4.3 0 3.04 0 0 0.85 0 2.11 0 Neg Pos Pos Neg Pos Neg Pos Neg Pos Neg Neg Pos Pos Pos Neg Neg Neg Pos 2458 2553 3 1 2 4.61 4.74 4.38 4.5 <2 3.3 - - - 0 2.08 0 Neg Pos Pos Neg Pos Neg Pos Neg Pos Neg Neg Pos Pos Pos Neg Neg Neg Pos 2553 2637 3 2 1 5.04 4.48 4.49 4.68 <1 <1 - - - <1 2.11 <1 - - - Neg Pos Neg Pos Neg Pos - - - 2637
2670 3 2 1 4.82 4.4 <2.40 - - - Pos Neg Neg - - - Pos Neg Neg - - - 2670
2704 1 2 3 5.05 4.81 4.49 4.63 <2 <2 - - - <1 2 <1 - - - Neg Pos Neg Pos Neg Pos - - - 2704
2720 1 3 2 4.87 4.69 4.47 4.64 3.38 3.39 - - - 2720
2745 3 1 2 4.67 4.4 4.36 4.26 <2 3.45 - - - <0 1.83 <0 - - - Neg Pos Neg Pos Neg Pos - - - 2745
2764 3 1 2 4.72 4.61 4.58 4.41 2.04 1 - - - Neg Pos Neg Pos Neg Pos Neg Neg Pos - - - 2764
2842 1 2 3 5.04 4.79 4.26 - - - <1 <1 <1 <1 2.04 <1 Neg Neg Neg Neg Pos Pos Pos Neg Pos Neg Neg Neg Pos Pos Pos - - - 2842
2920 3 2 1 5.04 4.77 4.49 4.6 0 0 - - - Pos Neg Pos - - - 2920
3126 2 1 3 5.37 3.82 3.24 - - - Neg Pos Neg Pos Pos Pos - - - Pos Neg Neg - - - 3126
3159 3 2 1 4.95 4.79 4.61 4.4 <1 <1 - - - <1 2.06 <1 - - - Neg Pos Neg - - - 3159
3305 1 3 2 4.96 4.52 4.54 4.66 <2 <2 - - - - 1.88 - Neg Pos Pos Neg Pos Neg Pos Neg Pos - - - 3305
3346 3 2 1 4.7 4.25 4.31 4.59 1.78 3.36 - - - <1 1.96 <1 Neg Pos Pos Neg Pos Neg Pos Neg Pos Neg Neg Pos - - - Neg Neg Pos 3346 3457 3 1 2 5.02 4.69 4.45 4.46 0 0 - - - 0 1.85 0 - - - Neg Pos Neg Pos Neg Pos - - - Pos Pos Neg - - - 3457
3511 1 3 2 - - - 4.59 3.76 <1 - - - 2.54 1.96 <1 - - - Pos Pos Neg Pos Neg Pos - - - 3511
3533 1 3 2 5.18 4.4 4.6 - - - Pos Neg Pos - - - Pos Neg Neg - - - 3533
3588 2 3 1 4.99 4.69 4.44 4.64 <2 2 - - - <1 1.7 <1 - - - Neg Pos Neg Pos Neg Pos - - - 3588
3626 3 2 1 4.9 4.8 4.4 4.5 <2 2.3 <1 1 1 <1 2 <1 Neg Pos Pos Neg Pos Neg Pos Neg Pos - - - 3626
3803 1 2 3 4.85 4.83 4.43 - - - <0 <0 0.9 <0 2.08 <0 Neg Pos Pos Neg Pos Neg Pos Neg Pos - - - 3803
3825 3 1 2 5.09 4.41 4.42 - - - Pos Neg Pos - - - 3825
3829 1 3 2 - - - 0 1.18 1.37 - - - Neg Pos Pos - - - 3829
3868 2 3 1 4.68 4.7 4.41 4.41 <2 3.15 0 0 1.04 0 2.08 0 Neg Neg Pos Neg Pos Neg Pos Neg Pos - - - 3868
3923 1 3 2 4.78 4.41 4.48 4.34 0 2.11 - - - Pos Neg Pos - - - Pos Pos Neg - - - 3923
3925 3 2 1 5.27 4.64 4.57 - - - Pos Neg Pos - - - 3925
4064 1 3 2 4.72 4.41 4.4 4.56 <1 3.34 - - - 4064
4100 3 1 2 4.7 4.66 4.36 4.41 <2 3.32 <1 1.26 1.54 <1 1.99 <1 Neg Pos Pos Neg Pos Neg Pos Neg Pos - - - 4100
4153 2 1 3 4.98 4.59 4.52 4.71 <2 <2 - - - <1 2.09 <1 Neg Pos Pos Neg Pos Neg Pos Neg Pos Neg Neg Pos - - - 4153
4171 3 1 2 4.75 4.78 4.64 4.63 4.08 <1 - - - Pos Neg Pos Neg Neg Pos - - - 4171
4246 3 2 1 4.77 4.41 4.22 4.35 4.22 <2 - - - Neg Pos Neg Pos Neg Pos - - - 4246
Thermotolerant campylobacter vial Aerobic microorganisms
30 °C Enterobacteriaceae
Thermotolerant
campylobacter Listeria monocytogenes Listeria monocytogenes Salmonella
Escherichia coli O157
(VT-neg) Pathogenic Vibrio spp Yersinia enterocolitica
Annex 1 Results from the participating laboratories - January 2013 All results are expressed in log10 cfu per ml sample.
Results reported as "<value" were regarded as zero (negative). Results reported as " > value" were exluded of the calculations. A dash in the table indicates that the analysis was not performed.
Lab no. Lab no. A B C A B C A B C A B C A B C A B C A B C A B C A B C A B C A B C Thermotolerant campylobacter vial Aerobic microorganisms
30 °C Enterobacteriaceae
Thermotolerant
campylobacter Listeria monocytogenes Listeria monocytogenes Salmonella
Escherichia coli O157
(VT-neg) Pathogenic Vibrio spp Yersinia enterocolitica
4586 2 1 3 - - - Pos Neg Pos - - - 4586
4633 2 1 3 4.71 4.57 4.45 4.52 <1 3.34 - - - Pos Neg Pos - - - 4633
4635 2 3 1 4.95 5.32 5.3 4.73 <2 <2 - - - Neg Pos Neg Pos Neg Pos - - - 4635
4664 1 2 3 5.1 4.8 4.12 4.63 <2 2 - - - <1 2.2 <1 - - - Neg Pos Neg Pos Neg Pos - - - Neg Pos Neg - - - 4664
4683 3 1 2 4.8 4.2 4.2 3.9 <1 3.5 - - - Neg Pos Neg Pos Neg Pos - - - Neg Neg Neg - - - 4683
4713 1 3 2 5.14 4.49 4.53 4.79 <1 3.32 - - - <1 2.08 <1 - - - Neg Pos Neg Pos Neg Pos - - - 4713
4817 3 2 1 4.8 4.6 4.3 - - - <1 2 <1 Neg Neg Pos Neg Pos Neg Pos Neg Pos Neg Neg Pos Pos Pos Neg Neg Neg Pos 4817 4840 1 3 2 5.49 4.45 4.53 4.82 <1 3.15 - - - <1 0.7 <1 Neg Neg Pos Neg Pos Neg Pos Neg Pos - - - 4840
4889 3 1 2 5.08 4.99 4.53 4.46 <1 1 - - - <1 1.85 <1 - - - Neg Pos Neg Pos Neg Neg - - - 4889
4955 1 3 2 5.18 4.82 4.58 4.79 <2 <2 - - - <0 2.1 <0 - - - Neg Pos Neg Pos Neg Pos - - - 4955
4980 3 2 1 5.06 4.83 4.28 4.65 <2 <2 - - - <1 2 <1 - - - Neg Pos Neg Pos Neg Pos - - - 4980
5018 1 2 3 4.91 4.95 4.56 4.47 <1 3.38 - - - <1 2.02 <1 Neg Pos Pos Neg Pos Neg Pos Neg Pos Neg Neg Pos - - - Neg Neg Pos 5018 5028 1 2 3 - - - Neg Neg Pos 5028 5100 2 3 1 2.75 2.45 2.46 - - - Pos Neg Pos - - - 5100
5188 2 1 3 - - - 0.6 0.3 0.3 - - - 5188
5197 3 1 2 5.4 4.7 4.5 4.6 3.4 3.4 - - - Pos Neg Pos - - - 5197
5200 2 3 1 5.34 4.51 4.54 - - - <3 1.66 <3 - - - Neg Pos Neg Pos Neg Pos - - - 5200
5204 2 1 3 5 4.9 4.3 4.6 4.3 3.2 <1 <1 1 <1 1.9 <1 Neg Pos Pos Neg Pos Neg Pos Neg Pos Neg Neg Pos - - - 5204
5220 3 1 2 5.21 4.5 4.51 4.68 0 3.19 - - - Neg Pos Neg Pos Neg Pos - - - 5220
5304 3 1 2 5.15 5.23 4.3 - - - Neg Pos Pos Pos Neg Pos - - - 5304
5329 1 2 3 4.94 4.69 4.47 4.36 <1 <1 - - - 5329
5333 3 2 1 - - - Neg Pos Neg Pos Neg Pos - - - 5333
5350 3 2 1 5.42 4.94 4.21 4.75 4.58 <2 - - - <1 2.08 <1 - - - Neg Pos Neg - - - 5350
5352 1 2 3 5.08 4.7 4.6 5.73 <2 <2 - - - Pos Neg Neg - - - 5352
5447 3 2 1 - - - Neg Pos Neg - - - 5447
5533 3 1 2 - - - Neg Pos Neg Pos Neg Pos - - - 5533
5545 2 1 3 - - - Pos Pos Neg Pos Neg Pos - - - 5545
5553 3 2 1 4.79 4.41 4.46 4.41 <1 - - - - <1 1.74 <1 Neg Neg Pos Neg Pos Neg Pos Neg Pos Neg Neg Pos - - - 5553
5615 3 1 2 5.28 5.18 4.08 4.54 <2 3 - - - Neg Pos Neg Pos Neg Pos - - - 5615
5632 3 2 1 - - - <1 2.4 <1 - - - Neg Pos Neg Pos Neg - - - 5632
5701 2 1 3 - - - Pos Neg Pos - - - 5701
5774 3 2 1 - - - 4.58 <2 <2 <0 0.3 0.5 <1 2 <0 Neg Pos Pos Neg Pos Neg - - - Neg Neg Pos - - - 5774
5801 1 3 2 4.6 4.46 4.43 4.25 2.6 3.2 - - - 5801
5850 3 2 1 - - - 0 0 1 - - - 5850
5883 3 2 1 4.88 4.62 4.4 4.57 <2 3.22 - - - 0 1.95 0 - - - Neg Pos Neg Pos Neg Pos - - - 5883
5893 3 2 1 5.63 4.4 4.72 - - - Pos Pos Neg Pos Neg Pos - - - Pos Neg Neg - - - 5893
5993 3 1 2 - - - Pos Neg Pos - - - 5993
6109 1 3 2 4.95 4.88 4.67 - - - Pos Neg Pos Neg Neg Pos - - - 6109
6138 3 1 2 5.02 4.76 4.6 4.68 <2 3 - - - <1 1.7 <1 - - - Neg Pos Neg Pos Neg Pos - - - 6138
6175 2 1 3 - - - Pos Neg Pos - - - 6175
6224 3 2 1 5.4 4.9 4.6 4.9 3.8 <1 - - - 6224
6232 2 1 3 4.64 4.65 4.51 4.45 2.9 <1 - - - Pos Neg Pos - - - 6232
6253 2 3 1 4.72 4.34 4.5 4.52 <1 3.28 - - - Neg Pos Neg Pos Neg Pos - - - 6253
6343 2 3 1 5.06 4.61 4.48 - - - Neg Pos Neg Pos Neg Pos - - - 6343
6352 1 3 2 4.85 4.35 4.45 4.55 <2 <2 - - - Pos Pos Pos - - - 6352
6368 3 2 1 5.04 4.79 4.32 4.6 <2 3.18 - - - <0 1.94 <0 - - - Neg Pos Neg Pos Neg Pos - - - Pos Pos Neg - - - 6368
6380 2 3 1 5.03 4.59 4.36 - - - 3.03 2.09 0 - - - Pos Pos Neg Pos Neg Pos - - - 6380
6443 2 3 1 4.58 4.59 4.6 4.4 <2 3.51 - - - Pos Neg Pos - - - 6443
6456 3 1 2 5.01 4.62 4.48 4.4 3.11 <1 - - - Neg Pos Neg Pos Neg Pos - - - 6456
6527 2 1 3 - - - Neg Pos Pos - - - Pos Neg Pos - - - 6527
6594 3 2 1 4.78 4.94 4.54 4.43 2 2.6 - - - Pos Neg Pos Neg Neg Pos - - - 6594
6658 2 3 1 4.76 4.26 4.43 4.35 <1 3.04 - - - 6658
Lab no. Lab no. A B C A B C A B C A B C A B C A B C A B C A B C A B C A B C A B C Thermotolerant campylobacter vial Aerobic microorganisms
30 °C Enterobacteriaceae
Thermotolerant
campylobacter Listeria monocytogenes Listeria monocytogenes Salmonella
Escherichia coli O157
(VT-neg) Pathogenic Vibrio spp Yersinia enterocolitica
7024 3 2 1 4.71 4.57 4.5 4.55 3.51 0 - - - 7024
7096 3 2 1 5.22 5.03 4.45 - - - <1 1.78 <1 - - - Pos Pos Neg Pos Neg Pos - - - 7096
7182 2 3 1 5.23 5.14 4.5 4.62 3.15 <1 - - - 7182
7191 3 2 1 1.99 1.98 2.04 - - - Pos Neg Neg - - - Pos Neg Neg - - - 7191
7207 2 1 3 5.39 5.33 4.8 4.42 <1 <1 - - - 7207
7232 2 3 1 5.01 4.64 4.61 - - - Pos Neg Pos - - - 7232
7242 2 1 3 4.69 4.23 4.52 4.44 0 2.88 - - - Pos Pos Neg - - - 7242
7248 2 3 1 4.66 4.76 4.21 4.48 <2 <2 0 0 0.3 0 2.01 0 Neg Neg Pos Neg Pos Neg Pos Neg Pos - - - 7248
7253 2 1 3 - - - <1 2.06 <1 Neg Pos Pos Neg Pos Neg Pos Neg Pos - - - 7253
7282 1 2 3 5.66 5.57 4.45 4.29 - 3.17 - - - Pos Pos Neg Pos Neg Pos - - - 7282
7302 2 31 - - - Neg Pos Pos - - - Pos Neg Pos - - - 7302
7330 3 1 2 5.62 5.3 4.47 4.73 4.13 3.12 - - - Pos Neg Pos - - - 7330
7334 3 1 2 4.93 4.42 4.32 - - - Pos Neg Pos Neg Neg Pos - - - 7334
7449 3 1 2 4.78 4.47 4.44 4.35 <2 3.1 - - - 7449
7543 3 1 2 5.36 4.07 4.1 - - - Neg Pos Neg Pos Neg Pos Neg Neg Pos - - - 7543
7564 3 2 1 4.83 5.18 4.38 4.46 <2 <2 0 0 0.6 2.99 2.08 0 Neg Pos Pos Pos Pos Neg Pos Neg Pos Neg Neg Pos Pos Pos Neg Neg Neg Pos 7564 7596 1 2 3 5.2 4.2 3.8 4.8 <2 3 - - - 0 2 0 - - - Neg Pos Neg Pos Neg Pos - - - 7596
7627 3 1 2 4.6 4.6 4.95 - - - Pos Neg Pos Neg Neg Pos - - - 7627
7631 3 2 1 4.66 4.59 4.37 - - - 7631
7688 1 3 2 4.87 4.51 4.43 4.67 <1 2.48 - - - <1 2.12 <1 Neg Pos Pos Neg Pos Neg Pos Neg Pos Neg Neg Pos - - - Neg Neg Pos 7688 7728 2 3 1 5.28 4.67 4.59 - - - Pos Neg Pos Neg Pos Neg Pos Neg Pos - - - 7728
7793 3 2 1 5.99 5.86 5.02 4.67 - 3.29 - - - Pos Neg Pos - - - 7793
7825 1 3 2 5.99 6.6 6.26 4.5 3.87 3.47 - - - <1 2.06 <1 - - - Neg Pos Neg Pos Neg Pos - - - 7825
7876 2 1 3 4.9 4.5 4.6 4.6 <1 3.4 - - - <1 2.1 <1 - - - Neg Pos Neg Pos Neg Pos - - - 7876
7882 3 2 1 4.87 4.54 4.49 - - - Neg Pos Neg Pos Neg Pos - - - 7882
7930 1 2 3 5.11 4.7 4.56 4.61 3 <1 - - - <1 1.9 <1 - - - Neg Pos Neg Pos Neg Pos - - - 7930
7940 3 2 1 4.82 4.99 4.32 - - - 7940
7962 2 3 1 4.94 4.56 4.38 4.74 <2 <2 - - - <1 2 <1 - - - Neg Pos Neg Pos Neg Pos - - - 7962
8066 2 3 1 - - - 4.35 2.18 <2 - - - <1 1.86 <1 - - - Neg Pos Neg Pos Neg Neg - - - 8066
8068 2 1 3 5 4.72 4.65 4.71 <2 <2 - - - 0 2.1 0 - - - Neg Pos Neg Pos Neg Pos - - - 8068
8165 2 3 1 - - - <1 <1 0.7 - - - Neg Pos Pos Neg Pos Neg Pos Neg Pos Neg Neg Pos - - - 8165
8247 2 3 1 4.94 4.46 4.48 4.65 <1 3.45 - - - <0 1.96 <0 - - - Neg Pos Neg Pos Neg Pos Neg Neg Pos - - - 8247
8255 2 1 3 4.89 4.77 4.49 4.71 <2 3.2 - - - <1 2.08 0 - - - Neg Pos Neg Pos Neg Pos - - - 8255
8260 3 1 2 4.68 4.49 4.4 4.46 <1 3.34 - - - <1 1.08 <1 - - - Neg Pos Neg Pos Neg Pos - - - 8260
8313 2 3 1 4.66 4.51 4.34 4.31 <2 <2 - - - Neg Pos Neg Pos Neg Pos - - - 8313
8333 2 1 3 4.88 4.54 4.6 4.66 3 3.21 - - - Pos Neg Pos Neg Neg Pos - - - 8333
8380 3 1 2 4.8 4.35 4.54 4.57 <2 <2 - - - <1 2 <1 Neg Pos Pos Neg Pos Neg Pos Neg Pos - - - 8380
8397 3 2 1 5.1 5 4.3 4.7 <1 2.4 - - - 3 1.9 <1 - - - Pos Pos Neg - - - 8397
8428 1 3 2 4.64 4.61 4.51 4.4 <4.18 <4.18 - - - <1 2.08 <1 - - - Neg Pos Neg Pos Neg Pos Neg Neg Pos - - - 8428
8435 1 2 3 4.81 4.74 4.48 <2 <2 3.3 - - - Neg Pos Neg Pos Neg Pos - - - 8435
8529 3 1 2 5.15 4.74 4.31 4.66 <2 3.16 - - - <0 2.08 <0 - - - Neg Pos Neg Pos Neg Pos - - - 8529
8568 2 3 1 5.08 4.95 4 4.51 4 3.3 - - - Pos Pos Neg Pos Neg Pos Pos Neg Pos - - - 8568
8626 1 2 3 4.76 4.88 4.38 4.41 <1 3.2 - - - - 2.01 - - - - Neg Pos Neg Pos Neg Pos - - - 8626
8628 3 2 1 4.6 4.8 4.38 4.37 <2 2.6 - - - 0 2.04 0 - - - Neg Pos Neg Pos Neg Pos - - - 8628
8657 2 3 1 5.32 4.61 4.5 4.69 3.14 <1 - - - 8657
8734 3 1 2 5.1 5.1 4.4 4.6 1.4 1.1 - - - 0 2.3 0 - - - Neg Pos Neg - - - 8734
8742 1 3 2 4.7 4.34 4.18 4.44 <1 <1 - - - <1 1.93 <1 - - - Neg Pos Neg Pos Neg Pos - - - 8742
8756 3 1 2 6.04 6.08 5.51 5.32 2.94 1.99 - - - Pos Neg Pos - - - 8756
8766 1 2 3 5.1 4.9 4.6 4.6 <1.3 <1.3 - - - <1 1.7 <1 - - - Neg Pos Neg Pos Neg Pos - - - Neg Neg Pos 8766 8891 2 3 1 - - - 8891
Lab no. Lab no. A B C A B C A B C A B C A B C A B C A B C A B C A B C A B C A B C Thermotolerant campylobacter vial Aerobic microorganisms
30 °C Enterobacteriaceae
Thermotolerant
campylobacter Listeria monocytogenes Listeria monocytogenes Salmonella
Escherichia coli O157
(VT-neg) Pathogenic Vibrio spp Yersinia enterocolitica
9420 1 2 3 4.92 4.77 4.46 4.66 <2 <2 - - - Pos Neg Pos - - - 9420
9429 1 2 3 4.92 4.63 4.54 4.61 <1 1 - - - <1 2.08 <1 - - - Neg Pos Neg Pos Neg Pos - - - 9429
9436 1 2 3 4.62 4.34 4.48 4.28 <1 <1 - - - <1 2.61 <1 - - - Neg Pos Neg Pos Neg Pos Neg Neg Pos - - - 9436
9441 2 1 3 4.86 4.57 4.52 4.71 <2 <2 - - - <1 2.04 <1 - - - Neg Pos Neg Pos Neg Pos - - - 9441
9451 2 3 1 5.15 4.93 4.52 4.69 <1 3.36 - - - <1 2.11 <1 - - - Neg Pos Neg Pos Neg Pos - - - 9451
9453 3 2 1 4.5 4.36 4.62 4.59 3.01 3.42 - - - Neg Pos Neg Pos Neg Neg - - - 9453
9465 3 2 1 4.76 4.36 4.36 4.48 <1 3.28 - - - Pos Neg Pos - - - 9465
9512 1 3 2 - - - 9512
9555 2 1 3 4.85 4.87 4.42 4.36 2.74 3.16 - - - Pos Neg Pos - - - 9555
9569 3 1 2 5 4.7 4.63 4.7 <1 <1 - - - <1 2.01 <1 Neg Pos Pos Neg Pos Neg Pos Neg Pos - - - 9569
9589 3 2 1 - - - <1 1.6 <1 Neg Pos Pos Neg Pos Neg Pos Neg Pos - - - 9589
9662 2 3 1 4.8 4.73 4.41 4.69 <1 1.04 - - - Neg Pos Neg Pos Neg Pos - - - 9662
9716 1 3 2 4.82 4.56 4.57 - - - Pos Neg Pos - - - 9716
9747 1 3 2 4.63 4.49 4.4 4.34 <1 2 - - - 9747
9753 2 3 1 5.2 4.93 4.6 4.83 4.28 3.21 - - - Pos Neg Pos - - - 9753
9783 3 1 2 4.92 4.88 4.41 - - - 9783
9890 2 3 1 5.17 4.82 4.56 4.65 0 3.31 - - - 9890
9903 1 3 2 4.99 4.41 4.48 4.38 0 0 - - - Neg Pos Neg Pos Neg Pos - - - 9903
9923 2 3 1 4.65 4.52 4.2 4.13 <2 <2 - - - Neg Pos Neg - - - 9923
9950 2 3 1 5.33 4.4 4.66 - - - 9950
n 150 151 151 123 121 121 19 19 19 73 76 74 39 39 39 108 109 109 141 142 141 33 33 33 18 18 18 15 15 15 n
Min 1.99 1.98 0 0 0 0 0 0 0 0 0.70 0 - - - Min
Max 6.08 6.60 6.26 5.73 4.58 4.00 0.60 1.85 1.54 3.03 2.94 0 - - - Max
median 4.95 4.65 4.47 4.59 0 3.28 0 1.14 1.00 0 2.01 0 - - - median
m 4.98 4.67 4.46 4.55 0 3.26 0 1.03 0.92 0 2.00 0 neg pos pos neg pos neg pos neg pos neg neg pos pos pos neg neg neg pos m
s 0.25 0.27 0.14 0.15 0 0.14 0 0.57 0.36 0 0.14 0 - - - s F+ 0 0 0 0 34 0 1 0 0 4 0 0 1 0 0 11 0 2 0 3 0 1 1 0 0 0 1 0 0 0 F+ F- 0 0 1 1 0 48 0 9 1 0 0 0 0 7 2 0 0 0 0 0 7 0 0 1 2 6 0 0 0 0 F-< 2 2 4 1 0 19 0 0 0 0 2 0 - - - < > 4 3 6 3 0 1 0 0 0 0 2 0 - - - > < OK 4.50 3.82 4.00 4.13 0 2.88 0 0.30 0.30 0 1.60 0 - - - < OK >OK 5.66 5.57 4.80 4.90 0 3.51 0 1.85 1.55 0 2.40 0 - - - >OK
n = number of analyses performed F+ = false positive Min = lowest reported result F- = false negative Max= highest reported result < = low outlier median = median value > = high outlier
m = mean value < OK = lowest accepted value s = standard deviation > OK = highest accepted value
Lab no. Lab no. A B C A B C A B C A B C A B C A B C A B C A B C A B C A B C A B C 1081 1 3 2 1.236 -0.773 0.910 0.283 0 4.000 0 0 0 0 0 0 0 0 0 1081 1254 1 2 3 -0.876 -1.082 -0.562 -1.857 0 -0.384 0 -0.007 0 0 0 0 0 0 0 0 0 0 1254 1594 1 3 2 1.321 0.350 1.425 1.543 0 0.033 0 0 0 0 0 0 1594 1970 1 3 2 0.955 0.500 0.616 1.610 0 0 1.454 0.216 0 0.202 0 0 0 0 0 0 0 0 0 0 0 0 0 1970 2035 2 3 1 0.343 0 0 0.126 0.780 0 0 0 0 0 0 0 0 0 2035 2050 2 3 1 0.223 0.312 0.395 0.010 0 0.590 0 0 0 2050 2058 2 1 3 -1.384 -0.046 -0.356 0 0 0 2058 2072 2 1 3 0.711 0.161 0.248 -0.057 0 -1.011 0 -1.290 -0.236 0 1.739 0 0 0 0 0 0 0 0 0 0 2072 2151 2 1 3 0 0 0 0 0 0 2151 2324 1 2 3 0 0 0 0 0 0 0 0 2324 2386 1 3 2 1.524 -0.706 0.174 0 0 0 0 0 0 2386 2402 3 2 1 2.175 -0.103 0.542 -0.057 0 -4.000 0 0 0 2402 2458 2 1 3 1.484 -0.404 -1.297 -1.657 0 -1.498 0 -0.208 0 0.761 0 0 0 0 0 0 0 0 0 0 0 0 0 0 0 0 0 0 0 2458 2553 3 1 2 -1.486 0.274 -0.562 -0.324 0 0.311 0 0.552 0 0 0 0 0 0 0 0 0 0 0 0 0 0 0 0 0 0 0 2553 2637 3 2 1 0.263 -0.706 0.248 0.876 0 0 0.761 0 0 0 0 0 0 0 2637 2670 3 2 1 -0.632 -1.007 0 0 0 0 2670 2704 1 2 3 0.304 0.538 0.248 0.543 0 0 -0.007 0 0 0 0 0 0 0 2704 2720 1 3 2 -0.428 0.086 0.101 0.610 0.938 2720 2745 3 1 2 -1.242 -1.007 -0.709 -1.924 0 1.355 0 -1.195 0 0 0 0 0 0 0 2745 2764 3 1 2 -1.039 -0.216 0.910 -0.924 -4.000 0 0 0 0 0 0 0 0 0 2764 2842 1 2 3 0.263 0.463 -1.445 0 0 0.272 0 0 0 0 0 0 0 0 0 0 0 2842 2920 3 2 1 0.263 0.387 0.248 0.343 0 0 0 0 2920 3126 2 1 3 1.606 -3.193 -4.000 0 0 0 0 0 0 0 3126 3159 3 2 1 -0.103 0.463 1.131 -0.991 0 0 0.412 0 0 0 0 3159 3305 1 3 2 -0.062 -0.555 0.616 0.743 0 -0.845 0 0 0 0 0 0 0 0 0 3305 3346 3 2 1 -1.120 -1.572 -1.077 0.276 0.729 0 -0.287 0 0 0 0 0 0 0 0 0 0 0 0 0 0 0 0 3346 3457 3 1 2 0.182 0.086 -0.046 -0.591 0 0 -1.055 0 0 0 0 0 0 0 0 0 0 3457 3511 1 3 2 0.276 -0.287 0 0 0 0 0 0 3511 3533 1 3 2 0.833 -1.007 1.057 0 0 0 0 0 3533 3588 2 3 1 0.060 0.086 -0.120 0.610 0 -4.000 0 -2.103 0 0 0 0 0 0 0 3588 3626 3 2 1 -0.306 0.500 -0.414 -0.324 0 -4.000 0 -0.051 0.216 0 -0.007 0 0 0 0 0 0 0 0 0 0 3626 3803 1 2 3 -0.510 0.614 -0.194 0 -0.067 0 0.552 0 0 0 0 0 0 0 0 0 0 3803 3825 3 1 2 0.467 -0.969 -0.267 0 0 0 3825 3829 1 3 2 0 0.268 1.259 0 0 0 3829 3868 2 3 1 -1.201 0.124 -0.341 -0.924 0 -0.732 0 0.328 0 0.552 0 0 0 0 0 0 0 0 0 3868 3923 1 3 2 -0.794 -0.969 0.174 -1.391 0 -4.000 0 0 0 0 0 0 3923 3925 3 2 1 1.199 -0.103 0.837 0 0 0 3925 4064 1 3 2 -1.039 -0.969 -0.414 0.076 0 0.590 4064 4100 3 1 2 -1.124 -0.017 -0.696 -0.891 0 0.466 0 0.401 1.750 0 -0.100 0 0 0 0 0 0 0 0 0 0 4100 4153 2 1 3 0.019 -0.291 0.469 1.076 0 0 0.621 0 0 0 0 0 0 0 0 0 0 0 0 0 4153 4171 3 1 2 -0.916 0.425 1.352 0.543 0 0 0 0 0 0 4171 Thermotolerant campylobacter sampleAerobic microorganisms
30 °C Enterobacteriaceae Thermotolerant campylobacter Listeria monocytogenes Listeria monocytogenes Salmonella Escherichia coli O157 (VT-neg) Pathogenic Vibrio spp Yersinia enterocolitica
Annex 2. z-scores of all participants - January 2013 z-scores were calculated according the formula : z = (x-m)/s.
x = result of the individual laboratory, m = mean of the results of all participating laboratories , s = standard deviation of the results of all participating laboratories . Correct negative results in quantitative analyses and correct results in qualitative analyses obtained a z-score of zero.
False results did not generate a z-score. 2 < |z| ≤ 3, |z|>3
Lab no. Lab no. A B C A B C A B C A B C A B C A B C A B C A B C A B C A B C A B C Thermotolerant campylobacter sampleAerobic microorganisms
30 °C Enterobacteriaceae Thermotolerant campylobacter Listeria monocytogenes Listeria monocytogenes Salmonella Escherichia coli O157 (VT-neg) Pathogenic Vibrio spp Yersinia enterocolitica 4353 2 1 3 0.548 0.915 1.131 0 0 0 4353 4400 3 1 2 4400 4562 2 1 3 -0.632 -0.329 -0.709 0.543 0 -4.000 0 1.189 1.569 0 1.949 0 0 0 0 0 0 0 0 0 0 0 0 0 0 0 0 0 0 0 4562 4586 2 1 3 0 0 0 4586 4633 2 1 3 -1.079 -0.366 -0.046 -0.191 0 0.590 0 0 0 4633 4635 2 3 1 -0.103 2.460 4.000 1.210 0 0 0 0 0 0 0 4635 4664 1 2 3 0.507 0.500 -2.475 0.543 0 -4.000 0 1.390 0 0 0 0 0 0 0 0 0 4664 4683 3 1 2 -0.713 -1.761 -1.886 -4.000 0 1.703 0 0 0 0 0 0 0 4683 4713 1 3 2 0.670 -0.668 0.542 1.610 0 0.451 0 0.552 0 0 0 0 0 0 0 4713 4817 3 2 1 -0.713 -0.253 -1.150 0 -0.007 0 0 0 0 0 0 0 0 0 0 0 0 0 0 0 0 0 0 4817 4840 1 3 2 2.094 -0.819 0.542 1.810 0 -0.732 0 -4.000 0 0 0 0 0 0 0 0 0 4840 4889 3 1 2 0.426 1.216 0.542 -0.591 0 -4.000 0 -1.055 0 0 0 0 0 0 4889 4955 1 3 2 0.833 0.576 0.910 1.610 0 0 0.691 0 0 0 0 0 0 0 4955 4980 3 2 1 0.345 0.614 -1.297 0.676 0 0 -0.007 0 0 0 0 0 0 0 4980 5018 1 2 3 -0.266 1.066 0.763 -0.524 0 0.868 0 0.133 0 0 0 0 0 0 0 0 0 0 0 0 0 0 0 0 5018 5028 1 2 3 0 0 0 5028 5100 2 3 1 -4.000 -4.000 -4.000 0 0 0 5100 5188 2 1 3 -1.288 -1.756 5188 5197 3 1 2 1.728 0.124 0.322 0.343 1.007 0 0 0 5197 5200 2 3 1 1.484 -0.592 0.616 0 -2.382 0 0 0 0 0 0 0 5200 5204 2 1 3 0.101 0.877 -1.150 0.343 -0.384 0 0.216 0 -0.706 0 0 0 0 0 0 0 0 0 0 0 0 0 5204 5220 3 1 2 0.955 -0.630 0.395 0.876 0 -0.454 0 0 0 0 0 0 5220 5304 3 1 2 0.711 2.121 -1.150 0 0 0 0 0 5304 5329 1 2 3 -0.144 0.086 0.101 -1.257 0 5329 5333 3 2 1 0 0 0 0 0 0 5333 5350 3 2 1 1.809 1.028 -1.812 1.343 0 0.552 0 0 0 0 5350 5352 1 2 3 0.426 0.124 1.057 4.000 0 0 0 5352 5447 3 2 1 0 0 5447 5533 3 1 2 0 0 0 0 0 0 5533 5545 2 1 3 0 0 0 0 0 5545 5553 3 2 1 -0.754 -0.969 0.027 -0.924 0 0 -1.823 0 0 0 0 0 0 0 0 0 0 0 0 5553 5615 3 1 2 1.240 1.933 -2.769 -0.057 0 -1.776 0 0 0 0 0 0 5615 5632 3 2 1 0 2.787 0 0 0 0 0 0 5632 5701 2 1 3 0 0 0 5701 5774 3 2 1 0.210 0 0 -1.290 -1.195 0 -0.007 0 0 0 0 0 0 0 0 0 0 5774 5801 1 3 2 -1.527 -0.781 -0.194 -1.991 -0.384 5801 5850 3 2 1 0 0.216 5850 5883 3 2 1 -0.388 -0.178 -0.414 0.143 0 -0.245 0 -0.356 0 0 0 0 0 0 0 5883 5893 3 2 1 2.676 -1.015 1.911 0 0 0 0 0 0 0 5893 5993 3 1 2 0 0 0 5993 6109 1 3 2 -0.103 0.802 1.572 0 0 0 0 0 0 6109 6138 3 1 2 0.182 0.350 1.057 0.876 0 -1.776 0 -2.103 0 0 0 0 0 0 0 6138 6175 2 1 3 0 0 0 6175 6224 3 2 1 1.728 0.877 1.057 2.343 6224 6232 2 1 3 -1.352 -0.054 0.358 -0.677 0 0 0 6232 6253 2 3 1 -1.039 -1.233 0.322 -0.191 0 0.172 0 0 0 0 0 0 6253 6343 2 3 1 0.345 -0.216 0.174 0 0 0 0 0 0 6343 6352 1 3 2 -0.510 -1.195 -0.046 0.010 0 0 0 6352 6368 3 2 1 0.263 0.463 -1.003 0.343 0 -0.524 0 -0.426 0 0 0 0 0 0 0 0 0 0 6368 6380 2 3 1 0.223 -0.291 -0.709 0.621 0 0 0 0 0 0 6380 6443 2 3 1 -1.608 -0.291 1.057 -0.991 0 1.772 0 0 0 6443 6456 3 1 2 0.141 -0.178 0.174 -0.991 0 0 0 0 0 0 6456 6527 2 1 3 0 0 0 0 0 0 6527
Lab no. Lab no. A B C A B C A B C A B C A B C A B C A B C A B C A B C A B C A B C Thermotolerant campylobacter sampleAerobic microorganisms
30 °C Enterobacteriaceae Thermotolerant campylobacter Listeria monocytogenes Listeria monocytogenes Salmonella Escherichia coli O157 (VT-neg) Pathogenic Vibrio spp Yersinia enterocolitica 6658 2 3 1 -0.876 -1.535 -0.194 -1.324 0 -1.498 6658 6707 3 2 1 0.833 0.877 2.382 0.343 0 0 -0.706 0 0 0 0 0 0 0 6707 6762 1 3 2 -0.021 -0.103 -2.033 0.810 1.355 6762 6860 2 3 1 -0.591 -0.065 -0.267 0.410 1.216 0 0.481 0.216 0 0.831 0 0 0 0 0 0 0 0 0 0 0 0 0 0 0 0 0 0 0 6860 6971 2 1 3 1.118 1.782 0.027 0.343 6971 7024 3 2 1 -1.079 -0.366 0.322 0.010 7024 7096 3 2 1 0.996 1.367 -0.046 0 -1.544 0 0 0 0 0 0 7096 7182 2 3 1 1.036 1.782 0.322 0.476 7182 7191 3 2 1 -4.000 -4.000 -4.000 0 0 0 0 7191 7207 2 1 3 1.687 2.498 2.529 -0.857 0 7207 7232 2 3 1 0.141 -0.103 1.131 0 0 0 7232 7242 2 1 3 -1.161 -1.648 0.461 -0.731 0 -2.646 0 0 7242 7248 2 3 1 -1.283 0.350 -1.812 -0.457 0 0 -1.759 0 0.063 0 0 0 0 0 0 0 0 0 7248 7253 2 1 3 0 0.412 0 0 0 0 0 0 0 0 0 0 7253 7282 1 2 3 2.786 3.402 -0.046 -1.724 -0.593 0 0 0 0 0 7282 7302 2 3 1 0 0 0 0 0 0 7302 7330 3 1 2 2.623 2.385 0.101 1.210 -0.941 0 0 0 7330 7334 3 1 2 -0.184 -0.920 -0.988 0 0 0 0 0 0 7334 7449 3 1 2 -0.794 -0.743 -0.120 -1.324 0 -1.080 7449 7543 3 1 2 1.565 -2.251 -2.622 0 0 0 0 0 0 0 0 0 7543 7564 3 2 1 -0.591 1.933 -0.562 -0.591 0 0 -0.913 0.552 0 0 0 0 0 0 0 0 0 0 0 0 0 0 0 0 0 0 7564 7596 1 2 3 0.914 -1.761 -4.000 1.676 0 -1.776 0 -0.007 0 0 0 0 0 0 0 7596 7627 3 1 2 -1.527 -0.253 3.633 0 0 0 0 0 0 7627 7631 3 2 1 -1.283 -0.291 -0.635 7631 7688 1 3 2 -0.428 -0.592 -0.194 0.810 0 -4.000 0 0.831 0 0 0 0 0 0 0 0 0 0 0 0 0 0 0 0 7688 7728 2 3 1 1.240 0.011 0.984 0 0 0 0 0 0 0 7728 7793 3 2 1 4.000 4.000 4.000 0.810 0.242 0 0 0 7793 7825 1 3 2 4.000 4.000 4.000 -0.331 1.494 0 0.391 0 0 0 0 0 0 0 7825 7876 2 1 3 -0.306 -0.630 1.057 0.343 0 1.007 0 0.691 0 0 0 0 0 0 0 7876 7882 3 2 1 -0.428 -0.479 0.248 0 0 0 0 0 0 7882 7930 1 2 3 0.548 0.124 0.763 0.410 0 -0.706 0 0 0 0 0 0 0 7930 7940 3 2 1 -0.632 1.216 -1.003 7940 7962 2 3 1 -0.144 -0.404 -0.562 1.276 0 0 -0.007 0 0 0 0 0 0 0 7962 8066 2 3 1 -1.324 0 -0.985 0 0 0 0 0 0 8066 8068 2 1 3 0.101 0.199 1.425 1.076 0 0 0.691 0 0 0 0 0 0 0 8068 8165 2 3 1 0 -0.631 0 0 0 0 0 0 0 0 0 0 0 0 8165 8247 2 3 1 -0.144 -0.781 0.174 0.676 0 1.355 0 -0.287 0 0 0 0 0 0 0 0 0 0 8247 8255 2 1 3 -0.347 0.387 0.248 1.076 0 -0.384 0 0.552 0 0 0 0 0 0 0 8255 8260 3 1 2 -1.201 -0.668 -0.414 -0.591 0 0.590 0 -4.000 0 0 0 0 0 0 0 8260 8313 2 3 1 -1.283 -0.592 -0.856 -1.591 0 0 0 0 0 0 0 8313 8333 2 1 3 -0.388 -0.479 1.057 0.743 -0.315 0 0 0 0 0 0 8333 8380 3 1 2 -0.713 -1.195 0.616 0.143 0 0 -0.007 0 0 0 0 0 0 0 0 0 0 8380 8397 3 2 1 0.507 1.254 -1.150 1.010 0 -4.000 -0.706 0 0 0 8397 8428 1 3 2 -1.364 -0.216 0.395 -0.991 0 0 0.552 0 0 0 0 0 0 0 0 0 0 8428 8435 1 2 3 -0.660 0.274 0.152 0 0.318 0 0 0 0 0 0 8435 8529 3 1 2 0.711 0.274 -1.077 0.743 0 -0.663 0 0.552 0 0 0 0 0 0 0 8529 8568 2 3 1 0.426 1.066 -3.358 -0.257 0.311 0 0 0 0 0 0 0 8568 8626 1 2 3 -0.876 0.802 -0.562 -0.924 0 -0.384 0.063 0 0 0 0 0 0 8626 8628 3 2 1 -1.527 0.500 -0.562 -1.191 0 -4.000 0 0.272 0 0 0 0 0 0 0 8628 8657 2 3 1 1.402 -0.216 0.322 0.943 8657
Lab no. Lab no. A B C A B C A B C A B C A B C A B C A B C A B C A B C A B C A B C Thermotolerant campylobacter sampleAerobic microorganisms
30 °C Enterobacteriaceae Thermotolerant campylobacter Listeria monocytogenes Listeria monocytogenes Salmonella Escherichia coli O157 (VT-neg) Pathogenic Vibrio spp Yersinia enterocolitica 8891 2 3 1 8891 8918 1 2 3 0.467 0.877 0.027 0 -0.217 0 0 0 0 0 0 0 8918 8955 1 3 2 -0.306 0.614 -0.709 -0.257 -4.000 0 0 0 0 0 0 0 0 0 0 0 0 0 0 8955 9002 1 2 3 -0.103 -0.743 0.984 0.410 0 0 -0.007 0 0 0 0 0 0 0 9002 9034 3 1 2 -0.794 0.387 -0.414 -0.857 0 0 0 0 0 0 0 0 0 9034 9217 3 1 2 9217 9245 1 3 2 -0.225 -0.781 1.057 -0.191 0 9245 9420 1 2 3 -0.225 0.387 0.027 0.743 0 0 0 0 9420 9429 1 2 3 -0.225 -0.140 0.616 0.410 0 -4.000 0 0.552 0 0 0 0 0 0 0 9429 9436 1 2 3 -1.445 -1.233 0.174 -1.791 0 0 4.000 0 0 0 0 0 0 0 0 0 0 9436 9441 2 1 3 -0.469 -0.366 0.469 1.076 0 0 0.272 0 0 0 0 0 0 0 9441 9451 2 3 1 0.711 0.990 0.469 0.943 0 0.729 0 0.761 0 0 0 0 0 0 0 9451 9453 3 2 1 -1.933 -1.158 1.205 0.276 1.146 0 0 0 0 0 9453 9465 3 2 1 -0.876 -1.158 -0.709 -0.457 0 0.172 0 0 0 9465 9512 1 3 2 9512 9555 2 1 3 -0.510 0.764 -0.267 -1.257 -0.663 0 0 0 9555 9569 3 1 2 0.101 0.124 1.278 1.010 0 0 0.063 0 0 0 0 0 0 0 0 0 0 9569 9589 3 2 1 0 -2.801 0 0 0 0 0 0 0 0 0 0 9589 9662 2 3 1 -0.713 0.237 -0.341 0.943 0 -4.000 0 0 0 0 0 0 9662 9716 1 3 2 -0.632 -0.404 0.837 0 0 0 9716 9747 1 3 2 -1.405 -0.668 -0.414 -1.391 0 -4.000 9747 9753 2 3 1 0.914 0.990 1.057 1.876 -0.315 0 0 0 9753 9783 3 1 2 -0.217 0.813 -0.319 9783 9890 2 3 1 0.792 0.576 0.763 0.676 0 0.381 9890 9903 1 3 2 0.060 -0.969 0.174 -1.124 0 0 0 0 0 0 0 9903 9923 2 3 1 -1.323 -0.555 -1.886 -2.791 0 0 0 0 9923 9950 2 3 1 1.443 -1.007 1.499 9950