ABSTRACT
Title: Valuation and the differences between strategic and financial buyers
Author: Christopher Ekdahl
Supervisor: Ingela Elofsson, Department of Production Management, Lund Institute of Technology
Problem definition: For any acquisition to take place the assets to be sold must be valued. Some argue that an asset is worth whatever an acquirer is willing to pay for it at any given time. We believe that there is an underlying value (intrinsic value) that depends on the expected future cash flows of the asset and the risk associated with these cash flows. There exist several methods for estimating this value.
Traditionally when a company was up for sale the most likely acquirer would be a “strategic buyer”, that is a competitor in the same industry or someone with good knowledge and a large amount of experience from the industry. In the 80’s a new breed of buyers called “financial buyers” developed rapidly in the US. Their motivation for acquiring companies was purely financial and these buyers came to revolutionize the mergers and acquisition industry. Today, up to 50% of transactions made include a financial buyer as one of the parties. In 2006 over $250bn of new capital was raised to these firms.
While working in the mergers and acquisitions department of Calyon I observed that financial buyers and strategic buyers often derived very different valuations of the same company.
Purpose: The purpose of this thesis is to describe the common acquisition
valuation techniques used by financial and strategic buyers, and the potential for value creation for each of them.
Methodology: The study has been conducted in descriptive way with mostly
secondary and qualitative data.
Summery & Reflections: This thesis begins with a background discussion and definition of strategic and financial buyers. A section on valuation follows. Discounted cash flow analysis, relative valuation and leveraged buyout analysis are the valuation methods described. Next, the most common ways of creating value in an acquisition are described. The operating and financial synergies experienced by strategic buyers are described as well as the most common value creation levers used by financial buyers. The thesis is concluded by a summary and some reflections by the author.
Key words: Strategic Buyer, Financial Buyer, Buyout Fund, Private Equity,
PREFACE
Having worked for 9 months in the mergers and acquisition industry I got the opportunity to take a break and finish my studies before continuing in this field. I wanted to use this break to to further investigate certain aspects of the mergers and acquisition process and to gain a broader theoretical base from which to develop on my next job. My work on this thesis has been very interesting and it has helped me to reach those goals. I would like to thank every one who has assisted me in my work and especially my supervisor Ingela Elofsson. Ingela has given me clear directions and her critique has been objective and well defined, which has been a great help to me in my work.
Helsingborg, March 2007
TABLE OF CONTENTS
ABSTRACT... I PREFACE... II TABLE OF CONTENTS...III
1 INTRODUCTION ... 1
1.1 BACKGROUND AND PROBLEM DEFINITION... 1
1.1.1 Purpose ... 3
1.1.2 Target Group and Delimitations ... 3
1.1.3 Disposition ... 3 2 METHODOLOGY ... 5 2.1 INTRODUCTION... 5 2.2 SCIENTIFIC APPROACHES... 5 2.2.1 Descriptive Studies... 5 2.2.2 Explanatory Studies... 5 2.2.3 Diagnostic Studies... 5 2.2.4 Our Study ... 6 2.3 DATA COLLECTION... 6 2.3.1 Qualitative Data... 6 2.3.2 Quantitative Data... 6 2.3.3 Primary Data ... 6 2.3.4 Secondary Data ... 6 2.3.5 My Approach... 6 2.4 RELIABILITY... 7
2.5 REFLECTIONS ON THE IMPACT OF THE AUTHOR... 7
3 PRESENTATION OF BUYER GROUPS... 9
3.1 STRATEGIC BUYERS... 9
3.2 FINANCIAL BUYERS... 9
3.2.1 The rise of Buyout Funds ... 10
3.2.2 Main Players ... 11
4 VALUATION METHODS ... 13
4.1 DISCOUNTED CASH FLOW ANALYSIS (DCF) ... 13
4.1.1 Net Present Value (NPV)... 13
4.1.2 Cost of Equity and the Capital Asset Pricing Model (CAPM) ... 14
4.1.3 Weighted Average Cost of Capital (WACC) ... 18
4.1.4 Free Cash Flow (FCF)... 19
4.1.5 Estimating Growth during the High Growth Period ... 20
4.1.6 The Stable Growth Period and Terminal Year Calculation ... 23
4.1.7 Example - A Walk Trough the DCF Analysis ... 25
4.2 RELATIVE VALUATION... 28
4.2.1 Identifying a Peer Group... 28
4.2.2 Data Standardization and Analysis of Multiples... 28
4.2.3 Example... 34
4.3 LEVERAGED BUYOUT ANALYSIS... 35
4.3.1 Debt Capacity... 35
4.3.2 Internal Rate of Return (IRR)... 36
4.3.3 Holding Period and Exit Multiple ... 37
4.3.4 Example... 37
5 VALUE CREATION FOR STRATEGIC BUYERS... 41
5.1 POTENTIAL SOURCES OF SYNERGY... 41
5.1.1 Operating Synergies... 41
5.1.2 Financial Synergies... 42
5.2 DOUBTFUL SOURCES OF SYNERGY... 42
5.2.1 Accretive Acquisitions ... 42
5.3 VALUING SYNERGY... 43
6 VALUE CREATION FOR FINANCIAL BUYERS... 44
6.1 AFRAMEWORK FOR VALUE CREATION IN LEVERAGED BUYOUTS... 44
6.2 FINANCIAL ARBITRAGE... 45
6.2.1 Financial Arbitrage based on Changes in Market Value... 45
6.2.2 Financial Arbitrage based on Private Information about the Portfolio Company ... 45
6.2.3 Financial Arbitrage through Superior Market Information ... 46
6.2.4 Financial Arbitrage through Superior Deal Making Capabilities ... 46
6.2.5 Financial Arbitrage through an Optimization of Corporate Scope ... 46
6.3 FINANCIAL ENGINEERING... 46
6.3.1 Optimization of Capital Structure ... 46
6.3.2 Reducing Corporate Tax ... 48
6.4 INCREASING OPERATIONAL EFFECTIVENESS... 48
6.4.1 Cost Cutting and Margin Improvements ... 48
6.4.2 Reducing Capital Requirements ... 48
6.4.3 Removing Managerial Inefficiencies... 48
6.5 INCREASING STRATEGIC DISTINCTIVENESS... 49
6.5.1 Corporate Refocusing ... 49
6.5.2 Buy and Build Strategy... 49
6.6 REDUCING AGENCY COST... 49
6.6.1 Reducing Agency Cost of Free Cash Flow... 50
6.6.2 Improving Incentive Alignment ... 50
6.6.3 Improving, Monitoring and Controlling... 50
6.7 PARENTING EFFECT... 50
6.7.1 Restoring Entrepreneurial Spirit... 50
6.7.2 Advising and Enabling ... 50
7 SUMMARY & REFLECTIONS ... 51
7.1 SUMMARY... 51
7.1.1 Valuation methods... 51
7.1.2 Value creation methods... 52
7.2 REFLECTIONS... 53
7.2.1 Valuation Differences... 53
7.2.2 Value Creation Differences ... 55
7.2.3 Final Reflections ... 56
1 Introduction
In the introduction the background and problem definition of the thesis are described. Thereafter the purpose of the paper will be presented to provide the reader a tangible depiction of the scope of the report. Furthermore, the introduction treats the target group and delimitations as well as the disposition of the thesis.
1.1 Background and Problem Definition
Capitalism has existed in some form at least since the invention of agriculture, but the modern capitalism that we see today is often said to have started 300 to 500 years ago when the institution of private property was fully installed in a number of countries1.
As long as we have had capitalism, businesses have changed hands. Consider, for example, the blacksmith being too old to run his business and therefore letting his son take over, or the barmaid having saved up for years before being able to buy the local pub. Today, many small companies are still traded in the same way, but the industrial revolution led to the creation of many large corporations, which increasingly used acquisitions as a growth strategy. These acquirers are often referred to as “strategic buyers”2 and the rationale behind their acquisitions is
of a strategic nature. Common motivations include gaining market share in their own market, gaining entrance into another market or gaining technological knowledge. Up until recently, when a sizeable company was up for sale, a strategic buyer from the same industry with superior size was the most likely potential acquirer. However, with the development of the credit markets a new breed of buyers was born.
In 1976, a firm called Kohlberg Kravis Roberts & co (KKR) was founded in New York. The three partners were non-operators with backgrounds in finance and their business concept was to acquire industry-leading companies and work with management to grow and improve them to create shareholder value. The firm was hugely successful and it came to initiate a revolution of the mergers and acquisitions industry. As opposed to strategic buyers this new breed came to be called “financial buyers”3, since their motives where purely financial. Today, up to 50%4 of
transactions made include a financial player as one of the parties and in 2005 over $250bn5 of
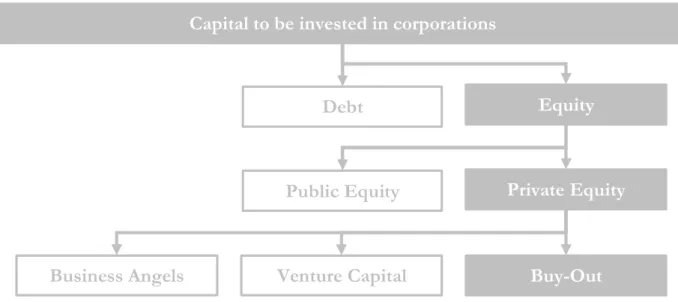
new capital was raised to these firms world wide. These firms go under a variety of names including private equity funds, financial sponsors and buyout funds. For the sake of clarity, distinctions have to be made. Figure 1.16 offers a schematic picture of how capital invested in
corporations is divided into different categories. The financial buyers that we consider in this thesis are buyout funds. As we see in figure 1.1, buyout funds are one specific category of private equity investors and can be defined in the following way.
There are a large variety of financial investors, investing in everything from real estate to expensive wines. We will be concentrating on financial investors who invest in corporations, which is the top category in figure 1.1. When investing in a company one can basically invest either in the debt of the company or in the equity of the company. The financial investors that we
1 Wikipedia.org
2 Transactions Advisory (Mercer Capital) 3 Transactions Advisory (Mercer Capital) 4 Claes Jonsson, Calyon
5 ft.com 6 svca.se
are to explore invest, primarily, in equity. Equity can either be private or quoted on a stock exchange, where it is publicly traded. Since buyout funds acquire integer companies their investments are not listed on any stock exchange and are hence private. The financial buyers that we will describe invests in mature companies in a late stage of their life cycle, as opposed to Business Angels or Venture Capitalists that provide start-up or growth capital to firms early on in the life cycle. Mature companies often have more stable cash flows and lower investment needs, which make a high degree of debt financing a compelling option. Our financial investors are often referred to as buyout funds because they stage highly leveraged takeovers of both public and private firms. They are also referred to as Private Equity funds because once a buyout is completed the equity they have invested in is by definition private. Finally, the buyout firms are sometimes referred to as financial sponsors because they provide financing for management buyouts (MBOs).
For any merger or acquisition to take place the assets involved in the transaction need to be valued. Valuation is often described as one of the three pillars of finance (the other two being risk management and optimization over time)7 and plays an essential role in all financial systems. We
often encounter valuation in our every day life. If, for example, an apartment is to be put up for sale or a new mortgage needs to be taken out on a house, a real estate agent is needed to value the assets. In the corporate world assets constantly need to be valued. If a firm considers building a new plant, the future profits of the plant need to be estimated and valued to see that they cover the investment. When an auditor revises a firm’s financial statements he must asses the values of inventory, goodwill and pension obligations among others. If a firm wants to borrow money from a bank, its assets and repayment capabilities have to be valued. There are also a variety of philosophical approaches to valuation. Some argue that an asset is worth what ever someone is willing to pay for it and therefore adhere to the bigger fool theory8 of investing, which states that
an asset should be bought at any price as long as there is a good likelihood that an even bigger fool will turn up and buy it more expensively later on.
In mergers and acquisitions the aim is on valuing the operating assets of a firm in order to derive the firm value or enterprise value of the firm. The value of the operating assets is derived from
7 ”Finance” – Bodie & Merton, p.6 8 ”Investment Valuation” – Damodaran, p.1
Capital to be invested in corporations
Equity
Debt
Public Equity Private Equity
Business Angels Venture Capital Buy-Out
the cash flows those assets are expected to generate in the future and the amount of risk involved in those cash flows9.
Three models, in particular, are used to value companies in transactions, discounted cash flow valuation, relative valuation and leveraged buyout valuation. All three models can be used by either group of investors to derive a reference value. However, the leveraged buyout analysis is especially used to derive a value for a financial buyer, whereas the other two are traditionally used by strategic buyers10. The discounted cash flow analysis is the most thorough model and strategic
buyers often use it in combination with relative valuation.
On several occasions it has been observed11 that strategic buyers and financial buyers derive very
different valuations of the same company. Harald Mix, founder of Altor, said in an interview that buyout transactions at a higher price compared to the stock exchange are common12.
1.1.1 Purpose
The purpose of this thesis is to describe the common acquisition valuation techniques used by financial and strategic buyers, and the potential for value creation for each of them.
1.1.2 Target Group and Delimitations
This paper is aimed at senior students with a good understanding of basic financial concepts. It is also aimed at professionals in the financial services sector.
The thesis will be restricted to description and analysis of [To be discussed and completed]
1.1.3 Disposition
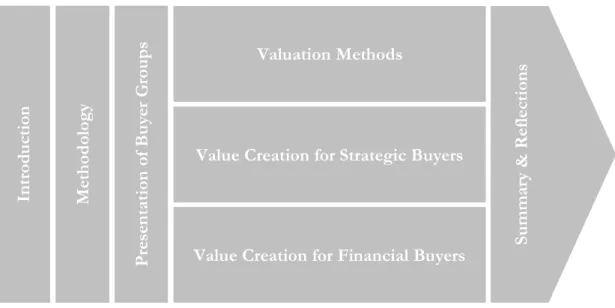
Figure 1.2 shows the layout of this thesis.
We commence with three chapters of introduction methodology and a presentation of the buyer group. The aim is to give the reader adequate background and vocabulary to move on to the
9 ”Investment Valuation” – Damodaran, p.1
10 Otto Hermansson, Danske Bank
11 Otto Hermansson, Danske Bank
12 Interview in “Veckans Affärer” 15March 2007
Figure 1.1 – Disposition of Thesis
Intr
od
uc
ti
on
Value Creation for Strategic Buyers
Me th od ology P res en ta ti on of B uyer Gro up s Su mmary & R efle ct ion s Valuation Methods
Value Creation for Financial Buyers
Intr
od
uc
ti
on
Value Creation for Strategic Buyers
Me th od ology P res en ta ti on of B uyer Gro up s Su mmary & R efle ct ion s Su mmary & R efle ct ion s Valuation Methods
theory section. The theory section is made up of three chapters and gives us information about the models used for valuation by our different buyer groups and the measures they take to create value. The thesis ends with analysis and conclusions.
Chapter 1 – Introduction
In the introduction the background and problem definition of the thesis are described. Thereafter the purpose of the paper will be presented to provide the reader a tangible depiction of the scope of the report. Furthermore, the introduction treats the target group and delimitations as well as the disposition of the thesis.
Chapter 2 – Methodology
In this chapter the methods used to fulfil the purpose of this thesis are described. Each section commences with general theory and concludes with the way those general theories are used in this thesis. Finally, the reliance of the thesis is discussed.
Chapter 3 – Presentation of Buyer Groups
In this chapter the two main types of acquirers, namely strategic buyers and financial buyers are described and discussed. The history of financial buyers and the main Nordic players as well as the main players world wide, are also described.
Chapter 4 – Valuation Methods
In this chapter the three most common valuation techniques used in practice by strategic and financial buyers will be described and discussed. The DCF analysis and relative valuations are traditionally used by strategic buyers, whereas the LBO model is special for financial buyers. The valuation methods aim to find the value of the firm’s operating assets or the enterprise value of a firm, but since the firm’s operating assets are financed by debt and equity, the equity value can easily be derived by subtracting the debt from the enterprise value.
Chapter 5 – Value Creation for Strategic Buyers
In this chapter the main ways in which strategic buyers create value through acquisitions will be described. Common operative and financial synergies will be discussed as well as a few doubtful sources of synergy. Finally an approach to valuing synergy is described. By finding ways to create value or improve the target financials, such as future margins or growth, variables can be altered in the valuation models.
Chapter 6 – Value Creation for Financial Buyers
In this chapter the main ways in which buyout firms create value will be described. A frame work developed by Berg (Mckinsey & Company) & Gottschalg (INSEAD) will be used to get an overview over the different value creating levers. Then each measure is discussed along with the variables in the valuation models it can improve.
Chapter 7 – Summary & Reflections
This chapter provides a summary of the main valuation and value creation techniques used by strategic and financial buyers. The author’s reflections on the differences between strategic and financial buyers, with respect to valuation and value creation, follow.
References
A complete list of references used in this thesis is presented.
2 Methodology
In this chapter the methods used to fulfil the purpose of this thesis are described. Each section commences with general theory and concludes with the way those general theories are used in this thesis. Finally, the reliance of the thesis is discussed.
2.1 Introduction
It is very important to be structured when conducting research. Being structured is facilitated by following a clear method while working towards the accomplishment of the purpose of the thesis. There are a wide variety of methods available and several of them could normally be used to reach one’s purpose. The choice of method depends on the purpose and the knowledge available. It is common to use a combination of methods in order to obtain the highest fulfillment of the purpose at the lowest expense13.
2.2 Scientific Approaches
The first step in a study is to identify the problem. Normally the author has an idea of what the problem is, but needs to clarify it further. Once the problem has been defined, the purpose of the study is to be determined. There are a variety of purposes in studies, but some of the more common include descriptive studies, explanatory studies and diagnostic studies.
2.2.1 Descriptive Studies
Descriptive studies include a vide variety of studies. They could describe the work environment at a plant, how the parliament works or marketing profile of a product. They could be conducted with both quantitative and qualitative research. The purpose of quantitative descriptions is usually to answer questions such as how many, how much, how often, etc. Measurement techniques are normally of great importance. A qualitative description is defined by its purpose, the target group and the data available. It is very important to choose the language in relation to the target group and to delimit the description to the areas that are important for this group. An example of a descriptive qualitative study would be to describe how a car works. This study would be very different if the target group was mechanics compared to if it was drivers14.
2.2.2 Explanatory Studies
Explanatory studies aims at answering the question “why”. The often contain statistical exercises where the purpose is to reject or accept an hypothesis. An example of such a hypothesis would be “Does smoking cause cancer?”. Explanatory studies can be both qualitative and quantitative.
2.2.3 Diagnostic Studies
The purpose of a diagnostic study is to find the cause of a phenomenon. The aim is often to find the solution to a problem and methods and actions to solve the problem should be presented. An example of a subject for a diagnostic study would be “why are our profits going down?”. Diagnostic studies are often both qualitative and quantitative15.
13 ”Utredningsmetodik för samhällsvetare och ekonomer” – Lundahl & Skärvad, p. 7-16 14 ”Utredningsmetodik för samhällsvetare och ekonomer” – Lundahl & Skärvad, p. 47, 199-204 15 ”Utredningsmetodik för samhällsvetare och ekonomer” – Lundahl & Skärvad, p. 48-49
2.2.4 Our Study
This thesis is a descriptive, qualitative study with a clearly defined purpose and target group. We describe how valuation is performed and how strategic and financial buyers create value through acquisitions. A descriptive approach was chosen because the purpose of the study was to describe these aspects. A quantitative approach would have been possible but given the difficulties associated with the collection of such data and the limited time at hand, it was decided that a qualitative study would better meet the purpose.
2.3 Data Collection
All research includes data collection. The quantity of data that is collected is often determined by the amount of time available for data collection. A larger amount of data collected generally gives a more reliable result, but the quality of the data collected is also very important16. Data can be
either qualitative or quantitative and either primary or secondary.
2.3.1 Qualitative Data
This method for data gathering aims at creating a deeper understanding in a specific area as well as capturing the broader picture. It is important that the researcher is attentive and critically examines the material17. The qualitative method demands more resources and is harder to
generalize compared to the quantitative18. Another important aspect is that the qualitative
information can always be translated into quantitative information, whereas the opposite is never possible. A qualitative inquiry does not yield a precise answer but rather an interpretation in which additional information can be weighed in. Finally, the qualitative have been criticized for being non-scientific and subjective19.
2.3.2 Quantitative Data
Quantitative data gathering is a method where all data that is gathered can be translated into numbers. A specific event is often studied and then explained or proven by numerical data20. An
example of such a study would be a survey where questions are answered on a scale between one and five.
2.3.3 Primary Data
Primary data is data that is collected directly from the source. It is very reliable and is, in most studies, constituted of interviews, surveys, observations and experiments21.
2.3.4 Secondary Data
Secondary data is derived from literature and existing statistics. Another researcher has already picked and interpreted the data. Therefore it is viewed as less reliable and more subjective compared to primary data22.
2.3.5 My Approach
This thesis is a qualitative study conducted with secondary data in particular. Most data has been gathered from literature, where an extensive review has been performed. In addition, discussions
16 ”Forskningsmetodikensgrunder” – Patel & Davidson, p.63-76 17 ”Forskningsmetodikensgrunder” – Patel & Davidson, p.24-31 18 ” Semenarieboken” – Björklund & Paulsson, p.63
19 ”Forskningsmetodikensgrunder” – Patel & Davidson, p.51-53 20 ”Forskningsmetodikensgrunder” – Patel & Davidson, p.12-14 21 ” Semenarieboken” – Björklund & Paulsson, p.66-75
with investment banking professionals and a Marco board member have given this thesis a certain amount of primary data.
2.4 Reliability
Not only is the quantity of data gathered significant, but also trustworthiness of the data. The reliability of the data is adequate only if it has been critically examined. The aim with reliable data is to make a study that can be conducted again with the same results. Subjectivity should be kept to a minimal and the margin of error eliminated23.
In this thesis reliability has been ensured by critical examination of a wide variety of sources. The work of several acclaimed authors in the field of valuation and value creation has been studied to build a stable theoretical foundation from which this thesis has developed. Professionals in the field have also been consulted for views on how these theories are used in practice.
2.5 Reflections on the Impact of the Author
In all literature the author is mirrored in some way. In the beginning of my work on this thesis I read a vide variety of books and articles on the subjects that I was to describe. Among this wealth of sources I picked the parts that I thought best portrayed what I wanted to tell. By doing this my background and my experience in the field was reflected upon this thesis.
During my first year at the MSc in engineering physics program in Lund I gained an interest in investment banking. I had friends working in banks in London and their stories were very exiting to me. During the summer after my first year, I started to take additional business courses out side my main education. In Lund and Kristianstad, I was able to complete business courses that equals almost one year of fulltime studies. After my second year in Lund I went to France on a two year exchange program. One of the reasons why I decided to go to France was that the French program included far more business courses compared to my engineering program in Sweden. During my two years in France I took additional business courses at HEC and lived in London for a summer studying at London School of Economics. During my second year in Paris I was offered a 9 month internship in the mergers and acquisitions department of Calyon (the investment banking arm of Crédit Agricole). During my time at Calyon I worked on several deals including both strategic and financial buyers. For comparison and valuation purposes I also studied a wide variety of deals that I was not directly involved in. One of my main tasks at Calyon was to perform valuations. When I left Calyon I felt that I had good practical knowledge of valuations. My studies had given me some theoretical background to valuation, but I felt that I wanted to strengthen my theoretical foundation in valuation techniques, in order to be able to develop further on my next job. In order to accomplish this in the best possible way I chose a descriptive approach. The models described in this thesis are the models I used at Calyon. These models are the main models used by buyers and financial institutions in practice24. During my
time at Calyon I had also developed an interest in buyout funds (financial buyers). I had seen the growth of this sector and the important role it had come to play in mergers and acquisition. It was also a controversial sector of which every one seemed to have an opinion. My classification of two different types of buyers, namely, strategic and financial buyers, was also based on my practical experience. This classification is recognized throughout the business and in academic literature25.
23 ” Semenarieboken” – Björklund & Paulsson, p.59-6
24 Otto Hermansson, Danske Bank
Although I came to this work with my own views on the differences between strategic and financial buyers I have done my outmost to stay objective throughout the thesis. The background, problem discussion and purpose of this thesis are built on my practical experience. I wanted to concretize the relationships I saw between the different buyer groups, valuation models and value creation levers.
3 Presentation of Buyer Groups
In this chapter the two main types of acquirers, namely strategic buyers and financial buyers are described and discussed. The history of financial buyers and the main Nordic players as well as the main players world wide, are also described.
3.1 Strategic Buyers
Strategic buyers are the traditional buyers, usually industry participants, which use acquisitions as a growth strategy. Their aim is to integrate the target into their own company and long-term goals26. They look for synergies and for ways to strengthen their market positions27. Most
industries go through a consolidation phase as they mature. The leading players in each industry enjoy economies of scale, economies of scope, pricing power and buying power. All of which help increase margins. Through mergers and acquisitions industry leaders develop and the market moves towards oligopoly (horizontal acquisitions). Many companies also use acquisitions to enter new markets, both geographically and product wise. Companies might also aim to incorporate a larger part of the value chain by acquiring suppliers or distributors (vertical acquisitions).
3.2 Financial Buyers
Financial buyers (buyout funds) are investors who invest in companies for purely financial reasons. Their aim is not to manage the target’s day to day business or to integrate it into their own entity, but to collect cash flows from it and make a profitable exit28. Although time limit on
their investment is fairly short term, the actions they provoke in their businesses may very well be long term.
With SEK 210bn29 under management and SEK 36bn30 in new investments in Sweden during
2005, the buyout funds constitute a force to be reckoned with. Financial buyers take public firms private or invest in equity not listed on a stock exchange. Such investments are normally quite sizeable, which rules out most private investors. Compared to investments in quoted stocks the holdings of buyout funds are very illiquid and they are also, as a rule, highly leveraged, which makes them high risk. To compensate for this risk financial buyers demand a high annual return on their investment (Internal Rate of Return (IRR)). A few years ago the return demanded was around 30% annually, but many financial buyers have lately been forced to accept expected returns of down to 20%31. This can, to a certain extent, be explained by a decrease in risk due to a
raise in liquidity and many companies being able to show stable cash flows during the last five years, but the main reason is that competition has hardened, driving up prices on prospective deals. We have also seen many secondary or even third time LBOs, but with strong performance by public equity markets many buyout funds are likely to exit via an IPO in lieu of another trade sale. Financial buyers normally have a time limit of 3-5 years32 on their investments. As with
26 Transactions Advisory (Mercer Capital)
27 Otto Hermansson, Danske Bank
28 Transactions Advisory (Mercer Capital) 29 svca.se
30 svca.se
31 Claes Jonsson, Calyon 32 svca.se
traditional funds, buyout funds take out a fee of around 1-2% of the invested capital annually. A performance based management fee (carried interest) is also normally charged in the order of 20% of the gains that precede an 8% annual return (hurdle rate)33.
3.2.1 The rise of Buyout Funds
The predecessors of private equity firms began to appear in the late 19th century. In its initial
decades it was a predominantly American industry, constituted of family offices that managed the funds of wealthy individuals. Gradually these families began to involve outsiders to select and oversee their investments. Shortly after World War II the first formal private equity fund was established. Professors from MIT and Harvard Business School together with business leaders from the Boston area formed American Research & Development (ARD) in 1946. The fund attracted capital primarily from individuals and invested in emerging companies based on technology developed for the war. Up until the late 1970s the private equity industry attracted only limited investments. The annual inflow of money could reach a few hundred million dollars at best but was usually lower. Although a few buyouts were completed at the time, the industry was primarily focused on providing venture capital to growth or start-up firms.
In the late 1970s the private equity industry changed dramatically. The interest of private equity funds to invest in mature firms had grown in the early 1970s when returns on venture capital investments were poor compared to the risk. In 1979 the Employee Retirement Income Security Act’s rule “prudent man” was changed, which made it possible for pension funds to invest in private equity funds. Investments in the private equity sector soared and as a result, numerous venture capital, buyout and mezzanine funds sprang up in the following years. The venture capital funds enjoyed great success while providing capital to create and grow firms such as Microsoft, Cisco Systems and Sun Microsystems. The buyout funds were also booming with highly public transactions such as the acquisitions of RJR Nabisco, Dr. Pepper and McCall Pattern. Between 1979 and 1989 over 2000 leveraged buyout transactions were completed with an aggregate value in excess of $250bn34.
Towards the end of the 1980s returns on venture capital investments declined due to overinvestment in certain sectors. Mainly due to increased competition for the transactions, the returns for buyout funds decreased as well. As a result, the capital that had been flooding the industry dried up and many weaker players disappeared. With less competition buyout funds flourished once again in the early 1990s and the pattern of the 1980s was repeated during this decade as well, though on a much larger scale. During the 1990s the European private equity industry awoke and made serious progress. Led by Germany, the market grew from €500m in 1984 to over €24bn in 200135.
In resent years the industry has been booming once again. It has spread geographically and now exists through out the world. Like the investment banks in the 1950s and 1960s the leading private equity players are now working hard to distinguish their brands from other investors36.
Several strategies are used in pursuing this task, including the raise of enormous funds to take on huge transactions that smaller competitors can hardly carry.
The bulk of the capital raised by buyout funds today comes from pension funds and the majority of financing to Swedish buyout funds comes from abroad37.
33 Otto Hermansson, Danske Bank & ”VA Granskar Riskkapitalet” – Veckans Affärer, 15March 2007 34 ”Value Creation in Leveraged Buyouts” – Loos, p.1
35 ”Value Creation in Leveraged Buyouts” – Loos, p.1
36 ”Venture Capital & Private Equity” – Lerner, Hardymon & Leamon, p.3 37 svca.se
3.2.2 Main Players
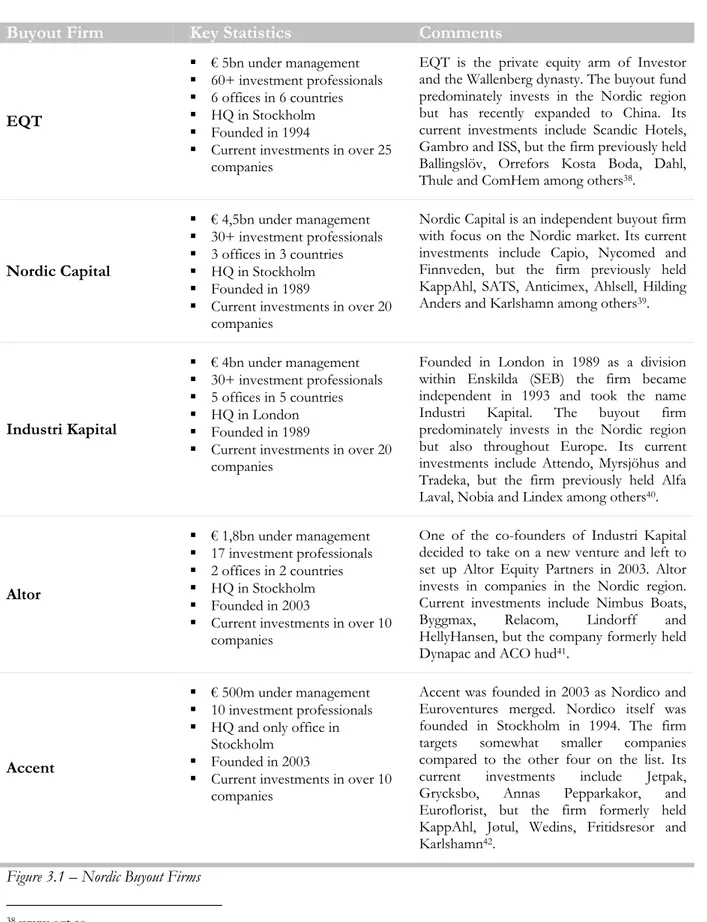
In figure 3.1 a short overview of some of the leading Nordic players is presented.
Buyout Firm Key Statistics Comments
EQT € 5bn under management 60+ investment professionals 6 offices in 6 countries HQ in Stockholm Founded in 1994
Current investments in over 25 companies
EQT is the private equity arm of Investor and the Wallenberg dynasty. The buyout fund predominately invests in the Nordic region but has recently expanded to China. Its current investments include Scandic Hotels, Gambro and ISS, but the firm previously held Ballingslöv, Orrefors Kosta Boda, Dahl,
Thule and ComHem among others38.
Nordic Capital € 4,5bn under management 30+ investment professionals 3 offices in 3 countries HQ in Stockholm Founded in 1989
Current investments in over 20 companies
Nordic Capital is an independent buyout firm with focus on the Nordic market. Its current investments include Capio, Nycomed and Finnveden, but the firm previously held KappAhl, SATS, Anticimex, Ahlsell, Hilding Anders and Karlshamn among others39.
Industri Kapital € 4bn under management 30+ investment professionals 5 offices in 5 countries HQ in London Founded in 1989
Current investments in over 20 companies
Founded in London in 1989 as a division within Enskilda (SEB) the firm became independent in 1993 and took the name Industri Kapital. The buyout firm predominately invests in the Nordic region but also throughout Europe. Its current investments include Attendo, Myrsjöhus and Tradeka, but the firm previously held Alfa Laval, Nobia and Lindex among others40.
Altor € 1,8bn under management 17 investment professionals 2 offices in 2 countries HQ in Stockholm Founded in 2003
Current investments in over 10 companies
One of the co-founders of Industri Kapital decided to take on a new venture and left to set up Altor Equity Partners in 2003. Altor invests in companies in the Nordic region. Current investments include Nimbus Boats, Byggmax, Relacom, Lindorff and HellyHansen, but the company formerly held
Dynapac and ACO hud41.
Accent
€ 500m under management 10 investment professionals HQ and only office in
Stockholm Founded in 2003
Current investments in over 10 companies
Accent was founded in 2003 as Nordico and Euroventures merged. Nordico itself was founded in Stockholm in 1994. The firm targets somewhat smaller companies compared to the other four on the list. Its current investments include Jetpak, Grycksbo, Annas Pepparkakor, and Euroflorist, but the firm formerly held KappAhl, Jøtul, Wedins, Fritidsresor and Karlshamn42.
Figure 3.1 – Nordic Buyout Firms
38 www.eqt.se 39 www.nordiccapital.com 40 www.industrikapital.com 41 www.altor.com 42 www.accentequity.se
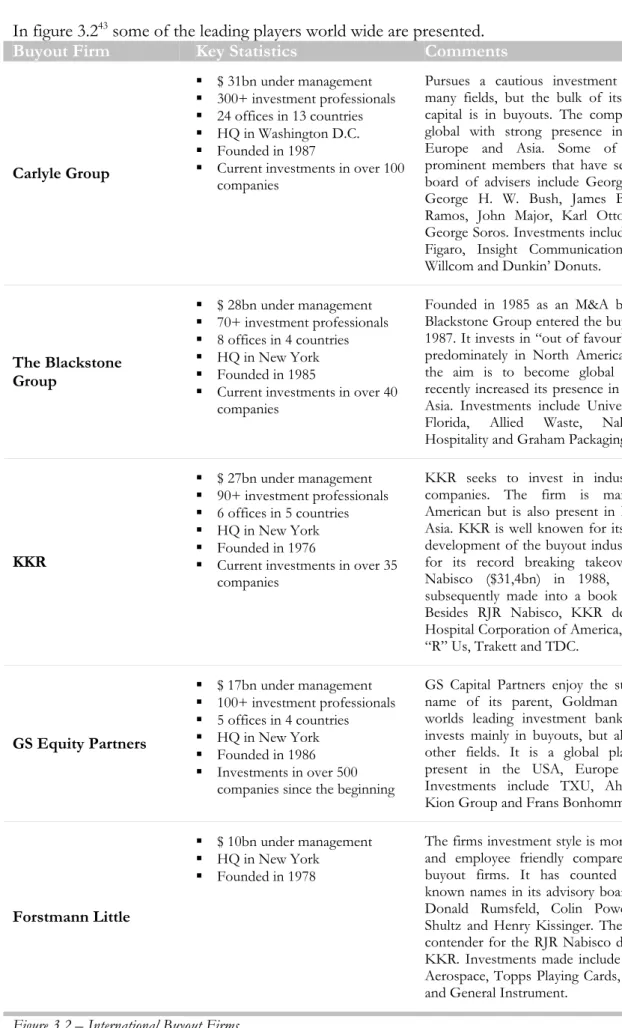
In figure 3.243 some of the leading players world wide are presented.
Buyout Firm Key Statistics Comments
Carlyle Group $ 31bn under management 300+ investment professionals 24 offices in 13 countries HQ in Washington D.C. Founded in 1987
Current investments in over 100 companies
Pursues a cautious investment strategy in many fields, but the bulk of its committed capital is in buyouts. The company is truly global with strong presence in the USA, Europe and Asia. Some of the more prominent members that have served on its board of advisers include George W. Bush, George H. W. Bush, James Baker, Fidel Ramos, John Major, Karl Otto Pöhl and George Soros. Investments include Hertz, Le Figaro, Insight Communications, Casema, Willcom and Dunkin’ Donuts.
The Blackstone Group $ 28bn under management 70+ investment professionals 8 offices in 4 countries HQ in New York Founded in 1985
Current investments in over 40 companies
Founded in 1985 as an M&A boutique the Blackstone Group entered the buyout field in 1987. It invests in “out of favour” industries, predominately in North America. However, the aim is to become global and it has recently increased its presence in Europe ind Asia. Investments include Universal Studios Florida, Allied Waste, Nalco Prime Hospitality and Graham Packaging.
KKR $ 27bn under management 90+ investment professionals 6 offices in 5 countries HQ in New York Founded in 1976
Current investments in over 35 companies
KKR seeks to invest in industry leading companies. The firm is mainly North American but is also present in Europe and Asia. KKR is well knowen for its role in the development of the buyout industry and also for its record breaking takeover of RJR Nabisco ($31,4bn) in 1988, which was subsequently made into a book and movie. Besides RJR Nabisco, KKR deals include Hospital Corporation of America, TXU, Toys “R” Us, Trakett and TDC.
GS Equity Partners $ 17bn under management 100+ investment professionals 5 offices in 4 countries HQ in New York Founded in 1986 Investments in over 500
companies since the beginning
GS Capital Partners enjoy the strong brand name of its parent, Goldman Sachs, the worlds leading investment bank. The firm invests mainly in buyouts, but also in many other fields. It is a global player mainly present in the USA, Europe and Asia. Investments include TXU, Ahlsell, IMG, Kion Group and Frans Bonhomme.
Forstmann Little
$ 10bn under management HQ in New York
Founded in 1978
The firms investment style is more long term and employee friendly compared to other buyout firms. It has counted some well known names in its advisory board including Donald Rumsfeld, Colin Powell, George Shultz and Henry Kissinger. The firm was a contender for the RJR Nabisco deal, won by KKR. Investments made include Gulfstream Aerospace, Topps Playing Cards, Dr Pepper, and General Instrument.
Figure 3.2 – International Buyout Firms
4 Valuation Methods
In this chapter the three most common valuation techniques used in practice by strategic and financial buyers will be described and discussed. The DCF analysis and relative valuations are traditionally used by strategic buyers, whereas the LBO model is special for financial buyers. The valuation methods aim to find the value of the firm’s operating assets or the enterprise value of a firm, but since the firm’s operating assets are financed by debt and equity, the equity value can easily be derived by subtracting the debt from the enterprise value.
4.1 Discounted Cash Flow Analysis (DCF)
The DCF analysis is the most thorough way to value a company44. Basically one estimates a
company’s future free cash flows (FCF) and then discounts them, using an appropriate discount rate, to get their net present value (NPV). To calculate the FCF:s one needs forecasts of a companies future financial statements. Those forecasts can either be derived from secondary sources such as research reports from investment banks, from company management forecast or by own estimates. A firm’s cost of capital is then used as discount rate. To describe the DCF calculation we will begin by introducing some underlying concepts.
(
)
∑
= = + = t n t t t r CF Value 1 1Where n is the life of the asset in years, CFt the cash flow in period t and r the discount rate
reflecting the risk associated with the cash flows.
4.1.1 Net Present Value (NPV)
This concept is derived from the Time Value of Money theory, which states that a certain amount of money received today is worth more than the same amount received in the future45.
The present value of money received in the future is calculated with the following formula:
(
)
n d r Value Future Value esent + = 1 _ _ PrWhere rd is the annual discount rate and n is the number of years. If we have a series of annual
cash flows, FCF1, FCF2,,,,,,FCFn, then the NPV of these cash flows is calculated as follows:
(
) (
)
(
)
(
)
∑
= ⎟⎟⎠ ⎞ ⎜⎜ ⎝ ⎛ + = + + + + + + = n i i d i n d n d d r FCF NPV or r FCF r FCF r FCF NPV 1 2 2 1 1 1 1 ... 1 144 ”Investment Valuation” – Damodaran, p.11
4.1.2 Cost of Equity and the Capital Asset Pricing Model (CAPM)
The CAPM is used to calculate the expected return on equity re for a specific company.
(
m f)
f
e r r r
r = +β −
Where rf is the risk free rate, rm the average market return and β = relative volatility to the market. Risk Free Rate
A common approach when estimating return in finance is to start off with a risk free rate and then add a risk premium46. The risk free rate corresponds to the time value of money and is
usually determined by an asset that is defined to be risk free. For an asset to be risk free its actual return must always be equal to its expected return and there can be no default risk. Government bonds of western stable economies are used in practice since they approximate these conditions very closely47. If, for example, we need the five year risk free rate we use that of a five year
government bond. The currency of the risk free rate should be consistent with the currency of the cash flows to be discounted. Thus if the cash flows are in U.S. $ a U.S. government bond should be used.
Market Risk Premium
The (rm-rf) factor in the second term denotes the annual excess market return over the risk free
rate. In other words, how much greater the return expected on an equity investment in the stock market is compared to a fixed income investment in a risk free government bond. Damodaran estimates this premium to be around 5% in Sweden48. This is inline with what is used in
practice49.
However, the risk premiums can vary several percents depending on the method used to calculate them. The dominating technique for estimating risk premiums is to compute the annual excess return on stocks over a time period and then take the arithmetic average of these returns. In order to minimize the standard deviation a long time period is usually used (100 years). Depending on the time period used the results can vary greatly. Using 100 years should provide a good estimation as long as the return investors expect has not changed over this period. If we believe that the expected excess returns demanded by investors change over time we could use the last 10 years as our time period. However, this would mean that our standard error would increase severely (might be of the same magnitude as the risk premium itself). The risk premium can also change severely depending on which risk free security we use. Long term government bonds (10 years) are recommended50.
An alternative approach is called “Implied Equity Premium”. Here, a simple version of the discounted dividend model is used51.
To illustrate, we take the omxs30 index of the Stockholm Stock Exchange. It is currently trading at 1200. The dividend yield is expected to be around 3% on the index, in 2007. If we assume that
46 ”Investment Valuation” – Damodaran, p.154 47 ”Corporate Financial Management” – Arnold, p.194
48 “Triumph of the Optimists” – Dimson, Marsh & Staunton, p.289 or damodaran.com
49 Otto Hermansson, Danske bank
50 ”Investment Valuation” – Damodaran, p.160-161
51 ”Investment Valuation” – Damodaran, p.171-174
the dividends will grow 6% annually in perpetuity, our expected return on an equity investment would be 9%. The risk free rate is currently around 3.8%, which would give us an implied equity premium of 5,2%.
Beta
Beta represents the firm specific risk of an investment and measures the relative volatility of the given instrument with respect to the market. A beta of less than 1 indicates that the instrument has historically been less volatile than the market and vice versa. There are three basic ways to find the beta of a company.
1. Historical betas. Can be found by using historical data on market prices on an investment
2. Fundamental betas. Can be found by using fundamental characteristics of the investment
3. Accounting betas. Can be found using accounting data of the investment
Historical Market Betas
The historical market beta for most publicly traded companies can be found in databases such as Blomberg or in the Monday issue of Dagens Industri, and it is the conventional approach for estimating the beta of a publicly traded firm52. The beta is calculated by taking the regression of
the returns on the investment against returns on a market index. For a good result weekly or monthly stock and index returns over at least the last couple of years, should be used. By choosing a longer time period more data is provided which statistically improves the result. However, the chance that the risk characteristics of the firm have changed over the period increases with a longer period, which makes the estimation less accurate. Likewise, using daily returns increases the points of entry but does also increase the chance of nontrading bias53.
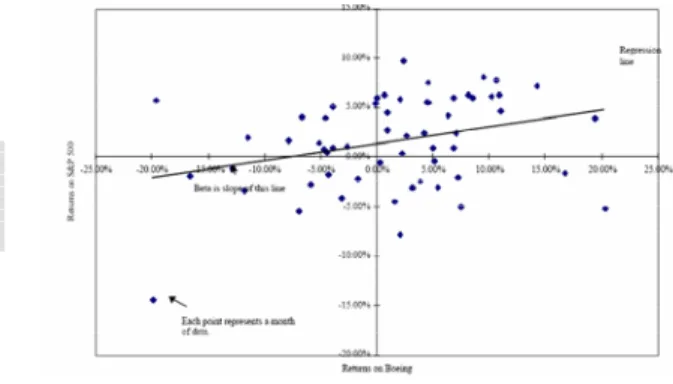
Nontrading bias occurs when a company’s stocks are not traded in a period. The volatility of the stock is thereby zero whereas the market may have fluctuated heavily. The index used should also be selected with caution. For example, the Stockholm Stock Exchange indexes were heavily dominated by Ericsson in the late 1990’s, which made any beta estimations using that index severely biased. Figure 4.1 plots the returns on Boeing and the S&P 50054 and the following
formulas are used for the regression.
1 1 _ − − + − = j j j j P Dividends P P return Stock 1 1 _ − − + − = j j j j Index Dividends Index Index return Market return Market b a return Stock _ = + ∗ _
Pj is the stock price at time j. “b” is the slope of the regression and hence our beta. “a” is the
intercept of the regression, which gives us a simple measure of the stock’s performance relative to the market during the period of the regression. R2 of the regression provides a proportion of
the risk of the investment that can be attributable to market risk. The standard error of the beta is
52 Claes Jonsson, Calyon
53 ”Valuation” – Koller, Goedhart & Wessels (McKinsey & Company) p.309 54 ”Investment Valuation” – Damodaran, p.185
also worth noting. A standard deviation of 0,25 is not uncommon. For a firm with an estimated beta of 1, such a standard deviation would imply that there is a 67% chance that the beta is actually between 0,75 and 1,25 and a 95% chance that it is between 0,5 and 1,5. This suggests that even though betas from regression are the most widely used, they should be considered with caution55.
Fundamental Betas
We have seen that betas can be estimated by regression, but we have also seen that this method has its flaws. It can not be used on private firms or divisions of a firm since the price information is not available, and it is vulnerable to the standard deviation. Another way of estimating a beta is to look at the fundamentals of the business. There are three basic determinants of the beta of a business56. They are described in figure 4.2.
Beta
Determinant Description
Type of Business
The type of business a firm is involved in obviously plays a vital role in the level of risk it is exposed to. Companies operating in a cyclical industry can be expected to have higher betas than non cyclical firms, whereas firms selling products viewed as necessary, such as toilet paper, should have lower betas than firms selling products that customers can defer or delay buying (discretionary products).
Degree of Operating Leverage
The degree of operating leverage will strongly affect the volatility in operating income of a firm. The operating leverage is the relationship between fixed costs and total costs. A firm with a high level of fixed costs will have a greater variance in operating income than a firm with a low portion of fixed costs, and should therefore have a higher beta. The level of operating leverage can be difficult to measure from the outside of a firm, but a good approximation can be reached by examining the changes in operating income and sales. The degree of operating leverage can then be calculated as follows.
sales in change profit operating in change leverage operating of Degree _ _ _ % _ _ _ _ % _ _ _ = Degree of financial leverage
A higher degree of financial leverage intuitively leads us to expect that the firm would be subject to a higher risk. A fixed interest payment on the debt would make our net income vary more compared to sales, and there is also the risk of a change in credit rating, which would increase interest costs in bad times and decrease them in good times. The beta for the equity in a firm with debt is called the levered beta,
βL, and the beta for a firm without debt is called the unlevered beta, βU. The
unlevered beta in a firm is determined by the type of business and the operating leverage. The relationship between the two is illustrated below.
( )(
)
(
t D E)
L U − + = 1 1 β βWhere D/E is the debt-to-equity (market value), t the corporate tax, βL the
levered beta (also referred to as equity beta) and βU the unlevered beta (also refered
to as asset beta since it is determined by the assets owned by the company)
Figure 4.2 – Fundamental Beta Determinants
55 ”Investment Valuation” – Damodaran, p.185 56 ”Investment Valuation” – Damodaran, p.192
The beta of two assets put together is the weighted average of the individual betas, with the weights based on market value57. Consequently, the beta for a firm is the weighted average of the
betas of all the different businesses it is in. If we do not have the market value of the businesses, we can use sales or operating revenue as weights.
We can now estimate the beta in the three steps shown in figure 4.3.
Step Description
Estimate the Unlevered Beta
Identify the businesses and find peer groups (read about how a peer group is found in the section on relative valuation) of publicly traded firms in each field. By using the regression betas of the firms in the peer groups, we can calculate an average beta for each business line. Calculate the average debt-to-equity ratio of each peer group and unlever the betas using the following formula.
( )(
)
(
ratio of peer group)
group peer of Average L ess Bu U E D t _ _ _ _ _ _ _ sin _ 1 1+ − = β β
It is possible to calculate the unlevered betas of each firm in the peer group and then take the average, but this approach is likely to enhance errors in the regression betas.
Estimate the Business Beta
The effects of differences in operating leverage can also be striped out of the unlevered beta. The result is called a business beta since it should depend only on the type of business. If we are able to get the fixed and variable costs of the firms in the peer groups, the following relationship can be used.
⎟⎟ ⎠ ⎞ ⎜⎜ ⎝ ⎛ + = ts Variable ts Fixed U Beta ess Bu cos _ cos _ 1 _ sin β β
However, it is often difficult to get the ratio between fixed costs and variable costs form the outside of a firm. Analysts therefore commonly use the following formula.
⎟⎟ ⎠ ⎞ ⎜⎜ ⎝ ⎛ = sales in change profit operating in change U Beta ess Bu _ _ _ % _ _ _ _ % _ sin β β
We then calculate the operating leverage for the business we are valuing and convert back to get an unlevered beta for that business.
Because of the difficulties in calculating the operating leverage, many analysts make the assumption that companies in the same line of business should have similar operating leverage and skip this step altogether.
Estimate the Levered Beta
We have now found the unlevered beta for each business line of the firm we are valuing. By calculating the weighted average of those betas we find the unlevered beta for the firm. We then estimate the current market values of debt and equity of the firm and lever the beta.
Figure 4.3 – Beta Estimation in Three Steps
Betas calculated by this approach are called “Bottom-Up Betas”58. One of the greatest advantages
with those betas is that the standard error is brought down significantly. One can assume that the standard errors are uncorrelated across firms and therefore the standard error of the bottom-up beta should be.
n error dard s Average error dard
Stan _ bottom−up_beta = _ tan _ peer_group Where n is the number of firms in the peer group.
Another advantage is that we use the current capital structure as opposed to the historical.
Accounting Betas
By regressing the changes in profit of a firm against the changes in profits of an index an accounting beta can be calculated. Since profits are subject to changes in accounting methods and earnings tend to be smoothened out compared to underlying value, this tends to be a worse estimation compared with those described above59. Earning measures are usually less frequent as
well, normally only quarterly or yearly.
4.1.3 Weighted Average Cost of Capital (WACC)
The cost of capital will be used as our discount rate in the discounted cash flow model60. To go
from the cost of equity to the cost of capital we take the Weighted Average Cost of Capital (WACC), which is calculated as follows.
( )
t r D E D r D E E WACC e ⎟d − ⎠ ⎞ ⎜ ⎝ ⎛ + + ⎟ ⎠ ⎞ ⎜ ⎝ ⎛ + = 1Where E is the market value of the firm’s equity (Market Cap), D the market value of the firm’s debt (book value can normally be used), re is the cost of equity, rd is the cost of debt and t is the
corporate tax rate.
Estimating the Cost of Debt
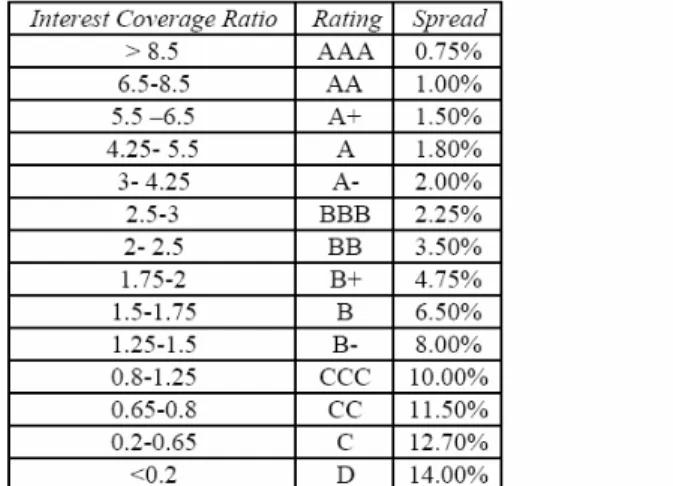
The cost of debt is determined by the risk free rate, the default risk of the firm and the tax advantage associated with debt. If the company has bonds outstanding that are traded frequently we can use the yield of those bonds as our cost of debt. If this is not the case we have to estimate a default spread, which we add to our risk free rate to get our cost of debt. If the firm has a credit rating we can take the default spread corresponding to this rating, but if this is not the case we will have to estimate a synthetic rating our selves and then match it to the list. An example of such a list is presented in figure 4.461.
58 ”Investment Valuation” – Damodaran, p.196 59 ”Investment Valuation” – Damodaran, p.203
60 ”Valuation” – Koller, Goedhart & Wessels (McKinsey & Company) p.111 61 ”Investment Valuation” – Damodaran, p.209
Figure 4.4 – Illustrative Example of Spread Ranges
By estimating the interest coverage ratio of the firm we can get an idea of its rating.
As tax rate we use the marginal tax rate since interest expenses are deducted from our last dollar of income.
4.1.4 Free Cash Flow (FCF)
There are different ways of calculating the FCF depending on whether the cash flow to equity or the cash flow to debt and equity is sought after. We are interested in firm value so the cash flow to debt and equity is what we seek62. Thus, we will start with the operating profit or Earnings
before interest and tax (EBIT). The EBIT is just above the interest expenses in the income statement so we have not yet paid anything to our debt or equity. From the EBIT we will have to deduct taxes. Effective tax rates can be lower than the marginal tax rates if a company has loss carry forwards, tax credits or if the firm defers taxes. None of which can be sustained in perpetuity63. We will use the marginal tax rate and then compensate then compensate for tax
savings afterwards. For multinational firms we calculate a weighted average of the marginal tax rates in the different countries, with the earnings in each country as weights. The problem with this is that the weights may change over time. If we believe that this will alter our cash flows significantly we will have to keep the different income streams separated and apply the appropriate tax rate to each. Another approach is to assume that the income generated in other countries will eventually have to be repatriated to the land of origin. The firm will then have to pay the marginal tax of the country of origin, which makes this tax applicable to all income streams64. By deducting taxes from our operating income we obtain our net operating profit after
tax (NOPAT)65.
( )
tEBIT
NOPAT= 1−
To our NOPAT we will add depreciations and amortizations (D&A), since they do not generate any cash flows66. The current D&As are easily found in the company’s financial statements but
62 ”Investment Valuation” – Damodaran, p.247 63 ”Investment Valuation” – Damodaran, p.249 64 ”Investment Valuation” – Damodaran, p.249
65 ”Valuation” – Koller, Goedhart & Wessels (McKinsey & Company) p.162 & 174 66 ”Valuation” – Koller, Goedhart & Wessels (McKinsey & Company) p.178
we also need to forcast them into the future. There are two common approaches used in doing this. We can either look at the D&As as a percent of sales and keep this percentage, or we can look at the trend in D&As. If for example the D&As have increased with a compounded annual growth rate (CAGR) of 4% over the last five years, we could use this growth rate in the future as well. As a firm approaches stable growth net investments tend to decrease and D&As approach CapEx.
Next, we will deduct capital expenditures (CapEX). The present value can be found in the financial statements but here too we will have to forecast into the future. Capital expenditures often come as lump sums67. A firm may for example make a huge investment in a factory one
year and then make very small investments over the next few years. To normalize the capital expenditures we will take the average over an investment cycle, normally around 5 years. We will usually look for the average CapEx as percent of sales or D&As and use this to forecast the future. It can also be useful to look at the Sales-to-Capital ratio68. This ratio is the revenue of a
firm divided by the book capital invested in the firm. If this ratio has historically been stable we can make the assumption that it will stay this way and hence we have our reinvestment needs relative to our revenue growth. If historical records are not available, an industry average can be used. Should a firm’s strategy include significant growth by acquisitions and this growth is included in our forecast of revenue growth, we should normalize the amount spent on acquisitions and add it to the CapEx. In the passage on growth estimates investments, return on investments and growth are linked in a useful way.
Finally we will have to adjust our cash flows to changes in working capital. Working capital is defined as the difference between current assets and current liabilities. We will adjust it by striping out cash and marketable securities from the current assets and by stripping out interest-bearing debt from the current liabilities69. Cash and debt are included when we calculate the cost
of capital and they should not be included here. To estimate the working capital needs in the future we can calculate the average percent of sales that the change in working capital has constituted over a historical period, usually 5 years. This is a good approach if there is no clear trend of the working capital increasing or decreasing as a percentage of sales. In the case of such a trend or if the business is changing so that growth occurs in new areas which might have other working capital needs, a better approach is to take the change in working capital divided by the change in revenues. If, for example, our revenues increased by $100m in the last year and our working capital increased by $10m, we see that the change in working capital is 10% of the change in revenue and we can use this to forecast the future working capital needs.
The formula for calculating the free cash flow is then.
4.1.5 Estimating Growth during the High Growth Period
Firms can only sustain high growth for a certain period, after which they go into a state of stable growth. This state is characterized by growth rates equal to or below the growth rate of the economy in which the company operates70. When we examine the period of high growth of a
company our main problems are to estimate the growth rate and the length of the period.
Growth Rate
67 ”Investment Valuation” – Damodaran, p.256 68 ”Investment Valuation” – Damodaran, p.298 69 ”Investment Valuation” – Damodaran, p.261 70 ”Investment Valuation” – Damodaran, p.303
When estimating growth for a firm we can look at its historical growth rate, analyst and management projections or the firm’s fundamentals71. We normally measure historical growth
with the compounded annual growth rate (CAGR), which is calculated as follows.
1 1 0 0 − ⎟ ⎟ ⎠ ⎞ ⎜ ⎜ ⎝ ⎛ = ⎟ ⎠ ⎞ ⎜ ⎝ ⎛ − = = n n year year Sales Sales Sales CAGR
Where n is number of years the CAGR is calculated over. While the CAGR gives us valuable information it does not consider growth trends. We will have to look for these trends and take them into consideration ourselves. Past growth rates are of course useful when estimating future growth, but they should be used with caution. Historical growth rates are a better indicator of future revenue growth than of future earnings growth. They work best on large stable firms and, naturally, become less and less accurate the longer into the future we go.
Listening to equity analysts can also be helpful when valuing a firm. The equity analyst can be expected to be better informed than the general market because he follows the company closely and has a certain access to company management. If several analysts follow the same company we can use the consensus forecast of the firm’s growth. Generally, a higher number of analysts lead to a more accurate consensus forecast. Analysts are good at forecasting growth in the near future (up to a year), after which their advantage of information seams to deteriorate. Analyst figures should be viewed with caution since the analyst may be driven by the prospect of attracting the company as a client to the corporate finance business or make buy-side clients trade the stock more heavily.
Management has a definitive information advantage and their forecasts should generally be very good. However, management is not independent and the same caution as mentioned above has to be made.
Growth can also be estimated by looking at the fundamentals of a company. Growth in operating income can be related to the investments a firm makes and its return on those investments72.
Where
( )
t EBIT WC on Depreciati CapEx rate investment − ∆ + − = 1 _ Re Invested Capital t EBIT ROC _ ) 1 ( − =The reinvestment rate can be measured from the most recent financial statement, but one should take the time to examine a few years back as well in order to estimate the most likely future reinvestment rate. If reinvestments are lumpy, an average should be used. The life cycle of the company should also be considered as reinvestments are likely to decrease as the company matures. With the return on capital (ROC) we use the current return on the book value of debt and equity to estimate the return on future investments. Needless to say this approach might be
71 ”Investment Valuation” – Damodaran, p.268 72 ”Investment Valuation” – Damodaran, p.288