Globaliseringsforum är Entreprenörskapsforums arena med fokus på globalisering-ens effekter på entreprenörskap, mindre företag och innovationer. Ambitionen är att föra fram policyrelevant forskning till beslutsfattare inom såväl politiken som inom privat och offentlig sektor.
Rapporten Sweden´s Position in the Global Economy ger en bred genomgång av samt ana-lyserar de olika faktorer som ligger till grund för Sveriges konkurrenskraft. Hur väl positionerat är Sverige för att hantera framtida utmaningar, globala strukturföränd-ringar och en tilltagande global konkurrens? Vilka områden bör beslutfattarna priori-tera för att lägga grunden till ett fortsatt välstånd framöver? Rapporten mynnar ut i en rad förslag på olika policyförändringar som skulle stärka Sveriges konkurrenskraft. Rapporten är författad av Christian Ketels, forskare vid Handelshögskolan i Stockholm och Harvard Business School.
SWEDEN’S POSITION
IN THE GLOBAL ECONOMY
C h r i s t i a n K e t e l s
OB ALISERIN GSF OR UM RAPPOR T # 2SWEDEN’S POSITION
IN THE GLOBAL ECONOMY
Christian Ketels
G L O B A L I S E R I N G S F O R U M
Globaliseringsforum Rapport #2 © Entreprenörskapsforum, 2012 ISBN: 91-89301-39-0
Författare: Christian Ketels
Grafisk form och produktion: Klas Håkansson, Entreprenörskapsforum
Omslagsfoto: Stock.xchng Tryck: Eklunds tryckeri, Örebro
Entreprenörskapsforum är en oberoende stiftelse och den ledande nätverksorga-nisationen för att initiera och kommunicera policyrelevant forskning om entrepre-nörskap, innovationer och småföretag.
Stiftelsens verksamhet finansieras av staten genom anslag från bl a Vinnova och Näringsdepartementet, offentliga och privata forskningsstiftelser, näringslivs-organisationer, företag och enskilda filantroper.
Författaren svarar själv för problemformulering, val av analysmodell och slutsatser i rapporten.
För mer information se www.entreprenorskapsforum.se
GLOBALISERINGSFORUMS STYRGRUPP
Ulf Berg – Exportrådet (Ordförande)
Leona Achtenhagen – Jönköping International Business School Svante Andersson – Högskolan i Halmstad
Anna Belfrage – Kreab Gavin Anderson Pontus Braunerhjelm – Entreprenörskapsforum Birgitta Ed – Springtime
Per Juth – Swedfund
Christian Ketels – Harvard Business School Göran Marklund – Vinnova
Fredrik Sjöholm – IFN och Örebro Universitet
Tidigare utgivna rapporter från Globalsiseringsforum
Förord
Globaliseringsforum är Entreprenörskapsforums arena med fokus på globalisering-ens effekter på entreprenörskap, mindre företag och innovationer. Ambitionen är att föra fram policyrelevant forskning till beslutsfattare inom såväl politiken som inom privat och offentlig sektor. De rapporter som presenteras och de rekommendationer som förs fram inom ramen för Globaliseringsforum ska vara förankrade i vetenskap-lig forskning. Förhoppningen är att rapporterna också ska initiera och bidra till en mer allmän diskussion och debatt kring de frågor som analyseras.
Globaliseringsforums andra rapport ger en bred genomgång av samt analyserar de olika faktorer som ligger till grund för Sveriges konkurrenskraft. Hur väl positionerat är Sverige för att hantera framtida utmaningar, globala strukturförändringar och en tilltagande global konkurrens? Vilka områden bör beslutfattarna prioritera för att lägga grunden till ett fortsatt välstånd framöver? Rapporten mynnar ut i en rad förslag på olika policyförändringar som skulle stärka Sveriges konkurrenskraft. Rapporten är författad av Christian Ketels, forskare vid Handelshögskolan i Stockholm och Harvard Business School. Författaren svarar för de slutsatser och den analys som presenteras.
Stockholm i maj 2012 Pontus Braunerhjelm
INNEHÅLL
3 Förord
7 Sammanfattning på svenska 9 Executive Summary
9 Swedish Economic Performance
10 Foundations of Sweden’s Global Competitiveness 11 Implications
13 Introduction
15 Methodological framework
17 Performance
17 Prosperity outcomes 25 Global economic activity
35 Observations on performance outcomes
36 Drivers of global competitiveness
36 Overall assessments of competitiveness 38 Institutional quality
39 Macroeconomic policy
40 Business environment conditions 57 Company sophistication
59 Observations on competitiveness fundamentals
61 Concluding observations
62 Integrating individual policies into reform packages 63 Positioning Sweden in the global economy
64 Realigning economic policy tools to meet globalization
EN T r EPr ENör Sk A PSfOruM 7
Sammanfattning på svenska
Under 2012 står den svenska ekonomin inför svåra utmaningar och en osäker framtid. Läget i världsekonomin präglas av stagnation och Europa är kraftigt påverkat av skuldkrisen. På längre sikt påverkas Sverige av Europas avtagande inflytande på världsmarknaden, och en svag ekonomisk tillväxt riskerar att utlösa en ny våg av protektionism.Även om den svenska ekonomin står betydligt bättre rustad än många andra länders, tack vare de ekonomiska reformer som följde i spåren av den ekonomiska krisen under 1990-talet, så finns det orosmoln på himlen. Syftet med rapporten är att blicka framåt och att identifiera vilka nya utmaningar som Sverige måste ta itu med för att även framöver prestera en hög levnadsstandard i en värld präglad av global konkurrens. I egenskap av Globaliseringsforums ”basrapport” är ambitionen att teckna en bred bild och lyfta fram viktiga policyområden som bör prioriteras för ytterligare analys och policyåtgärder.
Sverige presterar bra på nästan alla områden som handlar om konkurrenskraft. Men mot bakgrund av detta borde Sverige kunna uppvisa ännu högre nivåer av välstånd än vad man gör i dag. Det är möjligt att de senaste årens förbättringar av konkurrenskraften ännu inte fullt ut omvandlats till ekonomiska resultat. Men det kan också tyda på att det finns strukturella orsaker som förhindrar Sverige från att utnyttja senare års förstärkta konkurrensposition.
Att vässa konkurrenskraften är en ständig utmaning, och kanske utgör självbe-låtenhet det farligaste hotet mot Sveriges relativt gynnsamma position. Medan svenska politiker med rätta kan vara stolta över vad som uppnåtts under de senaste tio åren, pekar rapporten ut två områden som ger anledning till viss oro framöver: Det första rör interna policyutmaningar, som t.ex. delar av utbildningssystemet och arbetsmarknaden. Detta är en av de grundläggande utmaningarna för svenska politiker som identifieras i rapporten: Hur kan politiken kontinuerligt utvecklas och förbättras för att stärka svensk ekonomis framtida förutsättningar?
Den andra området berör externa faktorer och hör ihop med världsekonomins strukturförändringar. Exportsektorn och den inhemska sektorn uppvisar helt olika dynamik i fråga om produktivitetstillväxt och förmågan att skapa arbetstill-fällen. Detta leder till den andra avgörande frågeställningen för svenska besluts-fattare: Hur behöver den ekonomiska politiken utvecklas för att möta behoven i en föränderlig världsekonomi?
• Intensifiera samordningen av enskilda policyåtgärder för att förbättra deras effektivitet. Till exempel kan reformer riktade mot arbetsmarknaden förväntas få ett större genomslag om utbuds- och efterfrågeåtgärder kombineras. Ökade incitament för arbetslösa att söka arbete som samordnas med åtgärder som syftar till att förbättra kompetensen hos arbetslösa, kan öka företagens efterfrågan på arbetskraft.
• Positionerna Sverige på världsmarknaden och identifiera de policyområden som är avgörande för att lyckats i den globala konkurrensen. Företag har stora valmöjligheter vad gäller lokalisering och expansion av sina verksamheter och de kommer att välja den plats som har bäst förutsättningar. Sveriges politiska insatser för att åtgärda brister på vissa områden måste kompletteras med ett strategiskt fokus på styrkeområden, t.ex. en större öppenhet för kluster-specifika strategier.
• Enskilda policyinsatser bör vara anpassade till det internationella affärslivets förändrade verklighet. T.ex. måste små företags möjligheter av att utgöra en inte-grerad del av regionala innovationssystem och globala värdekedjor förbättras.
EN T r EPr ENör Sk A PSfOruM 9
Executive Summary
In the spring of 2012, the Swedish economy is, as many of its peers, facing a difficult and uncertain economic environment. The economic climate is weak in large parts of the global economy, and Europe remains deeply affected by the sovereign debt crisis. Apart from these largely short-term challenges, there are also longer term con-cerns for Sweden: The relative weight of Europe in the global economy is gradually diminishing, the fragile growth outlook not only in Europe could easily trigger a new wave of protectionism, and the growth of emerging economies with a stronger hand of government in many markets poses further challenges.
While these challenges are real, the Swedish economy looks much better prepared to deal with them than many of its peers. Following its own financial crisis in the early 1990s, subsequent Swedish governments have made policy choices that reversed the country’s previous economic decline. The objective of this report is to look ahead and identify what new challenges Sweden has to address in order to retain and enhance its ability to achieve high standards of living in global competition. As a ‘base report’ for the Globalization Forum’s work, the intention is to go wide rather than deep: we want to identify areas that are a priority for policy action but also further analysis, not develop specific recommendations for any individual policy field.
The methodological framework used in this report is similar to the Nordic Globalization Barometer and related analyses of country competitiveness (Ketels, 2011). At its core is a definition of competitiveness as “the expected level of output per working-age individual, given the overall quality of a country as a place to do busi-ness” (Delgado et al., 2012). This definition is focused on understanding the broad range of drivers of locational prosperity amenable to policy action. The report aims to cover this large range of issues in a way that is accessible and concise: it is com-prehensive in its coverage of policy areas but provides detail only where important to establish a specific argument. It draws largely on existing data and analysis rather than significant primary research. It wants to provide overall orientation and identify critical issues, not answer detailed policy questions in a particular field.
Swedish Economic Performance
Sweden, one of the most prosperous economies throughout the post-war period that then lost its dynamism, has since the crisis of the early 1990s regained its footing. Prosperity growth has been higher than in many peer countries. Sweden also ranks high on a range of other indicators that provide a broader view on the quality of life in Sweden. On income inequality, Sweden still registers much lower inequality than many peer countries but the increase in inequality in recent years has been much higher than elsewhere.
performance on the other are both solid but neither of them is truly excellent. A significant number of countries perform better in one of these dimensions but very few combine strong performance in both. In terms of forward-looking indicators, Sweden’s performance has been mixed: Sweden has lost some position in patenting rates but remains among the top ten countries globally in terms of patenting inten-sity. Sweden has, at least until recently, seen indicators of entrepreneurial activity improve, an area where the country has traditionally lagged many of its peers.
Sweden remains highly integrated into the global economy, with strong trade and investment activity relative to the size of its economy. Export market shares have been eroding, especially in the first half of the last decade but this seems largely a reflection of trade being substituted by foreign direct investment. The trade profile has remained quite traditional: while services have become more important, goods exports have shifted towards a larger role of natural-resource driven products. Among trading partners, neighbors continue to dominate. There has been some growth in the importance of countries like China, but Germany and Norway remain by far more important. Most exporters are large companies, much in line with other countries, but smaller companies have seen their role in trade increase.
Foundations of Sweden’s Global Competitiveness
Sweden performs well in almost all dimensions of competitiveness – this report finds no evidence that would signal a fundamental weakening of its position. Robust macroeconomic policies, supported by a broad consensus in the public and the poli-tical system, have enabled the country to weather the storm of the global crisis. Solid microeconomic conditions, including a high openness to FDI, and a base of highly competitive multinational firms positioned Sweden as one of the key beneficiaries of globalization.
Social infrastructure and political institutions and macroeconomic policy have for some time been clear relative assets for the Swedish economy, the latter especially since the financial crisis of the early 1990s. Company sophistication, too, has long been a relative advantage, but here Sweden’s performance is matched or slightly topped by leading peers. Sweden’s strong performance in this area is likely to be influenced by the important role that its large multinational companies have traditio-nally played in the economy. This dominance is, however, eroding, at least in terms of their contribution to Swedish employment. In terms of business environment quality, Sweden ranks well but there are clear nuances. Communication infrastruc-ture, demand sophistication, and financial markets rank best, the innovation system, cluster presence, and administrative efficiency are ranked somewhat lower, and phy-sical infrastructure, the context for strategy and market rivalry, and the educational system follow not far behind. For none of them the performance is a disaster. The relatively low performance of the education system is the most serious individual
EN T r EPr ENör Sk A PSfOruM 11 concern. Sweden also continues to stick out in terms of its overall tax burden. It has lost ground in terms of business taxation, an area where it used to be relatively attractive.
Policy action over the last year has been significant and affected many dimensions of competitiveness. The education system has seen a range of reforms. The labor market has seen tax and social welfare reforms to enhance entry. The delivery of social services has been opened for private providers to enhance choice and increase efficiency. In almost all of these areas, there has been some success but it is still too early for a final assessment. Especially in the education system there is no evidence of a fundamental change of performance. Policy action has been strongly focused on areas of weaknesses. There has been much less attention to areas of traditional strengths. Partly this is a reflection of a strong hesitation to take any action that might be perceived to prioritize some parts of the economy over others.
Given its overall level of competitiveness, Sweden should be able to register hig-her levels of prosperity than it has today. It is possible that the improvements in competitiveness achieved over the last few years have not been fully translated into economic outcomes. But it could also indicate that there are some structural reasons that keep Sweden from getting the full benefits of its competitiveness.
Implications
Sweden’s overall economic performance and global competitiveness are high and there are no signs of any sudden deterioration threatening in the future. But compe-titiveness is a constant challenge, and maybe the most dangerous threat to Sweden’s position is complacency. While Swedish policy makers can be rightly proud of what has been achieved over the last decade, the report points to two areas that should be a concern looking forward:
Over the last few years, new policy efforts have focused on some of the remaining traditional weaknesses in Sweden’s competitiveness profile, in particular parts of the education system and of the labor market. Here the jury is still out; while some improvements are visible, the overall impact so far falls short of the high ambitions. This is one of the fundamental challenges for Swedish policy makers that this report identifies: How can the impact of the policy measures taken over the last few years be improved?
A number of structural changes in the global economy, many of which have been visible for some time, will continue to slowly but fundamentally affect how competi-tiveness is translated into economic outcomes: Industry value chains and innovation processes are increasingly stretched across organizations and locations. The traded and non-traded sector display increasingly different dynamics in terms of producti-vity growth and job creation. This leads to a second set of fundamental challenges for Swedish policy makers: How does the economic policy approach need to be develo-ped to meet the needs of a changing global economy?
• Enhance the integration of individual policy measures to improve their effec-tiveness. Labor market reforms, for example, will have a higher impact if they combine demand and supply side measures. While increasing incentives for unemployed to search for a job are important, measures that upgrade their capabilities and enhance firms’ demand for these skills can enable them to trigger a much stronger market reaction. Innovation policy, too, needs to be better integrated with demand-side policies and regional development efforts to reach its full effect.
• Develop an overall positioning of Sweden as a place to do business to identify policy areas most critical to succeed in global competition. Companies have seen their locational choices multiply and look for the specific advantages that a place can provide. Sweden’s policy efforts to address weaknesses needs to be supplemented by a strategic focus on areas of strengths. This might also include more openness for cluster-specific strategies.
• Realign individual policies with the realities of changing structures in international business. Policies towards FDI and trade need to be better integrated to match the way companies look at them as complementary modes of internationaliza-tion. The needs of small companies as integrated parts of regional innovation systems and global value chains need to be better served. Efforts to upgrade productivity need to move beyond the traded sector and include local activities where most future job growth will occur.
EN T r EPr ENör Sk A PSfOruM 13
1
1. Introduction
In the spring of 2012, the Swedish economy is, as many of its peers, facing a difficult and uncertain economic environment. The economic climate in Europe remains overall weak, with different countries on an increasingly different path. While the immediate threats to the Euro seem to have been averted for now, there are still seri-ous concerns about the future of the common currency and the nature of European integration in its wake. The US economy has stabilized at a low level of economic growth but the ability of its political system to make the necessary choices continues to be in question. Even in the emerging economies, especially in China, there are growing concerns about the sustainability of current growth rates.
Apart from these short-term cyclical challenges, there are also longer term concerns. The relative weight of Europe in the global economy is gradually diminishing, with Asia the main new hub of economic activity. With the Swedish economy firmly interlinked with its European partners, this could affect growth prospects in a number of ways. The fragile growth outlook not only in Europe could easily trigger a new wave of protectio-nism. Sweden’s open economy would pay a significant price under such a scenario. The growth of emerging economies with a stronger hand of government in many markets poses further challenges. A small country like Sweden with limited economic and politi-cal weight could find it hard to secure a level playing field for its companies.
While these challenges are real, the Swedish economy looks much better prepared to deal with them than many of its peers. Following its own financial crisis in the early 1990s, subsequent Swedish governments have made policy choices that reversed the country’s previous economic decline. These policy choices enabled the swift reac-tion to the global financial crisis in 2008/2009, and Swedish economic policy is now repeatedly named as a role model for others (IMF, 2011; European Council, 2011; Schwab 2011; Ketels, 2011).1 Problems in a number of policy areas are frequently
1. Public reflections of these views were on display at a session on “the Nordic way” at the WEF Summit in Davos in early 2011 (Nordic Council of Ministers, 2011) and in Anders Borg’s selection as European Finance Minister of the Year by the Financial Times (Attkins/Whiffins, 2011) last November.
discussed but overall there is little question that the domestic fundamentals of the Swedish economy have been significantly improved. And these improvements are at the heart of the positive trend the economy has experienced over the last two decades (Bergh, 2011). The current slow-down is likely to be cyclical rather than a sign of a fundamental weakening of the Swedish economy.
Swedish policy makers can rightly be proud about what has been achieved in crea-ting the competitive economy that Sweden is today. The objective of this report is to now look ahead and identify what new challenges Sweden has to address in order to retain and enhance its ability to achieve high standards of living in global competi-tion. As a ‘base report’ for the Globalization Forum’s work, the intention is to go wide rather than deep: we want to identify areas that are a priority for policy action but also further analysis, not develop specific recommendations for any individual policy field. Sweden’s overall competitiveness remains high – this report finds no evidence that would suggest otherwise. Robust macroeconomic policies, supported by a broad consensus in the public and the political system, have enabled the country to weather the storm of the global crisis. Solid microeconomic conditions, including a high openness to FDI, and a base of highly competitive multinational firms positio-ned Sweden as one of the key beneficiaries of globalization. Over the last few years, new policy efforts have focused on some of the remaining traditional weaknesses in Sweden’s competitiveness profile, in particular parts of the education system and of the labor market. Here the jury is still out; while some improvements are visible, the overall impact so far falls short of the high ambitions. This is one of the fundamental challenges for Swedish policy makers that this report identifies: How can the impact of the policy measures taken over the last few years be improved?
This report identifies a number of structural trends in the global economy that have a profound impact on how Sweden’s high competitiveness is being translated into prosperity. These trends have been visible for some time and will continue to slowly but fundamentally affect the context in which Swedish policy makers operate: Industry value chains and innovation processes are increasingly stretched across organizations and locations. New, often smaller companies play an increasing role and value crea-tion does not all occur in one place. Traded or export-oriented activities on the one hand and local or non-traded activities on the other hand display increasingly different dynamics in terms of productivity growth and job creation. This leads to a second set of fundamental challenges for Swedish policy makers that this report identifies: How does the economic policy approach need to be developed to meet the needs of a changing global economy?
In its final section, the report outlines three fundamental directions to address these internal and external challenges:
• Enhance the integration of individual policy measures to improve their effec-tiveness. Labor market reforms, for example, will have a higher impact if they combine demand and supply side measures. While increasing incentives for unemployed to search for a job are important, measures that upgrade their
EN T r EPr ENör Sk A PSfOruM 15 capabilities and enhance firms’ demand for these skills can enable them to trigger a much stronger market reaction.
• Develop an overall positioning of Sweden as a place to do business to identify policy areas most critical to succeed in global competition. Companies have seen their locational choices multiply and look for the specific advantages that a place can provide. Sweden’s policy efforts to address weaknesses needs to be supplemented by a strategic focus on areas of strengths. This might also include more openness for cluster-specific strategies.
• Realign individual policies with the realities of changing structures in international business. Policies towards FDI and trade need to be better integrated to match the way companies look at them as complementary modes of internationaliza-tion. The needs of small companies as integrated parts of regional innovation systems and global value chains need to be better served. Efforts to upgrade productivity need to move beyond the traded sector and include local activities where most future job growth will occur.
Methodological framework
The methodological framework used in this report is similar to the Nordic Globalization Barometer and related analyses of country competitiveness (Ketels, 2011). At its core is a definition of competitiveness as “the expected level of output per working-age individual, given the overall quality of a country as a place to do business” (Delgado et al., 2012). This definition is focused on understanding the drivers of locational prosperity amenable to policy action. It includes both the productivity of the eco-nomic system to mobilize the available workforce and the productivity of individual employees in their jobs.
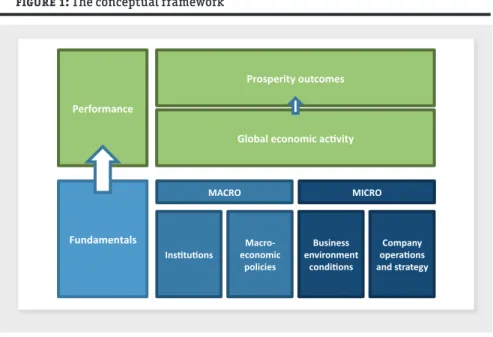
A diagnostic of competitiveness as done in this report derives insights from both dimensions of this definition: It looks as measures of economic performance as the revealed outcomes of competitiveness, and it looks at competitiveness fundamentals as the underlying drivers of these outcomes. The analysis of economic performance looks at the actual level of prosperity (and its logical components) reached, arguably the ultimate objective of economic policy. It also covers measures of global economic activity that give a sense of how underlying competitiveness translates into outcomes in the global marketplace than ultimately are the source of prosperity.
The scope of factors included in the analysis of competitiveness fundamentals is driven by the large literature on cross-country differences in prosperity and growth. Institutional quality (rule of law, provision of basic education and health care, political institutions) has been found to be important and often significantly driven by histo-rical legacy (e.g., La Porta et al., 1998; Hall and Jones, 1999; Acemoglu et al., 2001). Macroeconomic policies are critical in the short run but tend to be largely endoge-nous to the institutional setting in a longer term perspective. Both institutions and
macroeconomic policies are largely set by central government decisions. Business environment conditions include a broad range of policies on factor input and mar-ket conditions that interact in dynamic ways to influence productivity. Company sophistication has traditionally been considered to be endogenous to the broader business environment but recent research has revealed significant performance dif-ferences across companies from otherwise relatively similar economies (e.g. Bloom/ van Reenen, 2007). These microeconomic dimensions are driven by decisions made across a wide range of government agencies at all geographic levels as well as by many companies, universities, and other types of organizations.
Figure 1: The conceptual framework
The report aims to cover a large range of issues in a way that is accessible and concise. This requires clear trade-offs: the report is comprehensive in its coverage of policy areas but provides detail only where important to establish a specific argument.2 It
draws largely on existing data and analysis rather than significant primary research. It wants to provide overall orientation and identify critical issues, not answer detailed policy questions in a particular field.
EN T r EPr ENör Sk A PSfOruM 17
2
2. Performance
a) Prosperity outcomes
Prosperity outcomes are the ultimate test of competitiveness as a location’s ability to support a high and rising standard of living for its economy. The specific patterns of prosperity performance, in particular the components driving income generation, are also an important diagnostic tool to understand the drivers of prosperity and the potential levers for improvement.
i) Standard of living
Sweden is one of the most prosperous economies in the world, ranking 8th on PPP adjusted GDP per capita in 2010. In the last 15 years, it has on this measure surpassed Japan (1998), Germany (1999), Belgium (2000), Denmark (2005), Canada (in 2007, then again in 2010), Ireland (2010), and Iceland (2010; Iceland had surpassed Swedish levels only in 2005). Countries ahead of Sweden include Norway, the Netherlands, Austria, Australia, the United States, and Switzerland. Historically, Sweden had ranked even higher during the 1960s and early 1980s, when countries like Austria, Australia, and the Netherlands were at or below Swedish levels.
Sweden is a country with a relatively high level of income equality, indicating that average GDP per capita is a meaningful indicator for the overall standard of living large parts of society experience. While still at a low level, Swedish income inequality has increased over the last decades at a rate even faster than in other countries (Björklund/Jäntti, 2011; OECD, 2011d). Swedish inequality measured by the Gini-Coefficient is now roughly at the level it was in the US in the 80s. Measured in other ways, like the ratio of the average income in the top to the bottom ten percent of the income distribution, Sweden still remains far below the inequality levels seen in the US even then (Becker et al, 2010).
Figure 2: Long-term trends in prosperity
Source: Groningen Growth and Development Center, The Conference Board, 2012.
The common trend of increasing income inequality suggest that technological change, globalization, and to some degree also changes on financial markets (Bergh/Nilsson, 2010; Roine/Waldenstrom, 2011) have played an important role. National policies amplified the impact of these factors to different degrees. For Sweden, the low star-ting level of inequality might also be an important factor to explain the – according to some, but not all measures – faster increase in inequality in recent years.
Sweden also ranks well on a number of non-income related measures of the stan-dard of living, like individual happiness, health, and the quality of the environment. The OECD Better Life Index ranks Sweden especially high on environmental quality, political governance, community involvement, life satisfaction, and the quality of health (OECD, 2012). The UNDP Human Development Index puts Sweden among the global top ten countries as well (UNDP, 2011). Sweden also ranks high on measu-res of gender equality, even though there remains a gender gap in areas like board membership.
Overall, Sweden registers, despite the impact of the global crisis over since 2008/2009, a healthy performance on the standard of living. It has outperformed
EN T r EPr ENör Sk A PSfOruM 19 many of its peers but continues to lack behind the US and a number of other OECD countries.
Figure 3: Inequality across european countries
Source: Eurostat, UN (2011)
ii) Productivity
The Swedish economy registers high but not exceptional levels of labor productivity, measured by GDP per capita. In 2010, the level of productivity (GDP per hour worked) in Sweden was at 85% of the US and 93% of the German level (OECD, 2011c). The gap to the US is slightly smaller for GDP per employees; on this account Sweden is about 7% ahead of the German level.
Sweden has registered strong labor productivity growth over the last decade, especially in the years prior to the crisis that started in 2008. The fall in labor pro-ductivity during the crisis was then more pronounced in Sweden then in most other OECD countries, partly because of differences in the labor market response. The slump was then followed by a recovery in labor productivity that was stronger than in countries that had seen productivity drop less during the crisis.
Figure 4: Labor productivity level – OECD countries 2010
Source: OECD (2012)
Figure 5: Labor productivity growth – OECD countries 2001-2010
EN T r EPr ENör Sk A PSfOruM 21
EN T r EPr ENör Sk A PSfOruM 21
Productivity growth over the last decade has been particularly strong in manufac-turing. The overall contribution of this broad sector to productivity growth has been higher than in most peer economies. Finland and Germany are among the few other economies at similar levels of economic development in which manufacturing also contributed more than 50% of total labor productivity growth (OECD, 2008). As in many other European countries but unlike the US, productivity growth in the (gro-wing) services sector has been much more limited (Inklaar et al, 2007).
Much of the recent growth in labor productivity has been attributed to total factor productivity (TFP) growth. Given the statistical nature of TFP as a residual measure capturing all growth not explained by skill upgrading or capital deepening, a signifi-cant share of TFP growth might capture the investments in intangibles (R&D, design, branding) that are not captured in the traditional capital stock measures (Edquist, 2010; Edquist, 2011). Sweden is in this respect quite similar to the US, where business investments in tangibles have also been low over the last decade despite significant productivity growth.
There is no good data on the relative impact of entry and exit versus within com-pany changes on overall productivity growth. Traditionally the churn rate (entry + exit of companies relative to stock of companies) has been slower in Sweden than in many other OECD countries, suggesting that churn has been a less important driver of overall productivity change.
iii) Labor mobilization
The Swedish economy has achieved an overall high level of labor mobilization, mea-sured in terms of employees as a ratio of the working age population. On the overall number of hours worked per capita, an aggregate measure capturing the impact of demographics, labor market conditions, and the nature of typical employment rela-tions, Sweden has surpassed the OECD average and increased its advantage relative to the EU-27.
Unemployment rates have moved upwards during the recent crisis but continue to track well below the level of the EU average. The recent crisis also has had much less severe impact on the labor Swedish labor market than the downturn in the 1990s (Harbo Hansen, 2011). So far there are no signs that the crisis-driven increase in unemployment rates has shifted the structural unemployment rate upwards. The groups that suffered most, both compared to the overall Swedish labor market and relative to the EU average, are workers with temporary contracts and lower skills in the manufacturing sector (OECD, 2011).
Employment has grown marginally in the private sector while the public sector, responsible for all job creation in the 1970s and 1980s, has recently been shrinking at low rate (OECD, 2011). The vast majority of job creation over the last decade has occurred in companies with less than 50 employees. From a sectorial perspective, jobs have shifted from manufacturing to services, from the export oriented economy to local activities, and from larger to smaller companies.
Figure 6: Labor mobilization – hours worked per capita
Source: Conference Board (2012)
Labor market outcomes are in Sweden traditionally highly affected by age, with high employment for older workers and lower employment for younger workers entering the labor market. Recent data shows that Sweden has at 61% the highest employment rate in the age group 60-64 among all EU countries, while it has at close to 13% one of the worst unemployment ratios3 in the age group 15-24 (Eurostat,
2012). Younger workers also have a much higher share of temporary employment than the overall labor force (OECD, 2011). Gender is much less of a differentiating factor for employment rates in Sweden than elsewhere in Europe. Both employment and unemployment rates are similar across gender in Sweden, while females report much lower labor market activity levels in the EU average. Migrants are more than two times as likely to be unemployed than native Swedes (OECD, 2010). This puts Sweden in a group with the other Nordic countries, the Benelux, and Switzerland, while in other OECD countries the differences in labor market outcomes based on nationality are less pronounced.
For full time employees, working hours in Sweden are among the lowest in Europe (Eurofund, 2011). More than a quarter of Swedish employees work part time. This is higher than the EU average and similar to Denmark and Germany; only the
3. The unemployment ratio used for young people does not count students or young people otherwise not looking for a job. The broader measure of the unemployment rate is at close to 23%. See http://epp.eurostat.ec.europa.eu/statistics_explained/index.php/Unemployment_ statistics#Unemployment_trends
EN T r EPr ENör Sk A PSfOruM 23 Netherlands and Switzerland have much higher rates of part time employees. About 15% of Swedish employees have a contract of limited duration (fixed term), roughly in line with the EU average (Eurostat, 2012). Traditionally this type of contract had played a less important role in Sweden but it increased significantly over the last decade.
A consistent feature of the Swedish labor market has been the high share of the working age population receiving different forms of public income support. In 2002, more than 10% of the working age population received sickness or disability benefits; this share has dropped to roughly 8% in 2010 but remains higher than in most other OECD countries (OECD, 2011).
iv) Innovation
Sweden is consistently ranked among the most innovation-driven economies of the world (for such rankings see the European Innovation Union Scoreboard, the World Bank’s Knowledge Economy Index, the Nordic Innovation Monitor, the INSEAD Global Innovation Index, and BCG’s International Innovation Index). On many of the regularly used measures of innovation Sweden is firmly in the leading group of countries globally. This is, for example, the case for patenting intensity, R&D spending relative to GDP, the number of researchers in the labor force, the quality of scientific publications, and the income from licenses and patents. On the first two, Sweden is ahead even of leading peers (Denmark, Finland, Switzerland, US). On the last two, it is slightly behind (Pro Inno Europe, 2012a).
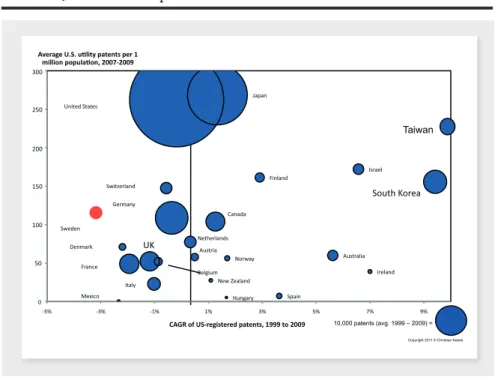
But there are also some signs that this leading position is challenged: On the most recent European Innovation Scoreboard, Sweden continues to rank second after Switzerland but has lost some ground relative to the average of European countries, including some other leading innovators like Finland and Germany (Pro Inno Europe, 2012b). Companies’ spending on R&D has fallen as a share of GNP from 3% in 2000 to 2.1% in 2009. On patenting in the U.S., still the largest market for intellectual pro-perty, patent applications from Sweden have fall behind.
While Sweden has kept its leading position compared to its European peers, a number of non-European countries have rapidly improved its position on patenting as well as R&D inputs. Taiwan and South Korea have already reached levels of paten-ting intensity (and absolute levels of US patenpaten-ting) ahead of Sweden. Countries like China remain far behind on a per-capita basis. But their large absolute size is increasingly felt; foreign companies invest into R&D facilities to meet local political pressure, align products and services with local market needs, but increasingly also to tap into a quickly growing pool of employees with advanced skills. While this has so far not come at the expense of existing R&D activities in Sweden, it is capturing much of the growth in R&D expenditures by Swedish multinationals (Ketels, 2010). At the same time, pressure on the effectiveness of R&D spending is leading many multinational companies to consolidate their global R&D activities in a smaller set of locations within the set of advanced OECD economies. In a few instances this can benefit Sweden; in others, most recently the decision by AstraZeneca to close
its R&D facilities in Södertälje and focus on other existing R&D sites in the UK and the US, it does not.4
Figure 7: Innovative output – selected OECD countries 1999 to 2009
Source: USPTO (2010), Groningen Growth and Development Centre, Total Economy Database (2010)
Country size and innovation performance rankings
Sweden is the largest economy among the Nordic countries, but is small compared to many of the Continental European, OECD, and emerging economies. For economic activities that are like many indicators of innovation performance highly concentra-ted geographically, this can lead to a distorconcentra-ted view in international rankings. While the Stockholm region as a center of innovative activity dominates the Swedish aggregate figures, the performance of leading German or US regions gets washed out in the aggregation across many regions with often lower levels of performance in these countries. Seven US states, for example, have higher R&D spending rates than Sweden (European Commission, 2012). The same is true for a number of European regions that are comparable to Sweden in size.
4. For an in-depth study of AstraZeneca’s activities in Sweden see Andersson et al (2008)
300 250 200 150 100 50
EN T r EPr ENör Sk A PSfOruM 25
EN T r EPr ENör Sk A PSfOruM 25
The discussion of Swedish innovation performance has in the past often focused on the so-called “Swedish paradoxon” (Edquist, 2010; Braunerjhelm et al, 2010), i.e. the view that high innovation inputs generate only limited economic outputs. The data provides a nuanced perspective on this analysis: The missing link is not firm activity; in fact, private sector R&D activity is one of the areas in which Sweden stands out. It is also not simply a lack of linkages between universities and companies; here Sweden ranks at least average if not better compared to its peers. Instead, it is the low propensity to turn academic and commercial R&D activities into other types of economic activity in Sweden that seems to be the challenge.
Entrepreneurship is a critical driver of economic growth and renewal, and often a key source of innovation in an economy. The OECD reports relatively low rates of business entry for Sweden (OECD, 2011b). Unfortunately Sweden has relatively poor data coverage in the Eurostat-OECD Entrepreneurship effort (OECD, 2008a). Other studies, like the Global Entrepreneurship Monitor, also register relatively low levels of entrepreneurship for Sweden. In their assessment the Swedish performance is, however, within the normal range of comparable advanced economies (Braunerhjelm et al, 2011). The levels of entry and new business growth in Sweden are ranked in the middle of the Nordic countries, trailing Denmark and, by a small margin, Finland (NCM, 2010).
There are indications that rates of Swedish entrepreneurship have increased over the last two decades (Braunerhjelm/Thulin, 2010). This growth comes, however, after a dramatic drop during the crisis of the early 1990s. Entrepreneurship activity had only by 2008 reached the levels registered before then.5 The recent crisis seems to
have pushed entrepreneurship down to the low levels seen traditionally (Bornefalk, 2012).6
a) Global economic activity
Measures of Sweden’s integration into the global economy are a second major dimension of Swedish economic performance. Trade, FDI, Migration, and Knowledge are not ultimate policy objectives. But they represent key transmission channels from underlying competitiveness to wealth generation. Both the level and the profile of these measures provide valuable insights for identifying areas of Sweden’s competi-tiveness profile that are barriers to higher prosperity.
i) Trade
Sweden has fully participated in the increase of trade over the last decade. In nominal terms, the value of Swedish exports has doubled between 2000 and 2010, despite the
5. The current lack of high-growth medium-sized companies often noted in the debate could, in fact, be a longer-term result of the crisis in the 1990s, when new entry rates where particularly low.
25% contraction in 2009 as a result of the global crisis (WTO, 2011). Relative to GDP, trade volumes have increased from 86% of GDP in 2000 to 94% in 2010 (Statistics Sweden, 2011). Exports and imports have over this period grown at roughly the same rate.
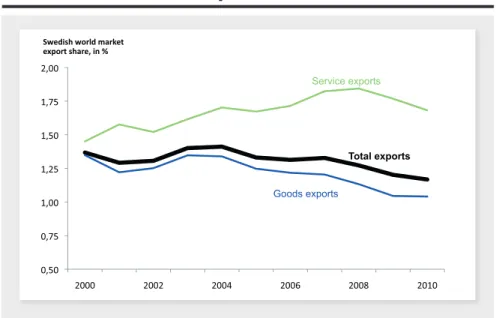
While the Swedish economy has participated in the growth of global trade, it has gradually lost export market share, especially since 2004. This trend was remarkably unaffected by the 2009 global trade collapse. There are a number of reasons for this trend, with China, Central Eastern Europe, and oil being the most important ones. China’s share of world exports has increased from 3.5% in 2000 to 9.2% in 2010; over-all, the BRIC countries gained 8% in world export market share during this period. The impact of the Central Eastern European countries was smaller but they too increased their world export market share from 2.1% to 3.7% over the last decade. Fuels and mining products (of which fuel accounts for a stable 75% of exports) have gone from 13% of all world exports in 2000 to 20% in 2010. All of these factors reduced the rela-tive role of Swedish exports in the global economy, a trend that most other advanced economies have also experienced.
Figure 8: Swedish world market export shares
Source: WTO (2011)
A closer look at types of exports and export destinations provides more detailed insights into the dynamics of Swedish trade over the last decade. In terms of the com-position of exports, the ‘servicification’ of exports is progressing faster in Sweden than for global trade overall (Eliasson et al, 2011; Kommerskollegium, 2010a): over the last decade, the share of services in total Swedish exports increased from 20%
EN T r EPr ENör Sk A PSfOruM 27 to 29% (WTO, 2011). And this share does arguably underestimate the role of ser-vice exports for the Swedish economy, given that goods exports have a significantly higher shared of imported inputs than service exports. On average around 30% of export value added is accounted for by important inputs. These inputs come largely (80%) from other advanced economies although the role of less advanced economies is growing. Taken this factor into account, the share of services in the value added of all Swedish exports has reached 36% (Kommerskollegium, 2010b).
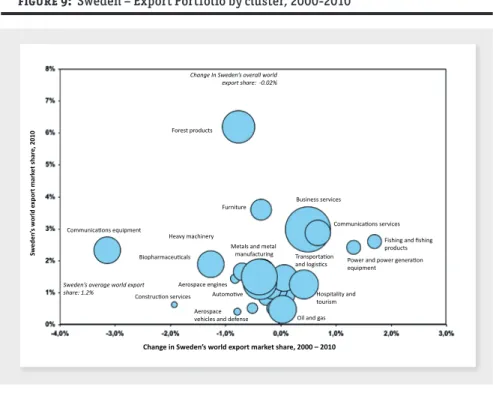
Figure 9: Sweden – Export Portfolio by cluster, 2000-2010
Note: Bubble size is proportional to total export value in 2010
Source: Prof. Michael E. Porter, International Cluster Competitiveness Project, Institute for Strategy and Competitiveness, Harvard Business School; Richard Bryden, Project Director. Underlying data drawn from the UN Commodity Trade Statistics Database and the IMF BOP statistics.
Within goods exports, ten product categories (two-digit SITC level) account for about 60% of all Swedish goods exports, a share that has slightly decreased over the last decade. Among these ten product categories, Swedish exports have gained world market share only in pulp and paper products. In five out of the ten categories market share losses were significantly higher than for Swedish exports overall. Most dramatic was the loss of market share in pharmaceutical and medicinal products, which largely took place between 2000 and 2005. The market share decline in cars
and steel products took place at the same time, while the erosion of market share in telecom products was more continuous over time. Sweden’s export product mix remains biased towards traditional industrial sectors; recent trends have further accentuated this profile.
In terms of the destination of exports, ten countries account for 72% of all Swedish exports. With the exception of China, which is now ranked 10th and pushed Italy out of the top ten in 2009, the countries on this list have not changed over the last decade. Among top export destinations, Germany and Norway share the lead. The UK and the US, two other traditionally large export markets, have become less dominant. Nordic neighbors account for roughly 25% of exports and EU members for around 60%. The BRIC countries have almost doubled their share of Swedish exports over the last decades; they now account for 8% of total exports.
Over the last decade, Sweden hast lost market share in nine out of its ten leading export markets. Only in Denmark the Swedish market share is still at the 2000 level, albeit after higher levels over the last few years. In market share-percentages, Sweden lost most ground in Finland, the Netherlands, China, and Germany over the last decade. In China, Sweden’s share of Chinese imports has been cut by half over the last decade.
China as a market for Swedish products
China is often seen as a crucial market for Swedish exporters, given the growing role of the country in the global economy. In nominal US-Dollar terms, Swedish goods exports to China have more than doubled between 2000 and 2010. In 2010, China purchased 3.5% of all Swedish goods exports, compared to 2.4% a decade earlier.7
During these ten years, Chinese total imports (again in nominal US-Dollars) have gone up more than six times. The market share of Swedish exporters in all Chinese imports has dropped from 1.2% to 0.4%. Most the market share loss occurred during the first half of the decade. Other Nordic countries have seen their relative position shrink as well, while Germany but also Switzerland and the Netherlands have gained position.
The product mix of Swedish exports to China has changed significantly between 2000 and 2010. Telecommunication products accounted for close to 45% of Swedish goods exports to China in 2000. This share has dropped to 3% by 2010. Primary com-modities, including iron ore and pulp & paper, saw their share in Swedish exports to China increase from 3% to 12%. In other product categories, flat-rolled steel (5% of Swedish goods export to China in 2010) and paper (6%) had strongly gained in importance in the first half of the decade but have since lost some of their relative gains. Pharmaceutical products (4%) gained mostly in the second half of the decade.
7. The UNCTAD data does not cover Swedish exports reaching China through other markets, for example, Hong Kong. This might understate Swedish exports but is not likely to systematically bias the comparison with other countries.
EN T r EPr ENör Sk A PSfOruM 29
Figure 10 : Share of Chinese imports – selected European countries
Source: UNCTAD (2011), author’s analysis.
Figure 11: Chinese imports from Sweden – share by product group
Overall, China still ranks far below leading European trading partners in terms of the absolute value of Swedish exports. China will continue to grow faster than these other markets, but given their absolute size and proximity, it is unlikely to replace them.
Sweden has lost market share overall, partly to direct competitors from Europe. And in at least some industries it will also have lost market share to new Chinese competitors. Some of this loss in exports might also be due to Swedish FDI into China that has replaced these trade flows. Exportrådet found sales by Swedish companies in China to be about 3-4 times as high as Swedish exports to China. At least part of the, compared to others, slower growth in Swedish exports to China might be explained by a build-up of production capacity in the Chinese market. Most Swedish companies in China report good profitability, especially when serving industrial mar-kets (Embassy of Sweden, 2012).
An interesting recent trend in the export profile of the Swedish economy is the growing importance of smaller companies. Between 2000 and 2007, i.e. the year before the trade collapse in the wake of the global crisis, companies with less than 200 employees increased their share of Swedish exports by almost 7%. Smaller com-panies are especially active in the trade with neighbors, and have seen their export share grow most with other European countries.
Figure 12: Swedish exports by firm size – selected markets
Note: SMEs defined as <200 employees, bubble size proportional to total export value Source: Statistics Sweden, KTH (2012), author’s analysis
EN T r EPr ENör Sk A PSfOruM 31
EN T r EPr ENör Sk A PSfOruM 31
While less often the focus of public debate, imports are another important aspect of a country’s integration into the global economy. Swedish import growth has matched export growth almost exactly since the mid-1990. Only in the last few years the trade surplus has shrunken somewhat as Swedish demand developed more dynamically than the demand in main export markets. The increasing share of imports in GDP reflects a growing use of imported inputs, especially in manufacturing, where imports accounted for 26.6% in 2005 (2000: 25%). Industrial machinery accounted for 10.4% of Swedish exports in 2011 followed by crude petroleum 7.8%. Electronics and telecommunication products, used both in final consumption and as production inputs, accounted for 15.7% of 2011 imports.
The empirical analyses suggest that increasing imports have had at best a modest impact on the relative demand for different skills in the Swedish labor market (Becker et al., 2010). This is in part a reflection of Swedish imports coming to a large degree from other advanced economies; Germany alone accounts for more than 18% of Swedish imports. China is ranked 9th, with a 3.9% share of Swedish imports – simi-lar to Belgium (Statistics Sweden, 2012). Increasing imports from China have – for a larger sample of western economies including Sweden - been shown to lead to higher overall innovation activity within European firms and to more innovative firms gaining market share (Bloom et al., 2011).
ii) Foreign Direct Investment
Sweden has a long tradition as a source and destination of foreign direct invest-ments. It has a significant number of multinationals, especially relative to the size of its economy, with extensive foreign operations. And it has been open to foreign investments, even into some of its largest companies in areas like automotive and pharmaceuticals.
In 2010, the stock of FDI in Sweden was evaluated at roughly $350bn, almost 3.5 times higher than in 2000 (UNCTAD, 2011).8 The value of Swedish FDI abroad reached
at close to $340bn a similar level but was up only 1.7 times over the same period. In- and outward flows tend be highly volatile year to year. Over the last decade, Sweden registered annual inflows of on average $17bn and outflows of on average $26bn. The change in the value of the inward FDI increased by much more than the cumulative inflow of funds, indicating reinvested profits and increasing value of the assets held by foreigners in Sweden. For outward FDI, the value of the stock increased by less than the cumulative outflows, indicating conversely cumulative losses or a reduction of value in assets acquired by Swedish owners abroad (Statistics Sweden, 2011).
Relative to global FDI activity, Sweden’s position both as a host and a source of FDI has stayed roughly stable over the last decade. Its FDI position has developed
8. The treatment of FDI in official statistics is complex. Many international statistics use current account data. This covers an investment paid with capital from abroad. But it fails to capture changes in market value, or the use of domestic capital markets by foreign companies to finance acquisitions.
somewhat more dynamically than the average EU or OECD economy, especially on inward FDI. In 2010, Sweden accounted for 5.1% of the EU’s inward FDI stock (2.7% of the OECD’s) compared to 4.0% (1.6%) in 2000. The BRIC countries, however, have increased their FDI activity even more. Their inward (outward) FDI stock in 2010 accounted for 13% (6%) of the OECD FDI stock, compared to 6% (1%) in 2000.
Figure 13: Sweden’s foreign direct investment position
Source: UNCTAD (2011), author’s analysis
In 2010, there were 13 627 foreign controlled enterprises with 590 304 employees in the Swedish economy (Tillväxtanalys, 2011a). They employed close to 600,000 employees or 22% of the total labor force. After tripling in the 1990s, the role of foreign-owned companies has been roughly stable since the early 2000s. OECD and EU countries dominate by far as foreign investors in Sweden. Foreign acquisitions of Swedish companies do not seem to have led to a reduction of R&D activities in Sweden (Bandik et al., 2010). While foreign firms have in Sweden traditionally focused on manufacturing activities, their investments in the service sector have grown in recent years (Tillväxtanalys, 2011c).
EN T r EPr ENör Sk A PSfOruM 33
EN T r EPr ENör Sk A PSfOruM 33
In 2009 (the last year for which data has been published), there were 1,476 Swedish controlled groups with affiliates abroad (Tillväxtanalys, 2011b). They employed 1.56 million, 70% of which outside of Sweden. The employment of Swedish multinatio-nals in Sweden has steadily decreased from 700,000 in 1996 to 450,000 in 2009. Conversely, their employment abroad has risen from 600,000 in 1996 to 1,000,000 in 2001 and 1,100,000 in 2009. Nordic neighbors, Germany, the UK and the US dominate as the destinations for Swedish investment abroad. However, much of the recent employment growth in Swedish-owned industrial groups has occurred in lower wage countries. In the service sector, this trend is much weaker (Tillväxtanalys, 2011c). While Swedish companies have sharply increased their share of employment abroad, the relocation of headquarters to locations outside of Sweden visible in the early 1990s seems to have stopped (Henrekson/Öhrn, 2011).
The empirical analyses provide little indication that the job growth in Swedish-owned companies abroad has had a negative effect on Swedish employment. International studies suggest that expansion abroad is at least as likely to secure or upgrade jobs at home (Becker et al., 2010). Offshoring of production activities to other advanced countries (but not to emerging economies) is found to have a mode-rate negative effective on R&D activities in Sweden (Karpaty/Tingvall, 2011). This is consistent with interview evidence that especially development activities have to a significant degree already been moved towards larger markets (Ketels, 2010).
Comparing the dynamics of trade and FDI, it is remarkable how much FDI has increased in relative importance versus trade as a mode of globalization. Even though flow (trade) and stock (FDI) measures are not directly comparable, the differences in growth dynamics are remarkable.9
iii) People and ideas
Sweden is the destination for around 80,000 migrants annually (2009), up from about half the number a decade ago. The number of asylum seekers was 25,000 in 2009 (32,000 in 2010). Around 40,000 Swedes leave the country annually, about twice as many as in 2000. At about 0.9% of the Swedish population, the gross inflow is higher than in Denmark, Finland, Germany, and Poland, but below Norway, Austria, Belgium, and the Netherlands.
The inflow of foreign workers accounted for 18% of all migration to Sweden in 2009, somewhat lower than in many other OECD countries (but the heterogeneity across countries is high, see OECD, 2011f). The inflow of skilled personnel is especially evident in the health care sector, while other sectors have so far benefited much less. The share of foreigners in the Swedish labor force (2.4% of the labor force in 2009
9. Relative price effects, i.e. differences in the inflation rates for the valuation of ownership stakes relative to prices of goods and services might play a role, too, but seem unlikely to explain all of the difference
was born outside of the EU; 2.7% in other EU countries) is somewhat lower than in the EU average, comparable to Denmark (with Denmark having a different mix of EU/ non-EU foreigners) and higher than in Finland (Eurostat, 2012).
Figure 14: The Shifting Face of Globalization – The role of trade and FDI in the
Swedish economy
Source: UNCTAD (2011), author’s analysis.
The share of immigrants among Swedish researchers is higher than in most other countries. At 25%, this rate is similar to the US with only Australia, Canada, and Ireland registering a higher share among OECD countries. Sweden is also an attractive destination for foreign students; about 25% of all new students starting their acade-mic training have been born abroad. European nationalities dominate but Chinese students are the second largest group of foreigners after Germans. Foreign students that are not part of exchange programs are focused on technical areas of study; KTH is the Swedish university with the highest share of foreign students. The 2012 data will show how much this is going to change in response to the introduction of fees for students from non-EU countries. The share of foreign students that takes up work in Sweden after their studies is small (Regeringskansliet, 2011).
Swedish research institutions are highly integrated into international networks. They participate significantly in structures like the EUs Framework Programme (Olivera, 2011). Sweden also registers a solid to strong position in international
EN T r EPr ENör Sk A PSfOruM 35
EN T r EPr ENör Sk A PSfOruM 35
co-publishing and co-patenting, and receives solid inflows from license and patent income from abroad (Pro Inno Europe, 2012).
b) Observations on performance outcomes
Sweden, one of the most prosperous economies throughout the post-war period that then lost its dynamism, has since the crisis of the early 1990s regained its footing. Prosperity growth has been higher than in many peer countries. Sweden also ranks high on a range of other indicators that provide a broader view on the quality of life in Sweden. On one of these, income inequality, Sweden still registers much lower inequality than many peer countries but the increase in inequality in recent years has been much higher than elsewhere.
Sweden’s prosperity growth is broad-based, and it is this combination that dif-ferentiates the country from many others. Productivity on the one hand and labor market performance on the other are both solid but neither of them is truly excellent. A significant number of countries perform better in one of these dimensions but very few combine strong performance in both. In terms of forward-looking indicators, Sweden’s performance has been mixed: Sweden has lost some position in patenting rates but remains among the top ten countries globally in terms of patenting inten-sity. Sweden has, at least until recently, seen indicators of entrepreneurial activity improve, an area where the country has traditionally lagged many of its peers.
Sweden remains highly integrated into the global economy, with strong trade and investment activity relative to the size of its economy. Export market shares have been eroding, especially in the first half of the last decade but this seems largely a reflection of trade being substituted by foreign direct investment. The trade profile has remained quite traditional: while services have become more important, goods exports have shifted towards a larger role of natural-resource driven products. Among trading partners, neighbors continue to dominate. There has been some growth in the importance of countries like China, but Germany and Norway remain by far more important. Most exporters are large companies, much in line with other countries, but smaller companies have seen their role in trade increase.
3
3. Drivers of global
competitiveness
a) Overall assessments of competitiveness
The publication of country rankings on global competitiveness tends to find strong reflection in the media. These rankings differ in scope, i.e. the dimensions of com-petitiveness covered, the source of the data used, and the procedure to aggregate individual indicators into an overall index. The most well-known global rankings with a broad scope are the Global Competitiveness Report (GCR) (Schwab (ed.), 2011) and the World Competitiveness Yearbook (WCY) (IMD, 2011). Most others cover specific aspects of competitiveness (e.g., Doing Business covering administra-tive rules, Economic Freedom covering context for strategy and rivalry). Both the GCR and the WCY use a mix of survey data and statistical data from international agencies, with the GCR drawing on survey data for a larger share of its overall database. The GCR then aggregates indicators using a conceptual structure and weights set based on experts’ reading of the literature. The WCY uses a much more rudimentary framework that mixes data on outcome and framework conditions to derive an overall average score. No formal analysis has been published that proves the statistical power of the overall GCR or WCY scores in explaining prosperity differences.10
10. Delgado et al., 2012 develops an aggregation scheme that generates overall scores from the data underlying the GCR that explain more than 80% of cross-country differences in GDP per capita.
EN T r EPr ENör Sk A PSfOruM 37
Figure 15: Competitivenesss scores of leading countries – 2011
Source: Unpublished data from The Global Competitiveness Report (2011), author’s analysis. Sweden ranks high in pretty much all international comparisons of country com-petitiveness. Sweden’s ranks 3rd in the 2011-2012 Global Competitiveness Report (Schwab, 2011) and 4th in the 2011 World Competitiveness Yearbook. It ranks highest on the 2011 scores that have been shown to correlate strongly with cross-country prosperity differences (Delgado et al., 2012). Interestingly, Sweden ranks on all of these assessments higher on underlying fundamentals than on the actual income generated. This could be either a sign of a different choice in terms on income and non-income benefits or of imbalances in the country’s competitiveness profile that reduce their overall benefit below what would be expected on average.
Conceptually, many economists criticize country rankings because they create the impression that international competition is a zero-sum affair: one country’s gain in rank is by definition another country’s loss. Economic reality is more com-plex: one country’s progress creates growing market opportunities for others. Rising productivity in one country provides access to cheaper or better products for other countries, both as inputs and as consumption goods. While the competitor with improving productivity will capture shares in some markets, adjustments in relative prices will lead to market share losses in others. With perfectly flexible markets, one country’s competitiveness gain is all countries benefit, at least potentially.
While there is significant disagreement about the value of overall competitive-ness rankings, the comparison of individual indicators is an important element of any competitiveness diagnostic (Hausmann et al, 2008; Ketels, 2011b). The rema-inder of this chapter will provide an overview of Sweden’s performance across
the different dimensions of competitiveness, following the conceptual framework outlined in the introduction.
b) Institutional quality
Institutional quality covers the rule of law, the quality of political institutions, and the provision of basic public goods, including education, health care, and public safety. Especially for countries at lower levels of economic development these are critical factors that often take significant time and effort to improve. But even among advan-ced economies there are significant differences in some of these dimensions.
Table 1: Social infrastructure and political institutions (SIPI); Sweden’s ranking over time
Source: Analysis based on WEF Global Executive Opinion Survey and other international statistics, see Delgado et al. 2012.