Research
SKI Report 2007:30
Modelling the Interaction of Low pH
Cements and Bentonite
Issues Affecting the Geochemical Evolution of
Repositories for Radioactive Waste
Claire Watson
Steven Benbow
David Savage
May 2007
SKI Perspective
Background
repositories for radioactive waste. It is well known that in the hyperalkaline conditions (pH > 12) of standard cement pore fluids, there is potential for deleterious effects upon the host rock and other EBS materials, notably bentonite, in geological repositories. Low pH cements are beginning to be considered as a potential alternative material that
Purpose
The purpose of the current project is to perform preliminary modelling to investigate the potential impacts of low pH cement water on bentonite. The evolution of a bentonite sample under the influence of several invading cement porewaters over a pH range from 10 to 13.2 will be compared. The porewater compositions will be taken from published calcium-silicate-hydrate (CSH) gel leaching experiments and published
cement-bentonite modelling studies.
Results
The models suggest that the amount of degradation that is likely to be observed when low pH cement water interacts with bentonite is likely to be much less than when OPC (ordinary portland cement) water is the invading fluid. Below pH 11 there was not an observable Na montmorillonite dissolution front which would tend to support the The models used in this study could be improved upon by including a cement component to the model (rather than representing cement as a fixed boundary
condition). Solid-solution models for the CSH gels are capable of simulating the time-dependent leaching of the cement by the natural groundwater and will give a more realistic bound on the extent of the possible interaction. There are also considerable uncertainties concerning the precise mechanism of the rate of montmorillonite
dissolution at elevated pH. The rate of dissolution may be inhibited by the presence of dissolved Si (and perhaps Al), but this mechanism has yet to be confirmed at the pH of typical cement. The type of secondary minerals assumed to form from cement-bentonite interaction will also have a significant impact upon the rate of montmorillonite
dissolution.
Concrete and cement are used in constructions as well as in conditioning of waste in
may address some of these concerns. SKB has (as the Finnish Posiva and the Japanese
NUMO) defined a pH limit 11 for cement grout leachates.
Continued activity in the research area
The result in this study tends to support the conclusions regarding the lesser negative influence on bentonite by using low pH cement instead of ordinary cement. Knowledge is though still lacking on mechanisms for degradation under various conditions. The degradation models could also be further improved to better represent the cement.
Effect on SKI supervisory and regulatory task
An understanding of the behaviour and influence of cement in repositories is necessary for upcoming SKI reviews of SKB reporting for repositories for low- and intermediate level waste (SFR) and spent nuclear fuel. This study will constitute a basis for further dialogue with SKB on the use of cement in repositories and on the required knowledge base for new materials.
Project information
Responsible at SKI has been Christina Lilja SKI reference: SKI 2006/366
Project number: 200609032
Earlier reports in this project: Benbow, S., Watson, C., and Savage, D., Investigating conceptual models for physical property couplings in solid solution models of cement, SKI Report 2005:64, Swedish Nuclear Power Inspectorate, Stockholm, November 2005.
Research
SKI Report 2007:30
Modelling the Interaction of Low pH
Cements and Bentonite
Issues Affecting the Geochemical Evolution of
Repositories for Radioactive Waste
Claire Watson
Steven Benbow
David Savage
Quintessa Ltd.
The Hub
14 Station Road
Henley-on-Thames
United Kingdom
May 2007
Contents
Summary ... 1
1. Introduction ... 3
2. Description of the model ... 7
2.1. Bentonite mineralogy ... 7 2.2. Secondary minerals... 8 2.3. Kinetic data... 9 2.4. Fluid compositions ... 13 2.5. Other parameters... 16 2.6. Discretisation ... 16
3. Results based on published high pH and low pH models ... 17
4. Results from low pH waters... 23
5. Conclusions... 29
Summary
It is well known that in the hyperalkaline conditions (pH > 12) of standard cement pore fluids, there is potential for deleterious effects upon the host rock and other EBS materials, notably bentonite, in geological repositories for radioactive waste. Low pH cements are beginning to be considered as a potential alternative material that may address some of these concerns.
Low pH cement (also known as low heat cement) was developed by the cement industry for use where large masses of cement (e.g. dams) could cause problems regarding heat generated during curing. In low pH cements, the amount of cement is reduced by substitution of materials such as fly ash, blast furnace slag, silica fume, and/or non-pozzolanic silica flour.
NUMO, Posiva and SKB have defined a pH limit 11 for cement grout leachates. To attain this pH, blending agents must comprise at least 50 wt % of dry materials. Because low pH cement has little, or no free portlandite, the cement consists predominantly of calcium silicate hydrate (CSH) gel with a Ca/Si ratio 0.8. In this report we give the results of a preliminary modelling study to investigate the potential impacts of low pH cement water. We compare the evolution of a bentonite sample under the influence of several invading cement porewaters over a pH range from 10 to 13.2. The porewater compositions are taken from published CSH gel leaching experiments and published cement-bentonite modelling studies.
The models suggest that the amount of degradation that is likely to be observed when low pH cement water interacts with bentonite is likely to be much less than when OPC water is the invading fluid. Below pH 11 there was not an observable Na
montmorillonite dissolution front which would tend to support the pH 11 target suggested by NUMO, Posiva and SKB.
The models used in this study could be improved upon by including a cement component to the model (rather than representing cement as a fixed boundary
time-uncertainties concerning the precise mechanism of the rate of montmorillonite
dissolution at elevated pH. The rate of dissolution may be inhibited by the presence of dissolved Si (and perhaps Al), but this mechanism has yet to be confirmed at the pH of typical cement. The type of secondary minerals assumed to form from
cement-bentonite interaction will also have a significant impact upon the rate of montmorillonite dissolution.
1.Introduction
It is well known that in the presence of hyperalkaline conditions (pH > 12) of standard cement pore fluids there is potential for deleterious effects upon the host rock and other EBS materials, notably bentonite, in geological repositories for radioactive waste, e.g. Savage (1997), Baker et al. (2002), Gaucher and Blanc (2006). Low pH cements are beginning to be considered as a potential alternative material that may address some of these concerns.
Low pH cement was developed by the cement industry, not for its chemical properties, but for its low heat of hydration, for use where large masses of cement (e.g. dams) could cause problems regarding heat generated during curing. This type of cement was first applied in radioactive waste studies by AECL in Canada who developed a low heat of hydration Portland cement (LHHPC) for use as a concrete plug in repository galleries (Gray and Shenton, 1998). The fundamental principle in the production of low pH cement is that the amount of cement is reduced by substitution of materials such as fly ash, blast furnace slag, silica fume, and/or non-pozzolanic silica flour. The lower cement content reduces the heat of hydration through removal of the portlandite component of the cement.
In a joint NUMO, Posiva and SKB report, Bodén and Sievänen (2005) define a target pH limit 11 for cement grout leachates and state that
“The use of standard cementitious material creates pulses of pH 12-13 in the leachates and release alkalis. Such a high pH is detrimental and also unnecessarily complicates the safety analysis of the repository, as the effect of a plume should be considered in the evaluation. As no reliable pH-plume models exist, the use of products giving a pH below 11 in the leachates facilitates safety analysis. Also, according to current
understanding, the use of low-pH cement (pH 11) will not disturb the functioning of the bentonite, although limiting the amount of low-pH cement is recommended”.
To attain such a low pH, blending agents must comprise at least 50 wt % of dry
materials. Because low pH cement has little, or no free portlandite, the cement consists predominantly of calcium silicate hydrate (CSH) gel with a Ca/Si ratio 0.8.
A review of the use of low pH cements in geological repositories for radioactive waste and the implications to performance is given in Savage and Benbow (2007); which notes that a key factor affecting the performance of the bentonite in geological repositories is the clay density since this directly affects the swelling pressure of the buffer.
In this report we model the potential chemical alteration of the bentonite caused by invading cement waters by comparing the evolution of a bentonite sample for a range of cement pore waters with pH ranging from 10 to 13.2. The cement water compositions that are considered are taken from published CSH gel leaching experiments (Harris et al., 2002) and a published cement-bentonite modelling study (Savage et al., 2002). An existing cement-bentonite model (Watson et al., 2004, known hereafter as WHB) has been used to simulate a simple system in which cement is represented using a fixed cement porewater at the boundary of a pure bentonite region. As the cementitious water diffuses into the bentonite, it causes mineralogical alteration in the bentonite. This problem was originally modelled by Savage et al. (2002, known hereafter as SNM), using the coupled reaction-transport code PRECIP (Noy, 1998). Their results were used by WHB to validate a similar code, Raiden 3 (Benbow & Watson, 2004).
In the simulation discussed here, Raiden 3 is again used to model this simple system. The original SNM cement pore waters are replaced by a range of “low pH” pore waters covering pH values from 10.0 to 11.5, the compositions of which are based upon the low pH waters of Harris et al. (2002). These cement water compositions were obtained by leaching synthetic CSH gels in demineralised water. The effect of the varying pH on the alteration of the bentonite is investigated.
This report is structured as follows:
• in Section 2 the system that is modelled is described;
• in Section 3 results using the cement porewaters given by SNM are presented; • in Section 4 results using the low pH porewaters are presented;
• in Section 5 some conclusions are drawn in the context of performance assessment.
2.Description of the model
The one-dimensional model described by SNM, replicated both here and by WHB, consists of a region of montmorillonite-sand mixture, 1 m in length, with pore space initially filled with a low salinity groundwater. At one end, the clay is exposed to cement, containing a high pH (relative to the bentonite pore water) cement pore water. At the opposite end, the clay is kept in contact with the groundwater. The whole system is held at a constant temperature of 25°C throughout the simulation.
2.1.
Bentonite mineralogy
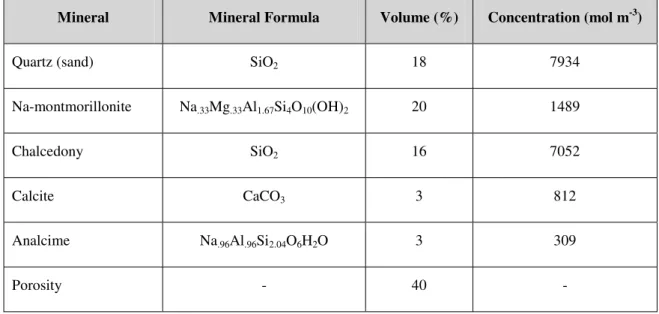
The bentonite mineralogy used in the simulations was chosen by SNM to reflect the likely composition of bentonite barriers which may be used in Japanese disposal facilities for intermediate-level radioactive waste (Ohe et al., 1993). It contains the primary minerals Na-montmorillonite, quartz, analcime, calcite and chalcedony, in the proportions given in Table 1. The initial porosity constitutes 40% of the bentonite volume. Inclusion of quartz in the bentonite buffer will correspondingly reduce the total amount of montmorillonite in the buffer, so that any conversion of this mineral to non-swelling minerals will have a correspondingly greater impact. However, quartz is relatively more reactive than montmorillonite at elevated pH and will thus tend to
Table 1: The mineralogical composition of the bentonite used in the simulations.
Mineral Mineral Formula Volume (%) Concentration (mol m-3)
Quartz (sand) SiO2 18 7934
Na-montmorillonite Na.33Mg.33Al1.67Si4O10(OH)2 20 1489
Chalcedony SiO2 16 7052
Calcite CaCO3 3 812
'protect' the clay from dissolution through sacrificial dissolution. Moreover, there is evidence for decreasing rate of montmorillonite dissolution through a Si-inhibited dissolution mechanism (e.g. Cama et al., 2000).'
2.2.
Secondary minerals
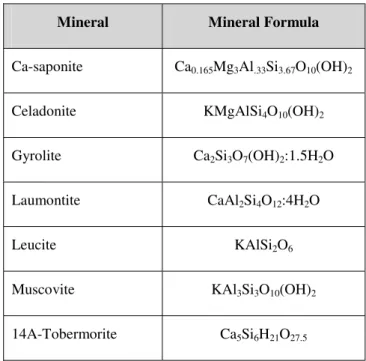
In addition to the primary minerals listed above, a number of secondary minerals are permitted to precipitate and dissolve throughout the course of the simulation. These minerals were chosen by SNM after preliminary closed-system modelling of cement-bentonite interactions using the Geochemist’s Workbench (Bethke, 1992) indicated that they were likely to precipitate. The minerals are listed in Table 2 along with their chemical formulae. Muscovite is included as a proxy for illite, to be consistent with the mineral assemblage assumed in Savagae and Noy (2002). The secondary minerals consist of either clays/sheet silicates (celadonite, muscovite, Ca-saponite), Ca silicate hydrates (gyrolite, tobermorite) or zeolites/framework silicates (laumontite, leucite), in order to represent a range of plausible products. Leucite is included, even though it is not normally associated with low temperature water-rock interactions, since it has been shown to be readily formed by ion-exchange from analcime at low temperatures (Savage et al., 2001).
Table 2: Secondary minerals permitted to precipitate.
Mineral Mineral Formula
Ca-saponite Ca0.165Mg3Al.33Si3.67O10(OH)2
Celadonite KMgAlSi4O10(OH)2
Gyrolite Ca2Si3O7(OH)2:1.5H2O
Laumontite CaAl2Si4O12:4H2O
Leucite KAlSi2O6
Muscovite KAl3Si3O10(OH)2
2.3.
Kinetic data
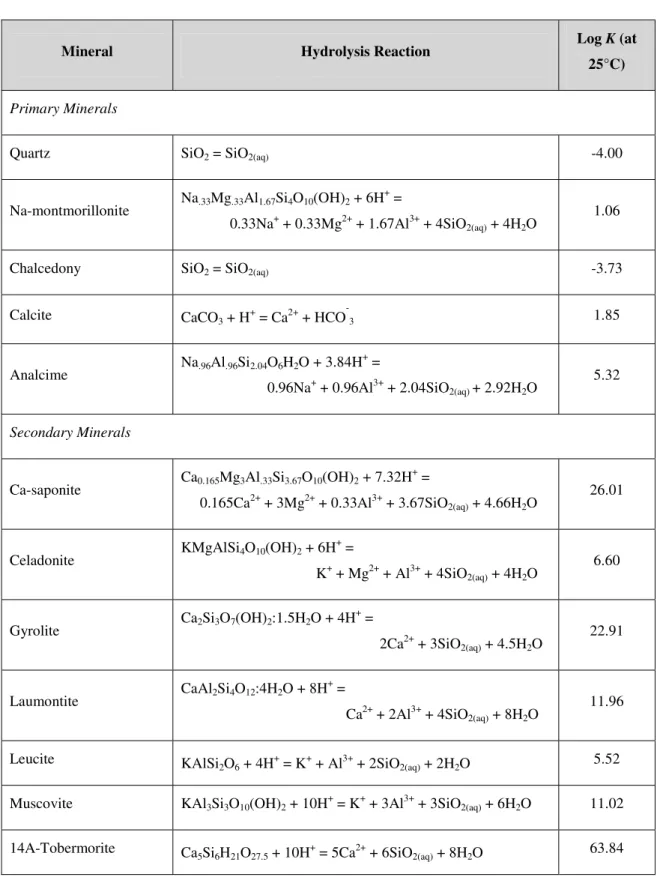
Thermodynamic data for the various minerals is given in Table 3. This data is replicated from SNM, and was originally sourced from the EQ3/6 database (Wolery, 1992). The default database that Raiden utilises was modified to ensure that the Log K values agreed with SNM.
Minerals are allowed to dissolve and precipitate according to kinetic reaction mechanisms of the form:
p m n K Q a A k °¿ ° ¾ ½ °¯ ° ® − ¸¸ ¹ · ¨¨ © § = ( +) 1 Rate Reaction H , (1)
where k is the rate constant (mol m-2 s-1), A is the mineral reactive surface area (m2 m-3),
aH+ is the activity of H+ ions (-), Q is the ion activity product (-), K is the equilibrium
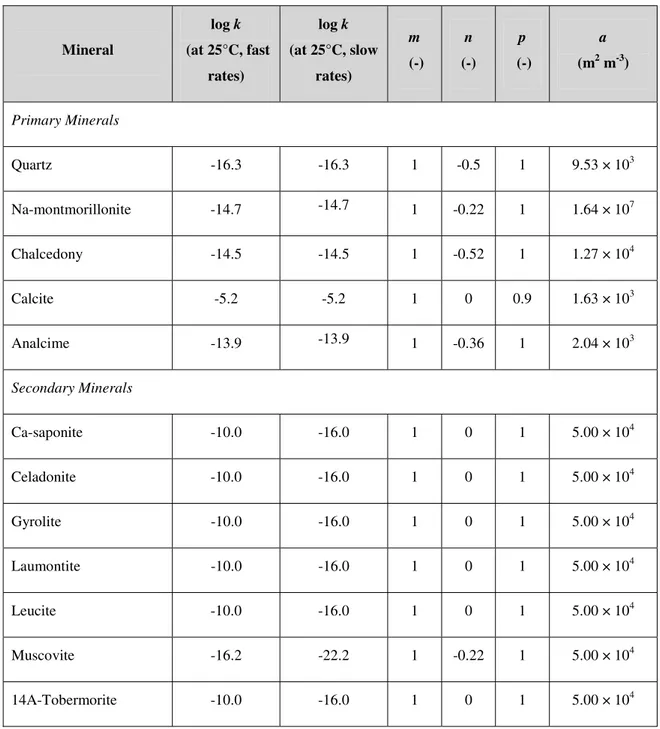
constant (-) and m, n and p are constants (-). Values of K are given in Table 3 for each reaction; Q is calculated from the evolving activities of the reactants and products. The reaction rates for each mineral are given in Table 4 in terms of log k values. These values are taken from SNM. Also included in this table are values of m, n and p for each of the reactions. Note that SNM use different rate equations for each mineral; here we have converted each equation into the same form.
The log k values for primary minerals have been taken from various studies, which are detailed in SNM. In the absence of any published data for secondary minerals (except muscovite), SNM arbitrarily assigned log k values of -10.0, which is rapid compared to the other minerals in the system (with the exception of calcite). As considered in the original study, the effects of assigning a slower reaction rate (six orders of magnitude smaller) will also be investigated here. Kinetic data for muscovite dissolution was taken from Knauss and Wolery (1989). Since this was a rate of dissolution, not precipitation, and also because muscovite is used as a proxy for illite, the reaction rate of muscovite will also be reduced by six orders of magnitude in some cases.
c am
A= V , (2)
where mV is the molar volume of the mineral (m3 mol-1) and c is the concentration of the
mineral (mol m-3). Values of a, given in Table 4, are taken from SNM. Only the value for montmorillonite was measured (JNC, 2000); other primary minerals were assumed to comprise spherical sand-sized particles of size 100 ȝm. Surface areas of secondary minerals were arbitrarily set by SNM.
Clearly A will be zero when the concentration of the mineral is zero. This means that the rate of precipitation for secondary minerals would always be zero, and nothing would grow. In reality, nucleation will occur and crystals will appear out of the
solution; this is approximated in Raiden by setting an arbitrarily small concentration for secondary minerals that are supersaturated in the solution.
Finally, it should be noted that the precipitation of quartz was suppressed in SNM to avoid the conversion of chalcedony directly to quartz. This was achieved by assigning a very small rate constant k when precipitation would occur. The same effect was
attained in the Raiden simulations by setting the reaction rate to zero when the ratio Q/K for quartz was greater than 1.
Table 3: Mineral hydrolysis reactions and equilibrium constants. Data from EQ3/6 database (Wolery, 1992).
Mineral Hydrolysis Reaction Log K (at
25°C)
Primary Minerals
Quartz SiO2 = SiO2(aq) -4.00
Na-montmorillonite Na.33Mg.33Al1.67Si4O10(OH)2 + 6H
+
=
0.33Na+ + 0.33Mg2+ + 1.67Al3+ + 4SiO2(aq) + 4H2O
1.06
Chalcedony SiO2 = SiO2(aq) -3.73
Calcite CaCO3 + H+
= Ca2+ + HCO-3 1.85
Analcime Na.96Al.96Si2.04O6H2O + 3.84H
+
=
0.96Na+ + 0.96Al3+ + 2.04SiO2(aq)+ 2.92H2O
5.32
Secondary Minerals
Ca-saponite Ca0.165Mg3Al.33Si3.67O10(OH)2 + 7.32H
+
=
0.165Ca2+ + 3Mg2+ + 0.33Al3+ + 3.67SiO2(aq) + 4.66H2O
26.01
Celadonite KMgAlSi4O10(OH)2 + 6H
+ = K+ + Mg2+ + Al3+ + 4SiO2(aq) + 4H2O 6.60 Gyrolite Ca2Si3O7(OH)2:1.5H2O + 4H + =
2Ca2+ + 3SiO2(aq) + 4.5H2O
22.91
Laumontite CaAl2Si4O12:4H2O + 8H
+
=
Ca2+ + 2Al3+ + 4SiO2(aq) + 8H2O
11.96
Leucite KAlSi
2O6 + 4H+ = K+ + Al3+ + 2SiO2(aq) + 2H2O 5.52
Muscovite KAl3Si3O10(OH)2 + 10H+ = K+ + 3Al3+ + 3SiO2(aq) + 6H2O 11.02
14A-Tobermorite Ca5Si6H21O27.5 + 10H+
Table 4: Kinetic data for all minerals. The units of k are mol m-2 s-1. All values are taken from Savage et al. (2002); in which original references are given.
Mineral log k (at 25°C, fast rates) log k (at 25°C, slow rates) m (-) n (-) p (-) a (m2 m-3) Primary Minerals Quartz -16.3 -16.3 1 -0.5 1 9.53 × 10³ Na-montmorillonite -14.7 -14.7 1 -0.22 1 1.64 × 10⁷ Chalcedony -14.5 -14.5 1 -0.52 1 1.27 × 10⁴ Calcite -5.2 -5.2 1 0 0.9 1.63 × 10³ Analcime -13.9 -13.9 1 -0.36 1 2.04 × 10³ Secondary Minerals Ca-saponite -10.0 -16.0 1 0 1 5.00 × 10⁴ Celadonite -10.0 -16.0 1 0 1 5.00 × 10⁴ Gyrolite -10.0 -16.0 1 0 1 5.00 × 10⁴ Laumontite -10.0 -16.0 1 0 1 5.00 × 10⁴ Leucite -10.0 -16.0 1 0 1 5.00 × 10⁴ Muscovite -16.2 -22.2 1 -0.22 1 5.00 × 10⁴ 14A-Tobermorite -10.0 -16.0 1 0 1 5.00 × 10⁴
2.4. Fluid compositions
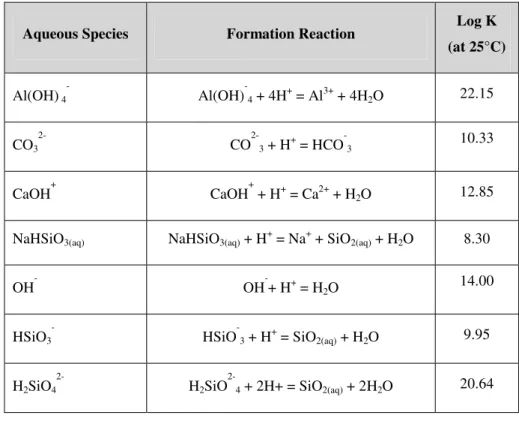
The thermodynamic data used by SNM for the included complex aqueous species is given in Table 5. Case 7 of SNM is being used as a base case here, which employs a small value of the equilibrium constant for H2SiO4
(20.64 as opposed to 22.91). This value was based upon a study by Eikenberg (1990) which suggested an alternative dissociation constant for H2SiO4
better represents dissolved silica data. All log K values in the table are used to override existing values in the Raiden geochemical database.
The bentonite in the simulation is assumed to be initially completely saturated with a groundwater typical of Japanese fractured hard rocks, which was equilibrated with the bentonite by SNM using EQ3/6. The composition of this groundwater is given in Table 6. This porewater composition is comparable with many groundwaters found at depth in the Scandinavian Shield (e.g. Karlsson et al. 1999) and is thus compatible with an analysis of the KBS-3 engineered barrier system.
SNM consider 3 different cement pore waters in their simulations. Most cases used a pore fluid with elevated Na and K concentrations and a high pH (~13), which was thought typical of fluid compositions controlled by readily-leachable hydroxides of K and Na. Case 2 used a pore fluid with an intermediate pH (12.7), characteristic of pore fluids dominated by the dissolution of portlandite. Case 3 used a relatively low pH (11.2) and was thought to be broadly equivalent to that controlled by dissolution of CSH gel. Here the high pH (case 7) and low pH (case 3) pore fluids will be used in addition to the low pH fluids obtained by Harris et al. (2002) by leaching synthetic CSH gels in demineralised water, with pH 10, 10.5, 11 and 11.5.
Table 5: Thermodynamic data for complex aqueous species.
Aqueous Species Formation Reaction Log K (at 25°C) Al(OH) 4 Al(OH)-4 + 4H+ = Al3+ + 4H2O 22.15 CO3 CO2-3 + H+ = HCO -3 10.33 CaOH+ CaOH+ + H+ = Ca2+ + H2O 12.85
NaHSiO3(aq) NaHSiO3(aq) + H+ = Na+ + SiO2(aq) + H2O 8.30
OH- OH-+ H+ = H2O 14.00
HSiO3
HSiO-3 + H+ = SiO2(aq) + H2O 9.95
H2SiO4
2-H2SiO
2-4 + 2H+ = SiO2(aq) + 2H2O 20.64
Table 6: Groundwater composition.
Concentration (mol m-3) / pH (-) Na 3.6 K 5.6 × 10⁻⁵ Ca 1.8 × 10⁻² Mg 4.3 × 10⁻⁷ Al 2.5 × 10⁻³ Si 1.6 × 10⁻¹ Cl 4.0 × 10⁻² C 2.7 S 1.2 × 10⁻¹ pH 9.62
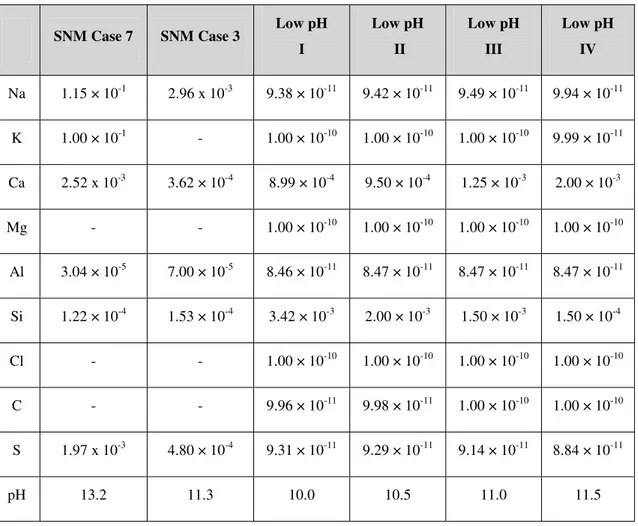
Compositions of all the cement pore fluids are given in Table 7. The high-pH SNM fluid is very rich in both Na and K, with large amounts of Ca and S. The low-pH fluids derived from Harris et al. are largely composed of Ca and Si, with only trace amounts of the other elements.
Table 7: Compositions of the original cement pore waters used by SNM and the new cement waters derived from Harris et al. (2002). Concentrations are in mol l-1.
SNM Case 7 SNM Case 3 Low pH I Low pH II Low pH III Low pH IV Na 1.15 × 10⁻¹ 2.96 x 10⁻³ 9.38 × 10⁻¹¹ 9.42 × 10⁻¹¹ 9.49 × 10⁻¹¹ 9.94 × 10⁻¹¹ K 1.00 × 10⁻¹ - 1.00 × 10⁻¹⁰ 1.00 × 10⁻¹⁰ 1.00 × 10⁻¹⁰ 9.99 × 10⁻¹¹ Ca 2.52 x 10⁻³ 3.62 × 10⁻⁴ 8.99 × 10⁻⁴ 9.50 × 10⁻⁴ 1.25 × 10⁻³ 2.00 × 10⁻³ Mg - - 1.00 × 10⁻¹⁰ 1.00 × 10⁻¹⁰ 1.00 × 10⁻¹⁰ 1.00 × 10⁻¹⁰ Al 3.04 × 10⁻⁵ 7.00 × 10⁻⁵ 8.46 × 10⁻¹¹ 8.47 × 10⁻¹¹ 8.47 × 10⁻¹¹ 8.47 × 10⁻¹¹ Si 1.22 × 10⁻⁴ 1.53 × 10⁻⁴ 3.42 × 10⁻³ 2.00 × 10⁻³ 1.50 × 10⁻³ 1.50 × 10⁻⁴ Cl - - 1.00 × 10⁻¹⁰ 1.00 × 10⁻¹⁰ 1.00 × 10⁻¹⁰ 1.00 × 10⁻¹⁰ C - - 9.96 × 10⁻¹¹ 9.98 × 10⁻¹¹ 1.00 × 10⁻¹⁰ 1.00 × 10⁻¹⁰ S 1.97 x 10⁻³ 4.80 × 10⁻⁴ 9.31 × 10⁻¹¹ 9.29 × 10⁻¹¹ 9.14 × 10⁻¹¹ 8.84 × 10⁻¹¹ pH 13.2 11.3 10.0 10.5 11.0 11.5
2.5. Other parameters
In accordance with SNM, a molecular diffusion coefficient of 2.5 ×10⁻¹⁰ m2s-1 was used for all species. This is multiplied at runtime by the porosity to give the effective
diffusion coefficient, which therefore varies as pore space becomes blocked or released by mineral precipitation and dissolution.
A number of other parameters are required by Raiden which are not given in SNM. These are:
• mineral compressibility, set to 1.0 × 10⁻⁶ Pa-1 for all minerals; • bulk fluid density, set to 1.0 × 10³ kg m-3;
• fluid viscosity, set to 1.0 × 10⁻³ Pa s;
• fluid compressibility, set to 1.0 × 10⁻⁹ Pa-1; and • permeability, set to 1.0 × 10⁻¹⁷ m2 for all media.
2.6. Discretisation
In the original PRECIP simulations a uniform grid with cells of size 1 cm was used, totalling 100 cells. Raiden 3 allows use of a non-uniform grid; this was exploited in the simulations by having a denser grid at the end of the bentonite exposed to the cement water, and a coarser grid at the far end where not much alteration occurs. A total of 70 compartments were used, with a resolution of 0.01 m between 0 m and 0.44 m; 0.015 m to a distance of 0.59 m; 0.02 m to a distance of 0.79 m; 0.04 m to a distance of 0.99 m; and a final compartment of length 0.01 m.
3. Results based on published high pH and
low pH models
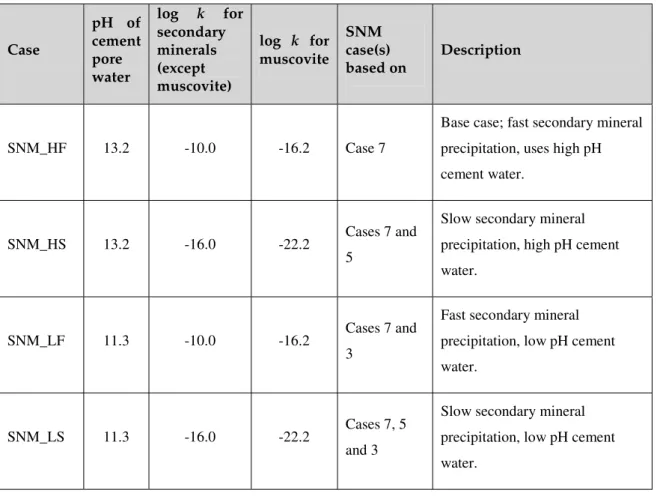
SNM Case 7 is used as the basis for the models derived from Savage et al. (2002), since it uses the most realistic value of log K for H2SiO4
2-, as discussed in Section 2.4. This case uses the high pH (13.2) cement pore water, the composition of which is given in Table 7. It will be labelled as SNM_HF. Three variations on this case are also
considered here, although they are not SNM cases (rather they are combinations of two or more cases). Firstly slower secondary mineral precipitation rates are considered, by lowering the value of log k by six orders of magnitude. This case will be labelled SNM_HS, and is a combination of the SNM cases 7 and 5. Secondly a low pH (11.3) cement water is used with both the fast and slow rates for secondary mineral
precipitation. These cases will be labelled SNM_LF and SNM_LS respectively, and are based on SNM cases 7, 5 and 3. Table 8 summarises these cases.
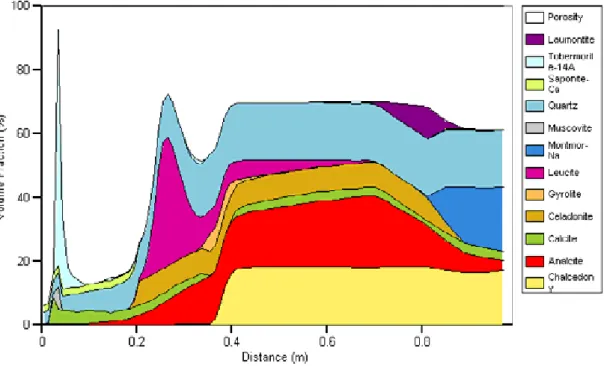
Volume fraction plots for each of the four cases are shown in Figure 1 to Figure 3, after 1000 years of simulation. For cases SNM_LF and SNM_LS, only the first 0.2 m of the bentonite is shown since no alteration is found beyond this depth.
Figure 1 should be compared to Fig. 5 of SNM; agreement between Raiden and PRECIP is very good, with the main differences being the presence of laumontite and the absence of muscovite in the Raiden simulation. Both of these are transient phases, with the ultimate phase being the precipitation of tobermorite. It can be seen that the high pH cement water is very aggressive, dissolving away all of the Na-montmorillonite in the clay up to a distance of 0.8 m after 1000 years. Chalcedony is also removed up to a distance of 0.4 m, with the other primary minerals calcite, analcime and quartz also suffering from dissolution in the same region. The pore space is almost blocked by tobermorite near to the edge of the bentonite where the cementitious water is ingressing; this is preceded by fronts of laumontite, celadonite and leucite.
Table 8: Description of the SNM cases Case pH of cement pore water log k for secondary minerals (except muscovite) log k for muscovite SNM case(s) based on Description SNM_HF 13.2 -10.0 -16.2 Case 7
Base case; fast secondary mineral precipitation, uses high pH cement water.
SNM_HS 13.2 -16.0 -22.2 Cases 7 and
5
Slow secondary mineral precipitation, high pH cement water.
SNM_LF 11.3 -10.0 -16.2 Cases 7 and
3
Fast secondary mineral precipitation, low pH cement water.
SNM_LS 11.3 -16.0 -22.2 Cases 7, 5
and 3
Slow secondary mineral precipitation, low pH cement water.
The profile is very similar for case SNM_HS (Figure 2), which has secondary mineral precipitation rates that are six orders of magnitude slower, though as would be expected there is little secondary mineral precipitation after just 1000 years.
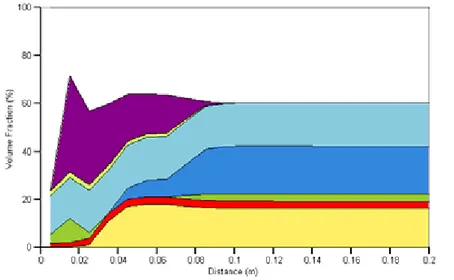
The two cases that use the low pH cement water, shown in Figure 3, show quite different results. The water is far less aggressive and the bentonite minerals are only dissolved in the first 10 cm or so after 1000 years. When secondary minerals have a fast rate assigned, laumontite is the most abundant precipitant, with celadonite and leucite no longer precipitating due to the lack of K+ ions in the low pH cement water. It should also be noted that the rate of secondary mineral precipitation affects the amount of dissolution that occurs; when precipitation is rapid, dissolution is accelerated in order to try to return the system to equilibrium, and the effects are seen up to a distance of approximately 9 cm into the bentonite. When precipitation is slow, dissolution is also reduced as the solution does not become so greatly undersaturated with the various
components. The bentonite is dissolved only up to a distance of approximately 5 cm after 1000 years.
The results from the SNM cases show that the evolution of the bentonite is markedly different for high and low pH cement waters, with the latter being far less aggressive. Determining the correct rate of precipitation for secondary minerals is also important, as this affects the rate of dissolution and the depth of the degradation front.
Figure 1: Volume fraction plot of case SNM_HF (base case) after 1000 years.
(a) Fast secondary mineral kinetic rates, case SNM_LF
(b) Slow secondary mineral kinetic rates, case SNM_LS
Figure 3: Volume fraction plots for cases SNM_LF and SNM_LS (low pH cement water) after 1000 years of simulation. Only the first 0.2 m of the bentonite is shown; the
4. Results from low pH waters
Taking case SNM_HF as a base case, the effects of low pH cement waters were studied in more detail by replacing the original SNM cement waters with four low pH waters calculated from data given in Harris et al. (2002). The pH of the four waters varies from 10.0 to 11.5, and all four share similar compositions, with the main constituents being Ca and Si. The complete compositions are given in Section 2.4. The composition of the waters differs from the low pH (11.3) water considered by SNM, which had appreciable amounts of Na and Al in addition to the Ca and Si, since the Harris et al. waters were obtained from leaching synthetic CSH gels with demineralised water. We can use these waters to test whether the results from the SNM_LF and SNM_LS models from section 3 are broadly representative for invasive low pH waters.
As before, cases were run with both a fast precipitation rate for secondary minerals (log
k = -10, or -16.2 for muscovite) and a slow precipitation rate (log k = -16, or -22.2 for
muscovite).
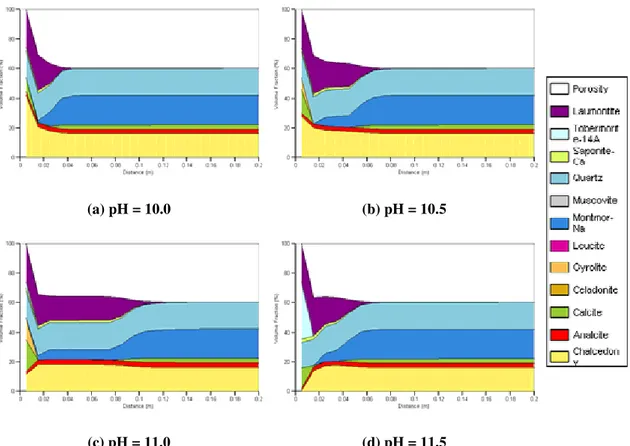
Volume fraction plots showing the bentonite evolution after 1000 years are shown in Figure 4 for the fast-precipitation cases. In all cases only the first 0.2 m of bentonite is shown since the reaction front does not move past this depth. At low pH values, first of all montmorillonite dissolves and the released Al3+ ions are consumed by laumontite which precipitates in large quantities. Eventually the aqueous silica is consumed by chalcedony, which along with the laumontite (and increasingly calcite and gyrolite at higher pH values) causes the pore space in the first compartment to become blocked. For pH values of 10.0, 10.5 and 11.0 it would appear that the trend is for the pore space to take longer to become blocked, so montmorillonite dissolution occurs more quickly deeper into the clay. However, this trend is reversed at pH 11.5; in this case, conditions were favourable for tobermorite growth and this, along with the laumontite and calcite, blocks the first compartment relatively quickly, restricting the montmorillonite
dissolution (Figure 5 and Figure 6). Therefore with these rates for secondary mineral precipitation, there is little difference (in terms of amounts of dissolution) between a pH of 10.5 and 11.5.
vary with pH. The results of such a calculation are shown in Figure 7; there is clearly a point between a pH of 10.5 and 11 where tobermorite becomes more saturated in the solution than chalcedony. This may explain the apparent qualitative change in behaviour when pH approaches 11.
The results obtained for the cement water with a pH of 11.0 are quite similar to those obtained from case SNM_LF (cf. Figure 3 and Figure 4). Montmorillonite dissolution occurs over a similar region (Figure 5) and is replaced by laumontite in both cases. Volume fraction plots for the cases with slow secondary mineral kinetics are shown in Figure 8. Because of the slow rates, laumontite no longer precipitates; however chalcedony appears in greater quantities than before (pH = 10.0 or 10.5) so the pore space in the first compartment is still severely restricted. In the case where the pH of the water was 11.0, tobermorite performs this function instead despite the slow reaction rate. Montmorillonite barely dissolves in all but the pH = 11.5 case, where it disappears completely from the first two compartments. In this case, tobermorite does not
precipitate until the second compartment and does not completely fill the pores, so the effects of the cementitious water can be seen further into the bentonite. As observed in Section 3, the rate of secondary mineral precipitation is important as it controls the rate of montmorillonite dissolution.
(a) pH = 10.0 (b) pH = 10.5
(c) pH = 11.0 (d) pH = 11.5
Figure 4: Volume fraction plots for Harris et al. fast-precipitation low pH cement waters, shown after 1000 years of simulation. Only the first 0.2 m is shown; the
remainder of the bentonite is unaffected.
0 0.05 0.1 0.15 0.2 0.25 0.3 0.35 0.4 0.45 0.5 1 10 100 1000 Time (years) P o ro s ity (-) pH=10.0 pH=10.5 pH=11.0 pH=11.5
0 200 400 600 800 1000 1200 1400 1600 0 0.02 0.04 0.06 0.08 0.1 0.12 0.14 0.16 0.18 0.2 Distance (m) Co n cen trati o n (mo l m-3) pH=10.0 pH=10.5 pH=11.0 pH=11.5 SNM_LF
Figure 6: Profiles of Na-montmorillonite concentration for the 4 low pH cement waters (fast secondary mineral kinetics) after 1000 years. Also shown for comparison is the
profile obtained by case SNM_LF.
-2.5 -2 -1.5 -1 -0.5 0 0.5 10 10.2 10.4 10.6 10.8 11 11.2 11.4 pH lo g( Q/K ) Chalcedony Tobermorite
Figure 7: Single-box study of the low-pH waters (fast secondary mineral kinetics), showing how the saturation of chalcedony and tobermorite change with pH.
(a) pH = 10.0 (b) pH = 10.5
(c) pH = 11.0 (d) pH = 11.5
Figure 8: Volume fraction plots for Harris et al. slow-precipitation low pH cement waters, shown after 1000 years of simulation. Only the first 0.2 m is shown; the
5.Conclusions
We have constructed several models to simulate the interaction between invading cement waters and bentonite. The models considered a range of cement water pH from 10 to 13.2, which were based on previously published modelling studies (Savage et al., 2002) and experimental CSH leaching studies (Harris et al., 2002).
In the high pH simulations, representative of an OPC cement interaction, considerable degradation of the bentonite was observed, with complete removal of
Na-montmorillonite up to a depth of around 0.8 m in a 1000 year period. This depth was reduced to 0.7 m when the rate of reaction of the secondary minerals was reduced, but still demonstrates a considerable amount of alteration of the bentonite which would be sufficient to markedly alter its swelling capacity; which is a key measure of
performance.
The low pH simulations showed a greatly reduced amount of degradation, with bentonite alteration only occurring over depths of 5-10 cm after 1000 years. When secondary mineral reaction rates were high, considerable amounts of laumontite were seen near the inflowing end of the bentonite in many of the low pH simulations, which has the potential to dramatically reduce the porosity and potentially seal the system and inhibit further degradation. For slow secondary minerals rates, the results predicted by the models were inconclusive. The low pH cement water derived from Savage et al. (2002) led to around 8 cm of degradation with little precipitated secondary minerals, whereas the models employing low pH water compositions derived from CSH gel experiments predicted significant calcite precipitation when pH was 10 and 10.5 and significant tobermorite precipitation when pH was 11 or 11.5. In each of these cases the total depth of degradation was still small, being at most 8 cm, but in the cases when pH > 11 a clear Na-montmorillonite dissolution front is present, albeit a slow one.
The models therefore suggest that the amount of degradation that is likely to be observed when low pH cement water interacts with bentonite is likely to be much less than when OPC water is the invading fluid. Below pH 11 there was not an observable Na-montmorillonite dissolution front which would tend to support the pH 11 target
The models used in this study could be improved upon by including a cement component to the model (rather than representing cement as a fixed boundary
condition). Solid-solution models for the CSH gels are capable of simulating the time-dependent leaching of the cement by the natural groundwater and will give a more realistic bound on the extent of the possible interaction. Solid-solution models that could be applied to low pH simulations are discussed in Savage and Benbow (2007). There are also considerable uncertainties concerning the precise mechanism of the rate of montmorillonite dissolution at elevated pH. The rate of dissolution may be inhibited by the presence of dissolved Si (and perhaps Al), but this mechanism has yet to be confirmed at typical cement pH. The type of secondary minerals assumed to form from cement-bentonite interaction will also have a significant impact upon the rate of
References
Baker, A. J., Bateman, K., Hyslop, E. K., Ilett, D. J., Linklater, C. M., Milodowski, A. E., Noy, D. J., Rochelle, C. A., and Tweed, C. J. (2002), “Research on the alkaline disturbed zone resulting from cement-water-rock reactions around a cementitious repository in a silicate-rich host rock”, Nirex Report N/054, UK Nirex Ltd., Harwell, UK.
Benbow, S. J. and Watson, C. E. (2004), “Raiden 3 User Guide”, Quintessa Report QRS-1259A-1, Quintessa Limited, UK.
Bethke, C. M. (1992) “Geochemical Reaction Modelling”, Oxford University Press, London, UK.
Bodén, A., and Sievänen, U. (2005), “Low-pH injection grout for deep repositories. Summary report from a co-operation project between NUMO (Japan), Posiva (Finland) and SKB (Sweden)”, SKB Report R-05-40, Swedish Nuclear Fuel and Waste
Management Company, Stockholm, Sweden.
Cama J. Ganor J, Ayora C and Lasaga A C (2000), “Smectite dissolution kinetics at 80°C and pH 8.8”, Geochim. Cosmochim. Acta, 64, 2701-2717.
Eikenberg, J. (1990), “On the Problem of Silica Solubility at High pH”, Nagra
Technical Report 90-36, Nagra, Wettingen, Switzerland.
Gaucher, E., and Blanc, P. (2006), “Cement/clay interactions - a review: experiments, natural analogues, and modelling”, Waste Management, 26(7):776-88.
Gray, M. N. and Shenton, B. S. (1998), “Design and development of low-heat, high performance reactive powder concrete”, in International Symposium on High
Performance and Reactive Powder Concretes, Sherbrooke, Canada.
Harris, A. W., Manning, M. C., Tearle, W. M. and Tweed, C. J. (2002), “Testing of models of the dissolution of cements – leaching of synthetic CSH gels”, Cem. Concr.
Res. 32:731-746.
Karlsson F., Lindgren M., Skagius K., Wiborgh M. and Engkvist I. (1999), “Evolution of geochemical conditions in SFL 3-5”, SKB Technical report R-99-15, Swedish Nuclear Fuel and Waste Management Co., Stockholm, Sweden.
Knauss, K. G. and Wolery, T. J. (1989) “Muscovite dissolution kinetics as a function of pH and time at 70°C”, Geochim. Cosmochim. Acta 53:1493-1501.
Noy, D. J. (1998), “User Guide to PRECIP, a Program for Coupled Flow and Reactive Solute Transport”, Brit. Geol. Surv. Tech. Rep. WE/98/13, British Geological Survey, UK.
Ohe, T., Tsukamoto, M., Fujita, T., Hesböl, R., Hermansson, H-P. (1993), “Temperature and pH dependence of neptunium (V) sorption on bentonite”. In: Alexandre, D., Baker, R., Kophout, R., Marek, J. (Eds.), “Proceedings of the International Conference on
Nuclear Waster Management and Environmental Remediation”, Amer. Soc. Mech.
Eng., 10354A:197-205
Savage, D and Benbow, S (2007), “Low pH Cements”, SKI Report 2007:32, Swedish Nuclear Power Inspectorate, Stockholm, Sweden.
Savage, D., Noy, D. and Mihara, M. (2002) “Modelling the interaction of bentonite with hyperalkaline fluids”, Applied Geochemistry 17:207-223.
Savage, D., Rochelle, C., Moore, Y., Milodowski, A., Bateman, K., Bailey, D. and Mihara, M. (2001) “Analcite reactions at 25-90°C in hyperalkaline fluids”,
Mineralogical Magazine 65: 571-587.
Savage, D. (1997) “Review of the potential effects of alkaline plume migration from a cementitious repository for radioactive waste”, Research & Development Technical
Report P60, UK Environment Agency, Bristol, UK.
Watson, C. E., Hane, K. and Benbow, S. J. (2004) “Comparison between the Raiden 3 and PRECIP coupled reaction-transport codes: The interaction of bentonite with cementitious fluid”, Quintessa Report QRS-1259A-2 v1.0, Quintessa Limited, UK. Wolery, T. J. (1992) “EQ3NR, a Computer Program for Geochemical Aqueous Speciation-Solubility Calculations: Theoretical Manual, Users Guide and Related Documentation (Version 7.0)”, Lawrence Livermore National Lab., Report Number UCRL-MA-110662 PT IV.
www.ski.se
S TAT E N S K Ä R N K R A F T I N S P E K T I O N