Research
2010:31
Buffer erosion: An overview of concepts
and potential safety consequences
Authors: Michael J. AptedRandy Arthur David Bennett David Savage Göran Sällfors Håkan Wennerström
Title: Buffer erosion: An overview of concepts and potential safety consequences Report number: 2010:31
Author: : Michael J. Apted1, Randy Arthur1, David Bennett2, David Savage3, Göran Sällfors4 and Håkan Wennerström5
1. INTERA Incorporated, 3900 s. Wadsworth Blvd., Suite 555, Denver, Colorado 80235, USA; 2. TerraSalus Limited, Orchard House, Church Lane, Bisbrooke, Oakham, Rutland LE15 9EL, UK; 3. Savage Earth Associates Limited, 32 St Alban’s Avenue, Queen’s Park, Bournemouth BH8 9EE, UK; 4. GeoForce AB, c/o Sällfors, Billdals Almväg 9, 42738 Billdal, Sweden;
5. Dept. of Chemistry, Physical Chemistry 1, Box 124, Lund University, 22100, Lund, Sweden. Date: November 2010
This report concerns a study which has been conducted for the Swedish Radiation Safety Authority, SSM. The conclusions and viewpoints present-ed in the report are those of the author/authors and do not necessarily coincide with those of the SSM.
SSM Perspective
In its safety analysis SR-Can, SKB reported preliminary results and con-clusions on the mechanisms of bentonite colloid formation and stability, with a rough estimate of the consequences of loss of bentonite buffer by erosion. With the review of SR-Can the authorities (SKI and SSI) commen-ted that erosion of the buffer had the greatest safety significance, that the understanding of the mechanisms of buffer erosion was inadequate, and that more work would be required to arrive at robust estimates of the ex-tent and impacts of buffer erosion. After the SR-Can report, SKB started a two-year research project on buffer erosion. The results from this two-year project have been reported in several SKB technical reports.
SSM started this project to build up its own competence in the related scientific areas by a preliminary evaluation of SKB’s research results. Background
The bentonite buffer is an important barrier in the KBS-3 repository concept for final disposal of spent nuclear fuel. Montmorillonite is the primary mineral component of bentonite. This clay mineral will form a stable solid or gel under environmental conditions that are expected to occur during most of the safety-related period of repository evolution at potential repository sites in Sweden. Should glacial meltwaters having an extremely low ionic strength penetrate into the repository depths during future glaciation periods, however, the montmorillonite could potentially be dispersed in the form of suspended colloidal particles that are trans-ported away from deposition holes by groundwater flowing in fractures. This process is usually referred to as buffer (chemical) erosion.
Objectives of the project
The processes of buffer erosion are related to several scientific areas and an understanding of them needs a multidisciplinary approach. The aim of this project is to build up SSM’s competence in the related areas and to prepare SSM for the coming review of SKB’s safety report accompanying its license applications planned in 2011.
Results
This report provides an overview of surface-chemical, physical (inclu-ding rheological) and geochemical processes that could be important in controlling erosional mass losses of the buffer in a KBS-3 repository for spent nuclear fuel. The type of erosion considered in this overview could result from the formation of clay colloids by contact of the bentonite buffer with dilute solutions, such as glacial meltwaters that could migrate to repository depths from a warm-based ice sheet. Theoretical concepts and experimental studies relevant to the advective and diffuse transport of colloidal clay gels and sols that could form as bentonite expands into a fracture intersecting a deposition hole are reviewed. Potential impacts on repository safety caused by the effects of buffer erosion are considered qualitatively. Technical issues that could benefit from additional research are also identified.
Project information
Project management: Jinsong Liu
Contents
1. Introduction ... 3
1.1 Historical background ... 5
1.2 Treatment in SR-Can ... 7
1.3 Terminology ... 8
2. Chemical aspects of buffer erosion... 11
2.1 Chemical constraints on erosion rates ... 11
2.1.1 Force-balance model... 12
2.1.2 Viscosity model ... 13
2.1.3 DLVO theory ... 14
2.1.4 Limitations in DLVO theory ... 23
2.2 Clay colloid formation and stability ... 26
2.2.1 Structure of clays ... 26
2.2.2 Electrostatic interactions ... 27
2.2.3 Swelling properties of clays ... 29
2.2.4 Ion exchange ... 31
2.2.5 Precipitation of a clay sol ... 32
2.3 Summary of relevant experimental observations... 33
2.3.1 Glass slit tests ... 33
2.3.2 Artificial fracture tests ... 37
2.3.3 Erosion tests ... 39
3. Physical aspects of buffer erosion ... 42
3.1 Modelling perspective ... 42 3.2 Assumptions ... 42 3.2.1 Geometry ... 42 3.2.2 Material phases ... 43 3.2.3 Geotechnical parameters ... 43 3.2.4 Flow properties ... 44 3.2.5 Geochemical aspects ... 45
3.3 Experimental backup - verification ... 45
3.3.1 CT model ... 46
3.3.2 KTH model... 46
3.4 Spalling ... 47
3.5 Discussion of assumptions made ... 47
3.5.1 Geometry ... 47
3.5.2 Geotechnical parameters ... 48
3.5.3 Flow properties ... 48
4. Buffer-groundwater interactions ... 50
4.1 The nature of porosity in compacted bentonite... 50
4.1.1 Multiple porosity model ... 50
4.1.2 Single porosity model ... 52
4.2 Mass balances and key processes ... 52
4.2.1 Mineralogical constituents ... 53
4.2.2 Ion exchange ... 53
4.2.3 Clay protonation-deprotonation reactions ... 54
4.2.4 Trace mineral reactions ... 54
4.2.5 Kinetics of clay hydrolysis reactions ... 55
4.3 Geochemical constraints on gel/sol stability ... 55
5. Potential for Filtration to Mitigate Buffer Erosion ... 56
5.1 Introduction ... 56
5.2 Is filtration theory valid? ... 57
5.3 Do filter cakes form? ... 58
5.4 Are filter cakes effective? ... 58
5.5 Do filter cakes persist? ... 60
5.6 Can safety functions be assigned to a degraded barrier? ... 60
6. Conclusions ... 62
6.1 Chemical aspects of buffer erosion ... 62
6.2 Physical aspects of buffer erosion ... 64
6.3 Buffer-groundwater interactions ... 64
6.4 Filtration ... 65
7. Summary of key issues ... 66
7.1 Erosion rates and mass-loss tolerances ... 66
7.2 Impacts on all relevant safety function indicators ... 66
7.3 Force-balance and viscosity models ... 67
7.4 Geochemical constraints on gel/sol stability ... 68
7.5 Characteristics of glacial meltwaters ... 68
7.6 Natural and anthropogenic analogues ... 69
1. Introduction
The bentonite buffer in a KBS-3 repository for spent nuclear fuel may be susceptible to mass losses by erosion should the constituent clay minerals be suspended as colloids that are then transported away from deposition holes in flowing groundwater1. This type of erosion, referred to generally in the present report as “buffer erosion”, could occur in various scenarios, includ-ing those involvinclud-ing the transient migration of glacial meltwaters to reposi-tory depths, because stable suspensions of clay colloids tend to form in aqueous solutions that are relatively dilute (e.g., Miller and Marcos, 2007; Missana et al., 2003).
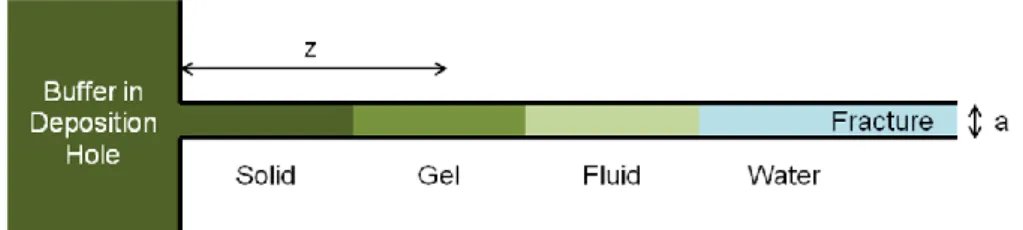
Figure 1_1 illustrates key features of a conceptual model of buffer erosion (Birgersson et al., 2009). The figure represents a vertical cross section through a portion of a KBS-3V deposition hole that is intersected by a hori-zontal fracture. Free swelling of bentonite from the deposition hole outward into the fracture is resisted by friction forces acting within the bentonite and at the rock interface. The maximum penetration distance is reached when these counteracting forces equilibrate. Bentonite density and swelling pres-sure then decrease rapidly with increasing distance in the fracture. The rheological properties of the bentonite change accordingly from those of a solid gel fluid (which may also include a semi-fluid phase) 2. Fluid properties are identical to those of groundwater at the penetration front. Clay colloids form near this front, and are lost by diffusion into the flowing groundwater. Bentonite fluids (i.e., dispersions of bentonite colloids in wa-ter, not solids or gels) may also be lost by advection. More bentonite then extrudes into the fracture from the deposition hole to restore equilibrium. The resultant mass loss of bentonite from the deposition hole results in a decrease in buffer density.
Figure 1_1. Conceptual model of buffer erosion. The swelling pressure of bentonite in the fracture decreases exponentially with increasing dis-tance, z, and, at a given disdis-tance, with decreasing fracture aperture, a (Birgersson et al., 2009). Models suggest that bentonite can extrude 11 m into a fracture having a = 1 mm if the groundwater flow velocity is about 1 m yr-1 (Neretnieks et al., 2009). Penetration distances decrease with increasing groundwater flow velocities.
1 This type of erosion differs from the release of bentonite particles at the buffer-groundwater interface by
shear forces acting on the particles by rapidly flowing groundwater, or, in the process of “piping”, by hydraulic forces acting on the buffer during saturation (Börgesson and Sandén, 2006; Liu and Neretnieks, 2006; Jusilla 2007). These latter types of erosion are not considered here.
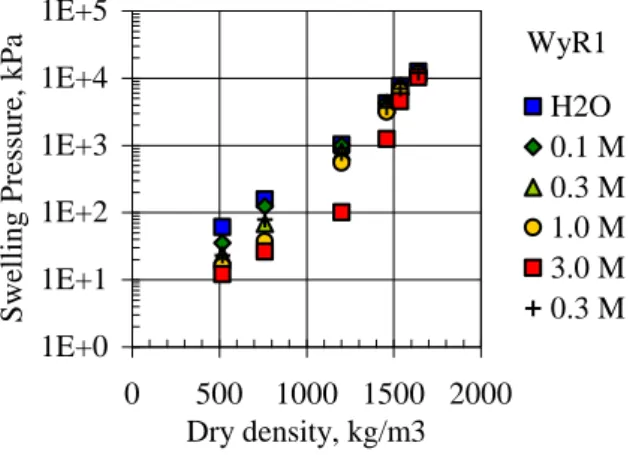
Erosion could adversely impact safety functions of the buffer because the corresponding safety function indicators generally depend, either directly or indirectly, on the buffer‟s density. A case in point is illustrated in Figure 1_2, where swelling pressure (pswell) measurements for an MX-80 bentonite
are plotted as a function of dry density and molar NaCl concentrations in the coexisting aqueous solution3. The SR-Can safety assessment assumed that advective transport conditions in the buffer could be generated if pswell < 100
kPa (SKB, 2006a). As can be seen in Figure 1_2, such low swelling pres-sures correspond to dry densities less than about 1000 kg m-3. Börgesson and Hernelind (2006) determined that a loss of as little as 1200 kg of bentonite from a deposition hole, represented in their model by the complete loss of the half-circumference of two bentonite emplacement rings, would be suffi-cient to locally lower pswell below the threshold value of 100 kPa. Although
there is some uncertainty in this analysis regarding the assumed nature of friction forces acting between the buffer and rock, the results suggest that at higher mass losses adequate swelling pressure cannot be guaranteed and that advection in the buffer could therefore occur. This is a concern primarily because advection could increase the transport rate of corrodants to the can-ister‟s surface, thus potentially decreasing the containment lifetime of this engineered barrier. Buffer erosion was determined to be a key contributor to risk in SR-Can (SKB, 2006a).
Figure 1_2. Plot showing variations in the swelling pressure of MX-80 bentonite as a function of dry density and aqueous NaCl concentration (SKB, 2006b; see also Karnland 1997). The montmorillonite component of the bentonite was in the Na-exchanged form.
Given the potential adverse impacts of buffer erosion on repository safety, The Swedish Radiation Safety Authority [Strålsäkerhetsmyndigheten (SSM)] commissioned the present report to help SSM prepare for the review of future license submittals from SKB for construction and operation of a KBS-3 repository at the Forsmark site.
3 The initial dry density of the buffer in a KBS-3V repository will average about 1570 kg m-3 in order to achieve 1E+0 1E+1 1E+2 1E+3 1E+4 1E+5 0 500 1000 1500 2000 Dry density, kg/m3 Swellin g Pre ss u re, k Pa H2O 0.1 M 0.3 M 1.0 M 3.0 M 0.3 M WyR1
The objective of the report is to provide an overview of current understand-ing regardunderstand-ing features, events and processes governunderstand-ing buffer erosion and its potential impacts on repository safety.
The report is organized as follows. Previous models of buffer erosion and its treatment in SR-can are summarized below, together with notes on the ter-minology used in this report. Chemical and physical constraints on processes controlling buffer erosion are considered in Sections 2 and 3, respectively. Section 4 deals with interactions involving the buffer and groundwater. An evaluation of whether buffer mass losses by erosion could be minimized by the formation of filters composed of accessory minerals in bentonite is de-scribed in Section 5. Concluding remarks are summarized in Section 6, and Section 7 identifies issues for which additional research is recommended.
1.1 Historical background
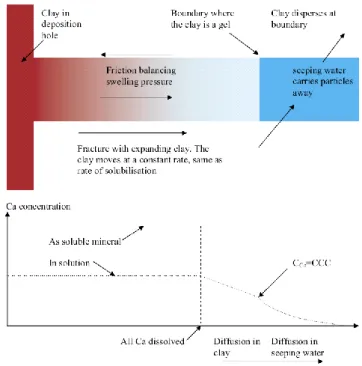
Buffer erosion was first considered in the SR-Can Interim Process Report (SKB, 2004) (Figure 1.1_1). Erosion was assumed to occur only by diffusion of clay colloids into flowing groundwater (i.e., advection of a bentonite fluid was not considered in this model). Conditions promoting the formation and stability of the colloids were accounted for using the concept of a critical coagulation concentration (CCC) for “free” (i.e., uncomplexed) Ca2+
. Clay colloids were assumed not to form at the bentonite-groundwater interface if the Ca2+ concentration in the bentonite porewater was greater than the CCC. The CCC for Ca2+ was assumed to be 1 mM.
Figure 1.1_1. Conceptual model of buffer erosion (SKB, 2004). The buffer is assumed to extrude into a fracture under the control of swell-ing-pressure and friction forces. The concentration of Ca2+ in the seep-ing groundwater is less than the CCC. The Ca2+ concentration at the
interface between the groundwater and buffer is equal to the CCC (i.e., because the gel is stable at that point). Calcium in the buffer porewater diffuses toward the groundwater, and this is accompanied by dissolution of calcite, a Ca-bearing mineral.
SKB assumed that at times in the future when the repository is overlain by a warm-based ice sheet, dilute glacial meltwaters having Ca2+ concentrations below the CCC could flow downward into the repository. A mass balance was used to estimate the extent to which the buffer would then be trans-formed into a stable colloidal suspension and carried away with the ground-water. This resulted in the following equation:
d rycla y i cla y w i eq cla y
c
c
c
c
Q
N
)
(
)
(
0 , (1.1_1)where Nclay refers to the mass of buffer lost per unit time (kg yr-1), Qeq stands
for the equivalent flow rate (m3 yr-1), ci represents the Ca
2+
concentration in groundwater that has reacted with bentonite in the fracture (“leaving groundwater”; mol m-3
), cw denotes the Ca
2+
concentration in groundwater prior to reaction with bentonite in the fracture (“entering groundwater”; mol m-3 ), c0 refers to the concentration of Ca
2+
that could be added to bentonite porewater by dissolution of soluble minerals (mol m-3), clay denotes buffer
porosity, and dry,clay stands for the dry density of the buffer. The equivalent
flow rate was interpreted to represent the flow rate of groundwater that will carry away Ca2+ that diffuses into the groundwater from the buffer‟s porewa-ter with an average concentration equal to the difference between ci and cw.
Equation (1.1_1) was evaluated under two limiting conditions regarding the amount of soluble calcite that was assumed to be initially present in ben-tonite: either 0 or 1 wt%. Any calcite in the buffer was assumed to dissolve completely and instantaneously. Other initial and boundary conditions in-cluded:
Qeq = 0.001 m3 yr-1,
c0 = 10 mol m
-3
(0 wt% calcite) or 1250 mol m-3 (1 wt% calcite),
ci = CCC = 1 mmol m -3 , cw = 0 mol m -3 , dry,clay = 1600 kg m-3, and clay = 0.4.
The results of the calculations indicated Nclay = 0.4 kg yr
-1
for the first case (0 wt% calcite), and Nclay = 0.0032 kg yr
-1
for the second case (1 wt% calcite). If it is assumed that buffer performance could be adversely affected if 1200 kg of bentonite erodes from the fracture/deposition hole (Börgesson and Hernelind, 2006), then these estimated erosion rates suggest that this could happen within about 3,000 to 375,000 years, depending on the amount of calcite initially present in the buffer.
Liu and Neretnieks (2006) used a revised version of the conceptual model discussed above to estimate buffer erosion rates. The revised model differed from the original model in two important respects. First, groundwater flow rates were modelled explicitly instead of using the equivalent flow rate (val-ues for Qeq were also calculated using groundwater flow parameters,
how-ever). Second, Liu and Neretnieks (2006) assumed that Ca concentrations in the buffer‟s porewaters were controlled by the solubility of trace amounts (0.7 wt.%) of gypsum rather than calcite. Gypsum was considered in this model because the solubility of calcite was considered to be too low to sus-tain Ca concentrations above the CCC. The concentration of Ca2+ buffered by gypsum solubility was assumed to be fixed at 9.8 mM.
Liu and Neretnieks (2006) used the FEMLAB computer program (Comsol, 2004) to solve for the integrated total flux of Ca along the extruded ben-tonite-groundwater boundary. The flux was then used to estimate the corre-sponding buffer erosion rate by assuming that the buffer was dispersed as a colloid and lost from the fracture and deposition hole if the concentration of Ca2+ in the buffer porewater fell below the CCC. Results using “central val-ues” for groundwater flow parameters [hydraulic gradient (0.01), transmis-sivity (10-8 m2 s-1) and fracture aperture (10-4 m)] indicated that the erosion rate would be 0.11 kg yr-1. This suggests that 1200 kg of bentonite would be lost in about 11,000 years, leading to the establishment of advective condi-tions thereafter.
An R&D program on buffer erosion was initiated by SKB in 2007. The status of this program was described in a series of workshop proceedings, SKB technical reports, and publications in scientific journals between 2007 and 2010. The results of this R&D program are considered in Sections 2 – 5 of the present report.
1.2 Treatment in SR-Can
The conceptual models described in Section 1.1 were not used to estimate buffer erosion rates in SR-Can. Rather, the rates were calculated using:
,
eq M a x
b u ffer
C
Q
R
(1.2_1)where Rbuffer stands for the erosion rate (kg yr
-1
), CMax refers to the maximum
concentration of bentonite in a water suspension (50 kg m-3) and Qeq denotes
the equivalent flow rate (m3 yr-1) (SKB, 2006a). Bentonite was assumed to consist of a pure Na-montmorillonite. The Cmax value was selected by SKB
based on unreferenced empirical observations.
Equation (1.2_1) was evaluated by assuming that groundwater flow rates at repository depth would be similar to those observed at the Forsmark and Laxemar sites today (SKB, 2006a). The corresponding Qeq distributions were
abstracted from results of three hydrogeological models: 1) a fully correlated discrete fracture network (DFN) model; 2) a semi-correlated DFN model, and 3) a continuous porous medium (CPM) model. The DFN models were
considered to be conservative because they tend to predict more severe con-sequences with respect to solute release and transport. Glacial meltwaters were assumed to migrate to repository depths over a 25,000 year interval within the 120,000 year reference glacial cycle. The models also considered possible spalling of the host rock near deposition holes. Spalling is a poten-tial concern because it could increase the porosity and permeability of the host rock.
Results obtained using the semi-correlated DFN model for the Forsmark site without spalling indicated that 1200 kg of the buffer (i.e. the threshold value for initiation of advective transport) would be lost from about 3% of the deposition holes (SKB, 2006a). The alternative flow models predicted that buffer losses would be less than 1200 kg in all the deposition holes. With spalling, more than 1200 kg of the buffer was predicted to be lost after 25,000 years from 15% of the deposition holes using the fully correlated DFN model, from 35% of the holes using the semi-correlated DFN model, and from none of the holes using the CPM model. Similar estimates using the semi-correlated DFN model for the Laxemar site indicated that at least 1200 kg of bentonite would be lost from 40% of the deposition holes after 25,000 years.
These results suggest that advective conditions in the buffer could be gener-ated in a substantial number of deposition holes over a reasonable range of hydrogeological conditions at the Forsmark and Laxemar sites. SKB noted, however, that the accuracy of erosion rates estimated using Equation (1.2_1) is highly uncertain because the calculation model was not built upon a mechanistic understanding of processes controlling colloid release from compacted buffer materials (SKB, 2006a). Repulsive forces acting to sepa-rate, and thus stabilize, colloidal suspensions were not considered in the model, for example, and these forces should act to increase the erosion rate. On the other hand, SKB noted that preliminary experimental and theoretical evidence (unreferenced) indicated that colloid release from commercial ben-tonites, especially those in which Ca2+ is an important exchangeable cation in montmorillonite, are much less susceptible to colloid formation than are montmorillonites in the pure Na form (SKB, 2006a). For these reasons, SKB concluded that it is possible that actual erosion rates for the buffer could be lower, or higher, than those estimated in SR-Can. The underlying reasons for this uncertainty are considered further in Sections 2 – 4 of the present report.
1.3 Terminology
The colloid nomenclature adopted here is largely that recommended by the International Union for Pure and Applied Chemistry (IUPAC) (see Everett, 1971). Colloids are solid particles (e.g., clays) having a length between 1 nm and 1µm in at least one direction. A colloidal dispersion is a system in which the colloidal particles are dispersed in a continuous medium such as an aqueous solution.
The particles in a colloidal system may be discrete or may form continuous network structures having basic units that are in the range of colloidal di-mensions. A sol is a fluid, or semi-fluid, colloidal system. A gel is a
colloi-dal system having a continuous network structure and a finite yield stress.
Repulsive gels result from electroviscous effects that tend to inhibit colloid
movement in systems having low aqueous salt concentrations and high col-loid concentrations (Lagaly, 2006). Attractive (or cohesive) gels form in aqueous solutions having relatively high salt concentrations, which allow attractive forces between colloidal particles to outweigh repulsive forces. If the attractive forces become too strong the gel network disintegrates, form-ing flocs, which settle into a sediment.
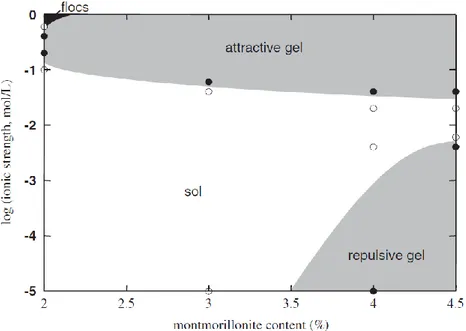
The distinction between sols, gels and flocs is critical because it is generally believed that the buffer will not be susceptible to erosion unless sols form (e.g., Neretnieks et al., 2009). This is an important concept in the context of buffer erosion because stability relations among montmorillonite flocs, sols, attractive gels and repulsive gels can be related to environmental variables, such as electrolyte concentration and clay content (e.g., Figure 1.3_1). These boundaries are somewhat problematic for thixotropic gels, which tend to maintain their shape until they are subjected to shearing or some other dis-turbance. Percolation gels are those for which the sol-gel transition in a col-loidal system is defined based on structural rather than rheological changes. It is worth emphasizing here that montmorillonite sols tend to be stable in relatively dilute solutions having relatively low clay/water ratios. These con-straints are considered further in Section 4.3.
Figure 1.3_1. Sol-gel diagram for Na-montmorillonite in NaCl solutions (Abend and Lagaly, 2000). The stability fields of flocs, attractive gels, repulsive gels and sols are shown in relation to ionic strength and montmorillonite content. Symbols represent experimental observations indicating that gels (solid symbols) or sols/flocs (open symbols) are sta-ble.
Birgersson et al. (2009) characterized bentonite gels and sols based on their rheological properties. Fluids consisting of bentonite sols have Newtonian
viscosities that are fixed and independent of shear rate. Semi-fluids consist-ing of bentonite sols tend to follow a non-linear, power-law relation between shear stress and shear rate, and viscosities tend to decrease with increasing shear rate in these non-Newtonian fluids. Gels behave like sedimentary clays. Their shearing behaviour is best described in terms of a shear resis-tance that must be overcome before further shearing can occur.
The rheological properties of bentonites depend strongly on the water ratio (wr), given by s w r m m w ,
where mw stands for the mass of water and ms refers to the solid mass (i.e.,
dry weight of bentonite). Bentonites containing only a pure Na-montmorillonite are (Birgersson et al., 2009):
a gel if wr < 35;
non-Newtonian fluid (i.e., a semi-fluid) if wr is between 35 and 100;
and
a Newtonian fluid if wr is between 100 and 1000.
At wr > 1000 the effects of montmorillonite content on the rheological
prop-erties of the fluid become negligible. Pure montmorillonite sols can therefore exist only if wr > 35. The wr values defining each of the above categories are
2. Chemical aspects of
buffer erosion
This section considers chemical aspects of buffer erosion. Section 2.1 dis-cusses various chemical constraints on the erosion rate. Section 2.2 disdis-cusses associated issues related to the formation and stability of clay colloids. Sec-tion 2.3 considers some relevant experimental work performed and recently reported by SKB and its contractors. Physical aspects of buffer erosion are considered in Section 3.
2.1 Chemical constraints on erosion rates
The models of buffer erosion described earlier (Section 1.1) assumed that clay particles would be swept away by water flowing in a fracture, but the actual mechanisms involved were not specified. Neretnieks et al. (2009) extended these models to account for forces that would control the expansion of bentonite from a deposition hole into a fracture (dynamic force-balance model), and for the effects of particle and ionic concentrations on the viscos-ity of the expanded bentonite (viscosviscos-ity model). The force-balance and vis-cosity models were combined into an overall model of buffer erosion, which accounts for both the Brownian motion of individual clay colloids into the flowing groundwater and for the advection of sols that form within the frac-ture as the bentonite expands and becomes less dense and less viscous. Chemical aspects of the force-balance and viscosity models are considered in Sections 2.1.1, 2.1.2 and 2.1.3. An alternative modelling approach based on variations in the rheological properties of bentonite as a function of water content was developed by Birgersson et al. (2009) (see Section 3).
Before proceeding to the discussions below, it is worthwhile reviewing re-sults obtained using the buffer erosion model described by Neretnieks et al. (2009). Moreno et al. (2008; 2009) evaluated this model for the idealized case of two-dimensional groundwater flow in a horizontal fracture intersect-ing a deposition hole in a KBS-3V repository. The fracture aperture was assumed to be 1 mm. Bentonite was assumed to consist of pure Na-montmorillonite and the groundwater was represented by a dilute NaCl solu-tion. This simplified system was assumed to be conservative because Ca-dominated clays do not swell as much as their Na-Ca-dominated counterparts and are less susceptible to colloid formation (Neretnieks et al., 2009). The Darcy flow equation, solute diffusion equations, and governing equations underpinning the force-balance and viscosity models were evaluated simul-taneously using a numerical approach and solver (Comsol Multiphysics 2009). As noted above, the force-balance and viscosity models account ex-plicitly for the effects of colloid and ion concentrations on the expansion of bentonite within the fracture and on resultant changes in viscosity.
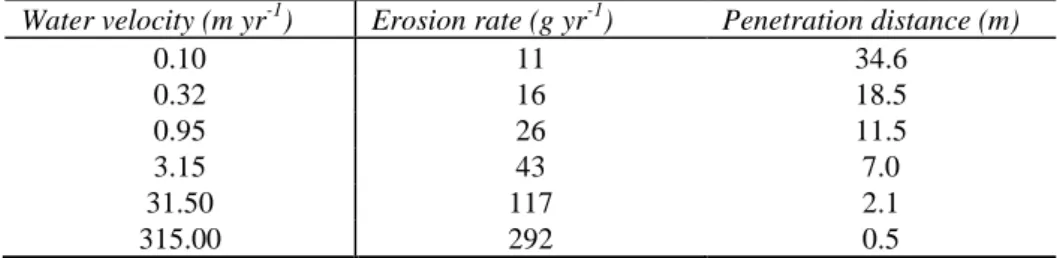
Model results are summarized in Table 2.1_1 (Neretnieks et al., 2009). As can be seen, the erosion rate increases, and the length of the fracture pene-trated by bentonite decreases, with increasing groundwater velocity. The
erosion rate is proportional to the water velocity raised to the power 0.41 (Neretnieks et al., 2009). The rate is also directly proportional to the fracture aperture. Note that the erosion rate and fracture penetration distance for the two lowest water velocities were extrapolated by Moreno et al. (2009) from model results for the four higher water velocities. This is because the nu-merical method became unstable when the velocity was less than about 0.95 m yr-1. Neretnieks et al. (2009) note that these results are preliminary and that the erosion rate for a given water velocity could be higher or lower than the values given in Table 2.1_1. This is because the effects of ion transport on the viscosity have not been adequately accounted for in systems contain-ing both Na+ and Ca2+ ions.
Table 2.1_1. Erosion rates and corresponding penetration distances of bentonite in fractures as calculated by Moreno et al. (2009) using the buffer erosion model (Neretnieks et al., 2009).
Water velocity (m yr-1) Erosion rate (g yr-1) Penetration distance (m)
0.10 11 34.6 0.32 16 18.5 0.95 26 11.5 3.15 43 7.0 31.50 117 2.1 315.00 292 0.5 2.1.1 Force-balance model
The expansion of the buffer from a deposition hole into an intersecting frac-ture will be controlled by a number of forces acting on the individual clay particles in bentonite. Neretnieks et al. (2009) developed a dynamic force-balance model of the expansion process. The model accounts for the gravity and buoyant force (Fg), forces resulting from changes in the chemical
poten-tial in a concentration gradient (diffusional force; Fμ), van der Waals
attrac-tive forces between clay particles (FvdW), repulsive forces between the
parti-cles resulting from charges within and on the surfaces of the partiparti-cles (dif-fuse double layer forces, FDDL), and friction forces (Fη) acting on the
parti-cles as they move through the aqueous phase as a result of imbalances among the other forces. Because changes in particle velocity are expected to be slow as the buffer expands into a fracture, acceleration can be neglected and the sum of the forces noted above must then always be equal to zero. Chemical aspects of the force-balance model are mainly incorporated in the attractive van der Waals and repulsive double-layer forces between individ-ual clay particles. These forces are considered further in Section 2.1.3. Ex-pressions for Fg, Fμ and Fη. are described by Liu et al. (2009) and Neretnieks et al. (2009). Liu et al. (2009) evaluated the force-balance model using
mag-netic resonance imaging (MRI) data characterizing the vertical expansion of a Na-montmorillonite pellet in a test tube filled with distilled water. Agree-ment between the MRI data and model predictions was good during the lat-ter stages of expansion (i.e., aflat-ter about 20 hours), but not initially. The
dis-agreement was attributed by Liu et al. (2009) to heterogeneous wetting of the initially dry pellet.
2.1.2 Viscosity model
Expansion of bentonite from a deposition hole into a fracture will result in changes in the bentonite density as a function of distance in the fracture. The density will vary from that of the buffer at the fracture/deposition hole inter-face to a value approaching the density of water at the point of maximum extension of the bentonite in the fracture. The changes in density will result in corresponding changes in the volume fraction, , of clay particles in the expanded bentonite. The changes in will in turn affect the viscosity. The expanded bentonite may flow as a fluid or semi-fluid phase when reaches a threshold value marking the transition from a gel to a sol.
The force-balance approach described in Section 2.1.1 (see also Section 2.1.3) can be used to predict changes in the density (and ) of bentonite ex-truded into a fracture from a deposition hole. A complementary viscosity model was developed by Moreno et al. (2009) (see also Neretnieks et al., 2009) to relate changes in to corresponding changes in the viscosity of bentonite gels/sols. Advective transport of the sols, along with the ground-water flowing in the fracture, can then be accounted for using the buffer erosion model (Neretnieks et al., 2009).
The viscosity model is based on the concept of a co-volume of a colloidal particle. The co-volume is defined as the volume over which a given particle can rotate freely without touching other particles in a colloidal suspension. It is determined both by the physical size of the particle as well as by interac-tions involving the particle‟s electrical double layer and those of its nearest neighbours (see Section 2.1.3). The co-volume thus depends on the physical volume fraction (i.e., ) and on properties of the colloidal suspension, such as the ionic composition of the aqueous phase, that control the effective thickness of the electrical double layer.
The co-volume fraction of a clay particle is given in the viscosity model by (Neretnieks et al., 2009):
where Vcov stands for the co-volume of a colloidal particle, which is assumed
to consist of stacks of individual clay sheets, Vp refers to the physical volume
of the particle, ls represents the lateral extent of the sheets, -1 denotes the
double-layer thickness (see Section 2.1.3), m is an adjustable parameter
rep-resenting a multiple of this thickness, s refers to the sheet thickness and n
represents the number of sheets in a stack. An empirical expression relating the co-volume fraction of clay particles to the relative viscosity of a gel/sol is given by (Neretnieks et al., 2009):
where refers to the viscosity of the suspension, w denotes the viscosity of
water and a, b, and c are coefficients. Neretnieks et al. (2009) regressed
Equation (2.1.2_2) using experimental data on relative viscosities and de-termined in clay colloidal systems over a range of different ionic strengths. The regression was found to be optimized when it assumed that ls = 220 nm
and m = 1, giving:
This empirical expression was used in the viscosity model to calculate the viscosity of bentonite gels and sols. The calculated values depend on the volume fraction of the colloidal particles in the gel/sol and on the ionic com-position of the aqueous phase. Given the empirical nature of Equation (2.1.2_3), it is not clear whether the viscosity model is appropriate for condi-tions that lie outside the range of clay composicondi-tions and solution composi-tions considered in the experimental dataset upon which the equation is based.
2.1.3 DLVO theory
Terms for the van der Waals force and diffuse double layer force in the force-balance model (Section 2.1.1) were derived by Liu et al. (2009) and Neretnieks et al. (2009) based on DLVO theory. Given its central impor-tance to the overall force-balance modelling approach, this theory is de-scribed in further detail here. Perceived limitations in the theory are summa-rized in Section 2.1.4. Section 2.2 considers applications of DLVO theory in interpretations of the formation and stability of clay colloids.
2.1.3.1 Electrical conditions at the clay-water interface
DLVO is an acronym derived from the surnames of researchers that devel-oped this theory of colloid stability (Derjaguin and Landau, 1941; Verwey and Overbeek, 1948). The theory is based on electrical properties of the col-loid-water interfacial region and on interaction energies that come into play when two charged colloidal particles approach one another. Kruyt (1952), Adamson (1967), van Olphen (1977), Sposito (1984), Stumm and Morgan (1996) and Evans and Wennerström (1999) provide detailed descriptions of the DLVO model and its application to idealized systems and clay-water systems.
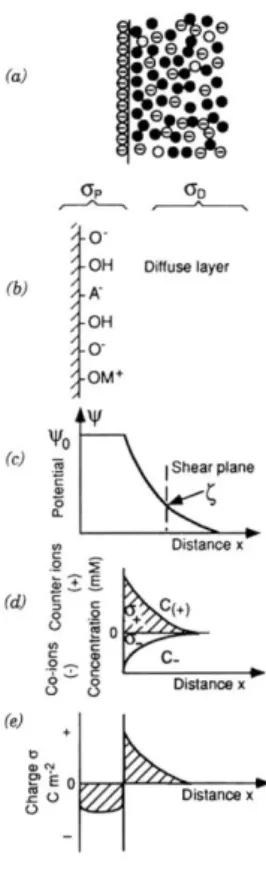
The electrostatic forces considered in the DLVO conceptual model arise from electrical interactions at the solid-liquid interface (Figure 2.1.3.1_1).
For clay colloids a net electrical charge on the particles arises from several sources that can be represented by (Stumm and Morgan, 1996):
p = o + H + is + os (2.1.3.1_1)
where p stands for the net particle charge, o denotes the permanent
struc-tural charge resulting from isomorphous substitutions on tetrahedral and octahedral sites in the clay‟s crystalline lattice, H refers to the net proton
charge resulting from proton-exchange reactions involving ionizable surface hydroxyl groups (represented by S-OH, where S includes Si, Al, etc.), is
stands for an inner-sphere complex charge and os represents an outer-sphere
complex charge (all charges have units of C m-2). The latter two charges represent contributions to the net particle charge resulting from the specific adsorption of cations and anions by surface hydroxyl groups.
Figure 2.1.3.1_1. The diffuse double layer (after Stumm and Morgan, 1996). The diffuseness of the double layer results from thermal motions in the aqueous phase (a). Binding of H+, O2-, cations (M2+) and anions (A-) can occur on surface sites at the solid-water interface (b). The elec-trical potential () decreases with increasing distance outward into the diffuse layer from the surface, where the potential is o (c). The zeta potential () is the potential at the shear plane of a moving particle. Variations in the charge distribution of cations and anions are shown in (d), and (e) shows the corresponding net excess charge.
The existence of charged colloidal particles in an aqueous electrolyte solu-tion creates an electrical double layer of charge (Figure 2.1.3.1_1a, b). One layer corresponds to charges on the particle‟s surface, as discussed above, and the other is a compensating net charge that is spread out in a diffuse layer extending outward into the aqueous phase. Electrical neutrality in this interfacial region requires that
p + d = 0, (2.1.3.1_2)
where d refers to the total net charge in the diffuse layer.
The Gouy-Chapman model of the electrical double layer (e.g., Adamson, 1967) establishes a simple relation between particle charge and electrical potential at the particle‟s surface. This model assumes that the particle‟s surface is a uniform infinite plane of charge and that aqueous ions exist as point charges in a uniform medium characterized by the dielectric constant. For a charge-symmetric electrolyte under such conditions, the relation be-tween surface charge and surface potential (o; in V) is given by (e.g.,
Stumm and Morgan, 1996):
T
k
ze
T
k
n
B B s2
sin h
)
8
(
1/2 o o p
, (2.1.3.1_3)where denotes the relative dielectric constant of water (78.5 at 25C), o
represents the electric permittivity of free space (8.854 x 10⁻¹² C V-1 m-1), ns
stands for the number concentration of ion pairs (cm-3), kB refers to the
Boltzmann constant (1.3805 x 10⁻²³ J K-1), T denotes temperature (K), z represents ionic valence, and e stands for the elementary charge (1.60219 x 10⁻¹⁹ C). At 25C, Equation (2.1.3.1_3) becomes:
T
k
ze
c
B s2
sin h
1 1 7 4
.
0
1/2 o p
(2.1.3.1_4)where cs refers to electrolyte concentration (M). Note that if o << 25 mV at
25C, o 2 / 1 p 2.5
I (2.1.3.1_5)The potential decreases with increasing distance, x, outward from the surface into the diffuse layer. The potential at any point in the diffuse layer can be calculated using:
)
(
sinh
2 2 2T
k
ze
T
k
ze
dx
d
B B
, (2.1.3.1_6)where represents the reciprocal thickness of the double layer given by:
2 / 1 o 2 2
T k z n e B i i i
, (2.1.3.1_7)and where ni stands for the number concentration (cm
-3
) of ions with valence
zi. A simplified version of Equation (2.1.3.1_6) that is valid when << 25
mV is given by:
,
2 2 2
dx
d
(2.1.3.1_8) in which case, ) ( o x e
(2.1.3.1_9)and the potential thus decays exponentially at a rate that increases with de-creasing thickness of the double layer (i.e., with inde-creasing values of ). Once the spatial distribution of electrical potentials in the diffuse layer is known, corresponding ionic concentrations can be calculated using the Boltzmann equation for cations and anions (e.g., Adamson, 1967):
,
) / ( ze k T o Be
n
n
and (2.1.3.1_10) ) / (ze kT o B e n n , (2.1.3.1_11)where n+ and n- represent local concentrations (mol cm -3
) of cations and ani-ons in the diffuse layer, respectively, and no stands for ion concentrations in
the bulk solution (i.e., where n+ = n- in accordance with charge-balance
con-straints). These local concentrations are important because, as discussed in the following section, they affect repulsive forces resulting from the interac-tions of double layers when two colloidal particles approach one another. 2.1.3.2 Interaction energies among colloidal particles
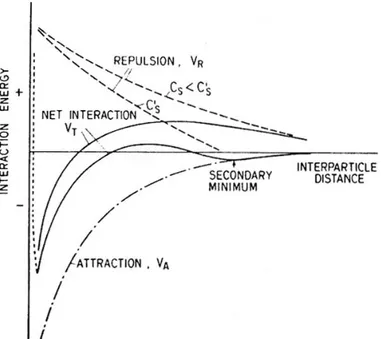
DLVO theory assumes that the stability of an aqueous colloidal system is controlled by a balance between electrostatic forces, which tend to repel particles of like charge, and attractive forces arising from van der Waals interactions. The concept is illustrated in Figure 2.1.3.2_1, which depicts changes in the total interaction energy, VT, as two colloidal particles
ap-proach one another due to thermally driven Brownian motion. The net inter-action energy, VT, represents the sum of electrostatic double-layer repulsion
(VR) and van der Waals attraction (VA) energies,
VT = VR + VA. (2.1.3.2_1)
At very small inter-particle distances, an additional repulsive force, indicated by the dotted line in Figure 2.1.3.2_1, arises due to the interaction of atomic electronic clouds (Born repulsion). Colloids are stable when VT > 0 and
un-stable when VT < 0.
Figure 2.1.3.2_1. Schematic diagram illustrating the relation between interaction energies and separation distances between colloidal particles (Stumm and Morgan, 1996).
2.1.3.3 Colloids as parallel flat plates
Exact solutions to Equation (2.1.3.2_1) can be obtained for idealized systems in which colloidal particles exist as parallel flat plates or sheets. Argillaceous materials containing roughly parallel layers of clay minerals separated by an interlayer region containing variable amounts of an electrolyte solution closely approximate such systems.
Kruyt (1952) derived a solution for the repulsive term in Equation (2.1.3.2_1) for such systems (Figure 2.1.3.3_1). The total force acting on the plates was assumed to consist of an osmotic pressure force and a force aris-ing from the electrical field. The latter force equals zero at the mid-plane (m) between the plates (i.e., at x = d/2 in Figure 2.1.3.3_1) because d/dx = 0 at that location. The total force is thus given by the osmotic pressure at the mid-plane position.
Figure 2.1.3.3_1. Interacting double layers between the surfaces of two colloidal particles represented by parallel flat sheets (Adamson, 1967). Potentials in the double layer adjacent to each sheet are shown as a function of distance from the surface, d, by the dashed lines. The solid line represents the total potential resulting from the interacting double layers.
The osmotic pressure, p, is given by (Kruyt, 1952):
T
k
n
e
e
n
T
k
n
p
p
p
k T B ze T k ze B excess o m B m B m
o o2
(2.1.3.3_1)where pm and po refer to pressures at the mid-plane and in the bulk aqueous
phase, respectively, and nexcess stands for the excess concentration of cations
and anions at m relative to their concentrations in the bulk solution. The ex-pression on the right-hand side of the second identity in Equation (2.1.3.3_1) is obtained using Equations (2.1.3.1_10) and (2.1.3.1_11), and m refers to
the mid-plane potential. Rearrangement of Equation (2.1.3.3_1) yields (Kruyt, 1952): ] 1 ) / [cosh( 2 o p n kBT zem kBT . (2.1.3.3_2)
This osmotic pressure represents the force per unit area causing colloidal particles to separate as a consequence of interactions involving their electri-cal double layers. Equation (2.1.3.3_2) represents the diffusive double layer force in the force-balance model developed by Neretnieks et al. (2009). Integration of Equation (2.1.3.3_2) to obtain the total repulsive energy, VR,
in Equation (2.1.3.2_1) can be difficult because generally varies as a com-plex function of distance between the colloidal particles. Kruyt (1952) noted, however, that for the case of relatively weak interactions between the parti-cles (e.g., when m << 1 V), the following relation can be used:
m B m e T k ze
8 , (2.1.3.3_3) where,)
1
(
)
1
(
T k ze T k ze B o B oe
e
, (2.1.3.3_4)and where m = d/2, with d representing the separation distance between the particles as shown in Figure 2.1.3.3_1.
Equation (2.1.3.3_3) can be used in a first approximation4 to Equation (2.1.3.3_2) to obtain: 2 o
(
8
)
km BT
e
k
n
p
, (2.1.3.3_5)which can then be integrated from x = (bulk solution) to x = m to yield (Kruyt 1952): m B m x x
e
T
k
n
pdx
o 2 2 R64
2
V
. (2.1.3.3_6)Equation (2.1.3.3_6) gives the total repulsive energy per unit area between colloidal particles for an idealized case in which the particles are represented by parallel flat plates.
DLVO theory attributes the attractive term, VA, in Equation (2.1.3.2_1) to
van-der Waals-London dispersion forces. These forces can be calculated in principle using Lifshitz theory (Lifshitz, 1956), which accounts for the mac-roscopic electrodynamic properties of the interacting media. In practice, however, relatively simple expressions for VA are usually derived using an
alternative approach developed by Hamaker (1937). In this approach the attraction energy between two bodies is calculated as the sum of London dispersion interactions among all pairs of atoms in the two bodies. The ap-proach is valid as long as separations between the bodies do not apap-proach atomic dimensions.
Using Hamaker‟s approach, VA for two colloidal particles represented by
parallel flat sheets can be calculated using (e.g., Kruyt, 1952):
2 A 48 V m A
, (2.1.3.3_7)where A denotes the Hamaker constant (J) and m, as noted earlier, stands for the mid-plane position5. Values for the Hamaker constant are difficult to determine experimentally. For clay colloids, A 10-20 J appears to be a rea-sonable first approximation (e.g., Lyklema, 1991; Swanton, 1995; Helmy, 1998).
Substituting Equations (2.1.3.3_6) and (2.1.3.3_7) into Equation (2.1.3.2_1) results in: 2 2 2 o T
48
A
64
V
m
e
T
k
n
B m
, (2.1.3.3_8)which gives the net total interaction energy between sheet-like colloidal par-ticles as they approach one another. As is illustrated schematically in Figure 2.1.3.2_1, the net interactions are repulsive at relatively large particle separa-tions, but become attractive when the particles reach a threshold separation that depends on the aqueous electrolyte concentration. The relation between this threshold distance and the critical coagulation concentration (CCC) of aqueous ionic species is considered further in the following section.
5 A slightly more complicated form of Equation (2.1.3.3_7), which takes into account the thickness of
2.1.3.4 Effects of aqueous chemistry on colloid stability
The effects of electrolyte concentration on colloid stability are illustrated in Figure 2.1.3.2_1 by the two dashed curves showing variations in VR as a
function of inter-particle distance, and corresponding solid curves for VT, the
total interaction energy. Electrolyte concentration Cs is assumed to be
smaller than C*s, and the diagram therefore indicates that colloidal
suspen-sions (of planar geometry) are stable (i.e., VT > 0) over a broader range of
inter-particle distances as the aqueous medium becomes more and more di-lute. The secondary minimum in VT when the electrolyte concentration
equals C*s results in the formation of an attractive gel, which may re-disperse
as a sol by stirring.
Separation distances among the particles in an aqueous colloidal suspension depend on the ionic strength of the medium because this parameter deter-mines the rate at which the electrical potential decays with increasing dis-tance outward from the surface into the double layer6. As noted in Section 2.1.3.1, the thickness of the double layer is generally taken as being equal to the reciprocal of the (Debye) parameter, , which is recast here as:
2 / 1 0 3 2
10
x
2
RT
I
F
, (2.1.3.4_1)where F refers to the Faraday constant, I represents ionic strength, given by
i i ic z I 1/2 2 , (2.1.3.4_2)and R stands for the gas constant and ci stands for molar concentration. This
equation indicates that the thickness of the double layer decreases as ionic strength increases, and this allows the individual particles in a colloidal sus-pension to move closer together. The particles will eventually form an attrac-tive gel or floc if the double-layer thickness falls below a value correspond-ing to a threshold separation distance at which VT first becomes negative.
Conversely, stable colloids may form from a gel or floc if the ionic strength decreases to a point where VT becomes positive. Chemical erosion of the
buffer is thus more likely in situations where the buffer comes into contact with groundwaters that are relatively dilute.
The concept of a critical coagulation concentration (CCC), discussed in Sec-tion 1.1 can be related to composiSec-tional constraints on the aqueous phase that come into play when the threshold separation distance between colloidal particles is reached (i.e., when VT = 0). Considering the idealized case of
colloids as parallel flat plates, for example, Equation (2.1.3.3_8) indicates that under such conditions
2 2 2 o
4 8
A
6 4
m
e
T
k
n
B m
. (2.1.3.4_3)Kruyt (1952) rearranged this equation to give at 25C
6 2 4 2 2 10 x 8 z A c
, (2.1.3.4_4)where c represents electrolyte concentration (mM) and where it is assumed that surface potentials in the expression for (Equation 2.1.3.3_4 ) are suffi-ciently high that 1 and is independent of valency. The electrolyte concen-tration, c, is taken to be a critical coagulation concentration at, and below, which attractive forces between colloidal particles dominate, leading to the formation of attractive gels or flocs.
Equation (2.1.3.4_4) indicates that the CCC should vary according to an inverse 6-th power dependence on electrolyte valence, which is in reasona-bly good agreement with many empirical observations and is known as the rule of Schulze and Hardy (e.g., Stumm and Morgan, 1996). When extended to systems in which the surface potential is low and 1, the Schulze-Hardy rule invokes a (1/z)2 dependence on valence (Kruyt, 1952). In either case, for negatively charged colloids such as clays, the CCC for cations tends to de-crease strongly in the order monovalent > divalent > trivalent. Thus, al-though monovalent cations such as Na+ or K+ tend to be more abundant in natural waters than divalent cations, such as Ca2+ or Mg2+, the latter type of cations are expected to more strongly influence colloid stability than the former type in accordance with the Schulze-Hardy rule. It is important to emphasize, however, that this rule applies only to supporting electrolytes that are “indifferent” in the sense that they do not react with other ions in the double layer and are not specifically adsorbed at the colloid‟s surface. Triva-lent cations, such as Al3+ and Fe3+, generally have very low concentrations in natural waters due to solubility constraints and because of hydrolysis and other complexation reactions, and may not behave like indifferent electro-lytes with respect to clay minerals.
2.1.4 Limitations in DLVO theory
There is a general consensus that the conceptual basis of DLVO theory is substantially correct, but that the theory is also deficient in some important respects (e.g., Kruyt, 1952; Swanton, 1995; Stumm and Morgan, 1996; Mis-sana and Adell, 2000; Boström et al., 2001; McBride and Baveye, 2002). Support for this view comes from studies involving direct force-balance measurements (see Iraelachvili and Adams, 1978; Israelachvili, 1991) of
adhesive and repulsive interactions among colloidal particles (see Swanton, 1995). These studies suggest that the treatment of van der Waals interactions in the DLVO model is generally valid as long as separation distances be-tween colloidal particles are greater than atomic dimensions. The treatment of electrical double-layer interactions (Section 2.1.3) also appears to be valid, although important discrepancies between model predictions and ex-perimental observations have been noted in some systems, especially those with divalent electrolytes (e.g., see Section 2.1.4.1).
Limitations in DLVO theory arise for two general reasons: 1) oversimplifi-cation of the properties of real colloids, and 2) omission of “non-DLVO” forces that can be important under certain circumstances. These limitations can be categorized as follows (Swanton, 1995):
The theory treats colloidal particles as if they were smooth bodies having ideal geometries. Real colloids are irregular in size and shape, however, and have rough surfaces. Surface roughness can af-fect both the attractive van der Waals interactions as well as repul-sive double-layer forces.
Surface charge/potential is assumed to be uniformly distributed. Charges are discrete by nature, however, and electrical properties of colloidal particles therefore vary on a microscopic scale. Such het-erogeneous distributions of surface charge/potential could affect the magnitude of repulsive double-layer interactions.
DLVO theory does not consider interactions involving the solvent, which is treated as a continuous homogeneous medium character-ized by a single value of the dielectric constant. Such interactions could arise, however, if the solvent is polar [as is H2O(l)]. For
aque-ous systems, these interactions may include hydrogen bonding, hy-drogen donor/acceptor reactions, hydration and steric interactions. The result of such interactions is a re-structuring of water in layers adjacent to the solid‟s surface.
Ions in the diffuse layer are assumed to be point charges, i.e., the sizes of the ions are ignored. This assumption is not valid when the separation distance between colloidal particles is small and the sur-face potential is high. Under such conditions, the numbers of ions in the diffuse layer calculated using DLVO theory are far too large. Repulsive and attractive forces between colloidal particles are
as-sumed not to vary with time. In reality, however, the total interaction energy between particles may fluctuate due to a redistribution of charge in the double layer or solid by diffusive or conductive mechanisms, or during particle rotations as a result of irregular par-ticle shape and/or heterogeneities in surface charge.
Swanton (1995) and Jansson (2007) describe efforts to deal with these limi-tations. These efforts have resulted in the formulation of various “extended” DLVO models. The extended models provide more accurate descriptions of
colloidal systems, but come at the expense of an increased number of model parameters that must be characterized experimentally.
There are additional limitations in DLVO theory when it is applied specifi-cally to colloidal systems of clay minerals (Stumm and Morgan, 1996; Liu and Neretnieks, 2006). One limitation stems from the fact that these minerals carry a net negative charge on faces oriented parallel to the dominant tetra-hedral-octahedral-tetrahedral layering, and, depending on pH, net positive or negative charges on edges that are oriented normal to this layering (e.g., Grim, 1968; see Section 2.2). This means that a given clay particle can have different double-layer structures associated with its faces and edges. Particle-particle interactions in clay colloidal systems may consequently involve face-to-face (FF), edge-to-face (EF) and edge-to-edge (EE) interactions. Because the EF interactions involve particle surfaces of unlike charge, parti-cle agglomeration may occur even in dilute electrolyte solutions. The DLVO model does not account for such interactions, and may thus overestimate the stability of clay colloids.
The DLVO model also does not account for the effects of specific adsorption on colloid stability (Boström et al., 2001). The model assumes only that the electrolytes in a colloidal suspension are inert, and that their effect on colloid stability is through the control on double-layer thickness represented by the reciprocal of the Debye parameter, (Section 3.3). Other electrolytes in clay colloidal systems may form covalent complexes with functional groups at the particle‟s surface, however (e.g., Langmuir, 1997). Such complexes alter the surface charge and surface potential, and thereby affect colloid stability. H+ and OH- are important potential-determining ions because they react with the surface sites of clay minerals. The colloidal stability of these minerals is thus pH-dependent, but this dependency is not accounted for in DLVO mod-els (Missana and Adell, 2000).
2.1.4.1 Effects of clay composition on stability relations among sols, gels and flocs
Kjellander et al. (1988) used a statistical mechanical approach to evaluate double-layer interactions involving clay minerals. Counter to expectations based on DLVO theory, the interaction energy between like-charged clay surfaces was found to be strongly attractive at relatively small inter-particle separation distances if the counterions in the diffuse layer were divalent and if the surface-charge density was large (as is true generally for smectites, including montmorillonites).
This additional attractive force was attributed by Kjellander et al. (1988) to ion-ion correlations (see also Janiak et al., 2008; Pegado et al., 2008). The correlations involve repulsive interactions among ions of like charge, which in effect create a “hole” of charge depletion around each ion. The charge-depletion region around an ion can be regarded as a charge-accumulation region of opposite sign. The interaction of an ion on one side of the mid-plane between two colloidal particles (e.g., at d/2 in Figure 2.1.3.3_1) with an ion and part of a charge-depletion hole on the other side of the mid-plane creates an attractive force between the particles that is not accounted for in
classical DLVO theory. This attractive force, together with the van der Waals force, is not large enough to counteract the repulsive force between two clay particles when the counterions are monovalent, but can counteract this repulsive force when the counterions are divalent and the surface-charge density is high.
The attractive force due to ion-ion correlations is apparently important for montmorillonites having exchangeable Ca/Na molar ratios greater than about 90/10 (e.g., Birgersson et al., 2009). In such cases the attractive force is suf-ficiently strong that the minerals cannot expand to form gels or sols. On the other hand, montmorillonites having Ca/Na < 90/10 can form gels or sols depending on whether counterion concentrations exceed the CCC. This is important from the viewpoint of buffer erosion because it suggests that buffer materials composed of essentially pure Ca-montmorillonites would be much more resistant, if not completely impervious, to the effects of chemical erosion than buffer materials composed of mixed Na/Ca-montmorillonites having Ca/Na < 90/10 (e.g., MX-80).
2.2 Clay colloid formation and stability
2.2.1 Structure of clays
Clays have a layered structure based on a 2-dimensional covalent network of tetrahedral SiO4 units, Al units of varying coordination and sometimes also
divalent cations. For most clay minerals, these layers, with a thickness around 1nm, carry a net negative charge. In a water-free system, the negative charge is compensated by cations in the space between the layers as illus-trated in Figure 2.2.1_1.
Figure 2.2.1_1: The structure of montmorillonite containing a two-dimensional covalent network of Si, Al and O forming layers approxi-mately 1nm thick and which are separated by cationic counterions and possibly water (SKB, 2006b).
When exposed to water, or an electrolyte solution, a swelling of the layers can occur and, in the extreme case, the swelling into excess water results in separated layers. In practice, the layers have a finite size in the lateral direc-tion and the highly swollen system is a stable soludirec-tion of flake-like colloidal particles. The layer thickness is approximately 1 nm, while the lateral
exten-sion of the layers depends on the history of the particular clay system. In addition, the chemical nature of the edges is not well-defined and can vary from clay to clay, even if their nominal compositions are the same.
In the dispersed state, the clay particles have a negative charge, which is compensated by counterions in the electrical double layer. Typical charge densities on the flat surfaces of montmorillonite are in the range 0.10 to 0.15 C m-2. This is a rather high charge density compared to other colloidal sys-tems, and approximately corresponds to one elementary charge, per 100 to 150 Å2. On the edges the charge is more variable, but it can be positive at neutral pH. The edge charge appears to be pH sensitive around neutral pH, while the charge density on the flat surfaces only appears to titrate at lower pH (Wieland, et al., 1994; Evans and Wennerström, 1999). However, one should be aware of the fact that a dilution by pure water changes the titration equilibrium such that a protonation of the surfaces can occur at lower pH-values.
Montmorillonite clays, and other swelling clays, can be viewed as occurring in three different forms depending on conditions. If water availability is lim-ited, either physically or chemically, the original clay mineral swells to a state with a finite distance between layers. Sheets are basically parallel and with a uniform spacing between layers. A typical sample has a polycrystal-line character with domains of ordered packed layers of different orientation meeting in defect zones. In the other extreme, where water is plentiful, the system swells to high dilution with individual, essentially uncorrelated, par-ticles. When such a system is exposed to higher concentrations of electro-lyte, an aggregation can occur that leads to the formation of a disordered network of contacting particles. In comparison to the layered structures, such networks occupy a larger volume per dry weight of clay.
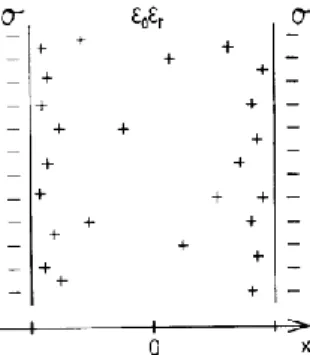
2.2.2 Electrostatic interactions
The simplest model relevant for clay systems is one of uniformly charged surfaces separated by a solvent layer containing only neutralizing counteri-ons. In the so-called primitive model, the solvent (water) is represented as a medium with a dielectric permittivity representing the properties of the pure solvent. Ions are considered spherical with a hard-core radius. Figure 2.2.2_1 gives an illustration of the model. The model can easily be extended to in-clude an electrolyte with either a specified concentration or a case where the electrolyte concentration is determined by an equilibrium with a bulk solu-tion of specified (bulk) concentrasolu-tion.