Teknik och samhälle
Datavetenskap och medieteknik
Examensarbete
15 högskolepoäng, grundnivåDigital learning tools – Designing and integrating digital
learning tools for mathematics in school
Digitala läromedel – Design och integration av digitala läromedel för
matematik i skolan
Christopher Lindberg
Examen: kandidatexamen 180 hp Huvudområde: datavetenskap Program: Informationsarkitekt
Handledare: Dipak Surie Examinator: Mia Persson
Abstract
Traditional education has looked the same for a very long time - until recently. Digital learning tools - DLTs - have been developed and tested in numerous educational environments around the world, specifically for the science subjects. This project was about how DLTs for mathematics should be
developed in order to provide an as complete learning experience as possible. Earlier research has shown the importance of teacher training, as well as the fact that better learning outcomes are achieved when DLTs are used as a supplement to traditional education rather than a substitute. The conclusion in this research is that DLTs still have to be used as a supplement, that the teachers role is of very high importance, and that DLTs have to be able to adapt to individual users with specific needs.
Sammanfattning
Traditionell undervisning har fungerat på ett visst sätt i väldigt lång tid - tills nyligen. Digitala läromedel - DLTs (Digital Learning Tools) - har utvecklats och testats i en stor mängd skolor i hela världen, speciellt för ämnena inom
naturvetenskap. Detta projektet handlar om hur DLTs för matematik bör bli utvecklade för att tillhandahålla ett så komplett lärande som möjligt. Tidigare forskning har visat vikten av att träna lärarna hur de ska använda DLTs i undervisningen samt att DLTs ger bättre resultat när de används som ett komplement till den vanliga undervisningen istället för att ersätta moment i den. Slutsatsen i detta arbete är att DLTs fortfarande ska användas som komplement, att lärares roll är väldigt viktig och att DLTs måste kunna anpassa sig till individer med olika behov.
Table of content
Abstract 2 Sammanfattning 3 Table of content 4 1. Introduction 6 1.1 Background 61.2 Problems with traditional education 6
1.3 Why mathematics? 7
1.4 The purpose of this research 8
1.5 Scope for this research 8
1.5.1 Area of research 8 1.5.2 Research methods 9 1.6 Target audience 9 1.7 Research questions 9 2. Methods 11 2.1 Online survey 11
2.1.1 Target audience for the online survey 11
2.1.2 Designing the survey for students 11
2.1.2.1 Demographics 12
2.1.2.2 Questions about DLTs 13
2.1.3 Designing the survey for teachers 13
2.1.3.1 Demographics 14
2.1.3.2 Questions about DLTs 14
2.1.4 Finding schools for the surveys 15
2.1.5 Sampling schools 16
2.2 Literature review 16
3. Results 18
3.1 Online survey 18
3.1.1 Questionnaire for students 18
3.1.2 Questionnaire for teachers 21
3.2 Literature review 25
4. Analysis 26
4.1 Analysis of data gathered from the online survey 26
4.1.1 Analysing data from students 26
4.1.1.1 Manual analysis 26
4.1.1.2 Statistical analysis with SPSS 27
4.1.2 Analysing data from teachers 30
5. Discussion 32 6. Conclusions 34 6.1 Further research 35 7. Acknowledgements 36 8. References 37 9. Appendix 39 9.1 Questionnaires 39
9.1.1 Pilot study for students 39
9.1.2 Pilot study for teachers 45
9.1.3 Students 54 9.1.4 Teachers 58
1. Introduction
This project is about digital learning tools. In the text these will be referred to as DLTs.
1.1 Background
From the late 20th century there has been an explosion in the amount of technical devices and services that people are using. The level of complexity of these has increased enormously and has in a very short time become an integral part of our everyday life. In the modern world we use technology for pretty much everything, and there is no sign that this rapid evolution is going to slow down anytime soon [16].
It is easy to see in what areas technology has become more and more
pervasive and an integral part of people’s everyday life [4]. One example of this is smartphones, which nowaday have apps for pretty much everything. People in turn use their smartphone and other technology for more things and rely on them to a bigger extent than before [4].
It is easy to believe that technology is being used to the same extent in every sector and area of our societies, but this is not true. Judging by how much the complexity of software programs and hardware has increased just the past couple of decades, and how tech giants have developed services that seem to now be such a natural part of our everyday life, one might believe that we would also have seen a similar technological revolution in education. In recent years platforms like MOOC and Coursera have been created [17]. The aim with these is to provide higher education to anyone [18], [19]. These types of
platforms are accessible through their websites and are designed from the ground up to be used as an alternative to traditional education, and not be used as a supplement or substitute for it [17] - [19]. The type of DLTs that this paper is about is the type that is used in a classroom where a teacher is
available, and the technological development for this type of DLT is far behind the technological development in other domains [17].
I have made the assumption that it is possible to create digital learning tools that are as advanced as the technology that exists in other sectors. I also believe that if this technology is developed, it will have a significant positive effect on students’ school results in mathematics, and maybe more
importantly, their understanding of mathematics.
1.2 Problems with traditional education
Traditional education is good in many ways. Although people might disagree on the details about what the purpose of schooling is and has been, most can
fundamental skills like reading and writing as well as getting a basic understanding of common subjects. This is because governments want
students to provide to the economy and to society when they start working, as well as give every student equal opportunities in life [20].
However, traditional education is not perfect. In a typical school setting there might be one teacher for 15+ students [21]. The teacher has to do lectures that suit one class as a unit, not 20 individuals. This is problematic because not every student learns at the same pace or in the same way. Some will think that the teacher is going too fast while others think the teacher is going too slow. Some will think that the teacher explains in a way that is easy to
understand while others can’t comprehend a teachers way of thinking about a certain subject. A particular way of lecturing might be suitable for most
students, but most likely not for everyone. And this is not a problem that teachers can do much about with the limited resources they have.
Another aspect of learning is the activity students do when learning a new subject. In the case of mathematics it is common to mainly just do a series of exercises. The same procedure is repeated by every student. But the fact is that some students don’t learn as much by doing countless repetitions, but instead get to experiment with a concept in a different way [12]. In this scenario it would be hard for the teacher to meet these student’s needs.
The root problem here is that the core source of information in schools are the teachers, and compared to technology, teachers are not a resource that can be scaled indefinitely. There is a finite amount of teachers, and each teacher has a finite amount of time with each class. The solution to the problems
mentioned above has to be something that can meet each student where they are and provide the exact resources they need in a manner that is suitable for them. The solution, whatever it is, would have to understand and interact with each student at a level that simply cannot happen in a regular school class. The solution would have to have some ability to some degree understand students’ current needs, and it would have to be scalable so that every student can benefit from it. This is where I think digital learning tools can be the
solution.
1.3 Why mathematics?
Mathematics is often perceived to be a rather abstract subject compared to subjects like geography and history. Concepts in mathematics are not tangible in the same way content found in other subjects might be. This can make mathematics hard to understand [22].
At first glance one might think that having a solid understanding is not necessary for everybody; some people think that only those who are going to use math in their careers need to know it well and that it is not that important
for everybody else. However, having a solid understanding of the basics of mathematics is becoming more and more important in our everyday life for many reasons, some of which are [23]:
● A lot of choices we have to make involve numbers, like managing our finances.
● Information in the news often contains statistics that readers are expected to be able to understand.
● The principles of mathematics can be used to make calculated and educated choices about many things.
The reality is that mathematics is a subject that students are struggling with more than most subjects in most countries. It is not uncommon for students at the age of 15 to be unable to interpret basic mathematical concepts that they are expected to know; like percent [14]. This lack of understanding has negative effects on their life.
1.4 The purpose of this research
The purpose of this research is to investigate what features DLTs would have to have in order to help students increase their understanding of
mathematics.
1.5 Scope for this research
1.5.1 Area of research
There are many important aspects that should be considered when creating DLTs for schools. The list below mentions a few:
● How the user interface should be designed. ● How the user interaction should be designed.
● What type of content is suitable for DLTs, and what type content is not suitable.
● The psychology of learning.
● Social implications of using DLTs in education. ● How to integrate the DLTs with different courses.
● How to make sure that the content of a DLT maps well to a given curriculum.
A decision had to be made about how many aspects this research should be about. The benefit of including many aspects is that a more holistic and balanced research could be conducted. The downside is that less time and resources can be allocated for each aspect, which in turn means that it would be hard to go deep within individual aspects.
Some research aspects are about low level details, like how the user interface should be designed, whereas other aspects are very high level, like how to make sure the content of a DLT maps well to a curriculum. In this project it was decided that the most effort would be somewhere in the middle. Not a lot of focus would be on little details of the implementation of DLTs, and neither would a lot of focus be on high level aspects like mapping content to a
curriculum. The research was instead focused on finding what other people have found to be effective and important when designing DLTs.
1.5.2 Research methods
This section describes the limitations of the research methods chosen in this project and also explains why no other research method was used. A detailed explanation of the methods used in this research can be found in section 2.
Since a lot of research has already been done on the subject of DLTs a literature review had to be done. A survey was conducted in order to gather students’ and teachers’ opinions and attitudes about DLTs. A literature review combined with online surveys gave a solid understanding of the subject, as well as insights into what the target audience were thinking about the subject.
In a research project like this where the end goal is to provide value and increase the performance for the target audience it would make sense to build functioning software or prototypes to validate that the proposed design
improves the situation. However, if a meaningful piece of software was to be built that included most features of the suggested design, then this would take too much time from the actual research in this project. And if only small
mockups or wireframes were built they would not be able to test the full proposed solution, but rather just small features of it. Because of this it was decided to not create any software in this project.
1.6 Target audience
The target audience for the DLTs in this project is students and teachers in grade 1-12. Students are of interest because they are the ones that are
ultimately going to use the DLT. Teachers that are teaching students in grade 1-12 are also of interest since they are probably going to play a key role in education for a very long time, even when sophisticated DLTs have been introduced on a large scale.
1.7 Research questions
Based on the problems described in section 1.2, and the intentions with this research that was described in section 1.3, the following research questions were formulated:
1. How should digital learning tools be designed in order to as effectively and efficiently as possible teach mathematics to students?
2. How should digital learning tools be integrated into ordinary education to yield the best possible results?
2. Methods
The research strategy for this project was to combine a literature review with surveys. The literature review was conducted throughout the entire project with the exception of the final stage which was only used to put together the report. The surveys were conducted in the beginning of the second half of the project. Each method is described below.
2.1 Online survey
An online survey was conducted to gather data about what opinions the target group was having about DLTs. The survey had two questionnaires. One was for teachers and the other was for students. The goal with this survey was to find answers to the research questions, as well as providing a direction for further literature review.
2.1.1 Target audience for the online survey
The questionnaires were sent out to students and teachers in schools in
Malmo, Sweden. There were a few reasons for only targeting schools in Malmo: This project was done at Malmo University, and the assumption was made that schools are more willing to participate in a project that is local. Another reason is that the amount of data gathered has to be manageable. I also think it is a fair assumption to say that schools in Malmo don’t differ from other schools in Sweden in a way that would skew the data.
The students that were of interest for the online survey were in the grades 4-12, and the teachers of interest were those who were teaching mathematics in the grades 0-12. In Sweden the grades 0, 1-3, 4-6, 7-9 and 10-12
correspond to preschool, lower elementary school, middle elementary school, upper elementary school and highschool. The reason for not including
children in preschool and lower elementary school is that these students maybe would not be able to understand the questionnaire on their own.
2.1.2 Designing the survey for students
This section describes what questions were included in the questionnaire for the students as well as the motivation for including them. The full
questionnaire can be found in section 9.1.3 the appendix. Note that these are written in swedish since the participants speak swedish as their main
language.
The questions can be split into two categories; demographics and questions about DLTs. All questions except the final one were mandatory.
As mentioned in section 2.2.2 the grade for students answering the survey would vary a lot. Students in grade 4 in Sweden are generally 10-11 years old
while students in grade 12 generally are 18-19 years old. This large difference in age means that the reading ability of participants would vary greatly, which had to be considered when designing the survey.
One approach was to keep the survey short and the language as simple as possible so that every student could understand the questions. The best case would be if students could understand everything without getting support from teachers. The reason for not having students depend on teachers’ help is that teachers could intentionally or unintentionally influence the students’ choices [2]. Another advantage of using this approach is that the response rate could be higher compared to if the survey was longer and contained more complex questions.
One possible disadvantage of using the same survey for all students is that some stones could be left unturned with older students; it would be possible to ask them more complex questions than it would with students that are 10 years old. A possible solution to this problem could be to create separate questionnaires for students in upper elementary school and / or high school in order to get richer data. But this too has disadvantages. The data from the different surveys wouldn’t be as comparable, if at all. Even if one survey just extends another and adds a couple of questions it wouldn’t be possible to guarantee that the overall structure of the survey does not have an effect on students’ answers to the shared questions.
Weighing the pros and cons of each strategy it was decided to use the same survey for all students.
2.1.2.1 Demographics
I wanted to know if different groups of students have different opinions about DLTs. Therefore questions for demographics were included in the
questionnaire.
The questions for demographics were: ● Gender (male / female).
● Age (a dropdown list with numbers from 5 through 20+). ● What grade level they are at (middle elementary school, upper
elementary school or highschool).
It is very common to use intervals in questionnaires when asking participants about their age. In this case the target audience were children from middle elementary school up to high school, so it wouldn’t make sense to include a few intervals that only span a couple of years. For this reason a dropdown list was used instead where students could provide their exact age. Another thing to consider about students’ age is that students that are 10 years old right now might see technological devices as a natural part of every part of their life
wanted to have the ability to analyse how age correlates with students’ attitudes. This would still be possible if intervals were used, but a more in depth analysis could be done when having students’ exact age.
One question was about what school they were studying at. The purpose of this was only to gather information about where the data came from.
2.1.2.2 Questions about DLTs
Likert scales from 1-7 (1 = does not agree at all, 7 = agree completely) were used in two questions. The purpose with these questions was to find out if students had positive, negative or neutral attitudes towards different aspects of DLTs.
The questions that had a Likert scale from 1-7 are the following:
● I want to use DLTs in my courses.
● I believe that DLTs can help me perform better in school.
The questionnaire had one multiple choice question where the students had to choose one answer: To what extent do you want to use DLTs for mathematics in
your education? It had five possible answers ranging from not at all to To such
an extent that they replace all normal activities. The purpose of this question was to get an idea of how much change students are willing to have in their education.
One question allowed participants to choose multiple answers: What do you
believe DLTs could help you with? The list of answers covered different aspects of learning, like doing exercises and studying examples. Participants also had the opportunity to write their own answer if they felt something was missing in the list. The purpose of this question was to get an idea about what features students think DLTs should provide.
The final question was a free-text question: Do you have thoughts or
suggestions about DLTs that were not brought up? The purpose with this question was to give students an opportunity to address things that were not asked in the questionnaire.
2.1.3 Designing the survey for teachers
This section describes what questions were included in the questionnaire for the teachers as well as the motivation for including them. As with the
questionnaire for students, this questionnaire can as well be found in section 9.1.4 the appendix. Note that these are written in swedish since the
participants speak swedish as their main language.
This questionnaire also included questions about both demographics and DLTs. All questions except the final one were mandatory.
2.1.3.1 Demographics
As with students I wanted to know if teachers of different demographics have different attitudes towards DLTs.
The questions for demographics were: ● Gender (male / female).
● Age (18-20, 21-25, 26-35, 36-45, 46-55, 56+).
● What grade level they are teaching at (preschool, lower elementary school, middle elementary school, upper elementary school or highschool).
● Amount of years they have been teaching (a dropdown list with numbers from 1 through 30+).
The age intervals in the different options were chosen based on another popular paper. The reason for choosing these age intervals is that I wanted to use standard intervals and not create new ones. I also believe that teachers who fall into different intervals might have very different opinions about DLTs. For example, people who are at the age of 18-20 might be more used to
technology since technological devices have become drastically more pervasive in our everyday life at an early age [12]. Those who are over 30 years old now didn’t have as many technological devices when they were children compared to those who are 18-20 years old today. This could affect teachers’ opinions about DLTs, and it is something worth analysing.
Grade levels is also an interesting aspect to compare. It could be that teachers for different grades have vastly different opinions about whether or not to use DLTs in their education.
The amount of years a teacher has been teaching might also affect their opinions. However, this factor probably has a very strong correlation with the teachers’ age which has to be taken into account in the analysis.
As with the questionnaire for the students, there was a question about what school they were teaching at. The purpose of this was only to gather
information about where the data came from.
2.1.3.2 Questions about DLTs
Likert scales from 1-7 (1 = does not agree at all, 7 = agree completely) were used in three questions. The purpose of these questions was to find out if teachers had positive, negative or neutral attitudes towards different aspects of DLTs.
The questions that had a Likert scale from 1-7 are the following:
● I believe that DLTs can have a positive effect on students’ school grades and understanding of mathematics.
● I have a positive attitude towards students using DLTs instead of course literature outside of their scheduled hours.
The questionnaire had one multiple choice question where the teachers had to choose one answer: To what extent do you want DLTs to be integrated into
standard education? It had five possible answers ranging from I don’t want to
see DLTs integrated into standard education at all to To such an extent that
your areas of responsibility and your role as a teacher to a large extent, or completely, is replaced by DLTs, and that your areas of responsibility becomes something completely different. The purpose of this question was to get an idea of how much change teachers are willing to have to their role and areas of responsibility.
One question allowed teachers to choose multiple answers: In what areas do
you think DLTs could help you in your education? The list of answers covered different aspects of teaching, like providing exercises and giving examples. Participants also had the opportunity to write their own answer if they felt something was missing in the list. The purpose of this question was to get an idea about what features teachers think DLTs should provide.
The final question was a free-text question: Do you have thoughts or
suggestions about DLTs that were not brought up? The purpose with this question was to give teachers an opportunity to address things that were not asked in the questionnaire.
2.1.4 Finding schools for the surveys
Malmo’s official website [6] was used to find schools in the city. One page on this website [7] was used to find elementary schools. On this site one can filter schools with the following parameters (note that they have been translated them from swedish to english):
● Owner (privately owned or public)
● Type of school (preschool or elementary school)
● Grade for this school year - 2019/2020 in this case (grade 0-9) ● Grade for the upcoming school year - 2020/2021 in this case (grade
0-9)
Any was selected as owner. Elementary school was selected as the type of school since preschools are outside of the scope for this project. When it comes to Grade for this school year and grade for the upcoming school year a single value had to be chosen. For middle elementary school the value of 5 was selected for these values, and the value of 8 was selected for upper elementary school.
The search for middle elementary schools yielded 56 results, and the search for upper elementary schools yielded 32 results.
Another page on Malmo’s official website [8] provides lists with all high schools in the city. One list contains all schools that are public, and the other list contains privately owned schools. The lists contained 12 and 25 schools respectively.
Out of these 125 schools a sample of 30 schools should be selected; 10 schools for middle elementary school, 10 for upper elementary school and 10 highschools.
2.1.5 Sampling schools
The most appropriate way to choose schools was to do a random sample of the schools in the target population [24]. In order to select a random sample of schools a (pseudo) random number generator was used [9]. For middle
elementary schools random numbers between 1 and 56 were generated. Once a number was generated the corresponding school was selected. This step was continued until the desired amount of schools had been selected. Schools without contact information were disregarded. This process was repeated for upper elementary schools and highschools.
2.2 Literature review
A literature was conducted in order to gather information about what has already been researched about this topic. The database used to find articles were ACM digital library and ScienceDirect.
Different search queries were designed in order to find as many relevant research articles as possible. The process for creating queries was as follows:
1. Find all relevant terms in the title of this research project. 2. Find synonyms for all terms found in step 1.
3. Make use of the “AND” and “OR” keyword to put together a query that finds articles containing a combination of these terms.
4. Test the queries and tweak them until they provide relevant articles.
The general structure for the query looked like this:
[list of synonyms for DLTs] AND [list of synonyms for different school grades] AND [list for synonyms for mathematics and relevant subjects].
One thing that was noticed was that a lot of irrelevant articles showed up when terms like “elementary school” and “primary school” were included in the query. Most of these articles had nothing to do with digital learning tools. Because of this they were not included.
When it came to using relevant terms for the school subjects it was noted that a lot of irrelevant articles showed up when multiple synonyms were used at once, like this:
“Digital learning tools“ And “mathematics” OR “math” OR “science”.
Because of this it was decided to use only one of these terms at the time in a query. An example of a complete query is:
“digital learning tools” OR "digital learning tool" OR "learning app" OR "Learning apps" AND "mathematics".
3. Results
3.1 Online survey
Below are descriptive statistics of the data gathered in the online survey.
3.1.1 Questionnaire for students
88 students from three different schools answered the questionnaire.
Figure 1-3 shows the demographics of the students who participated in the study.
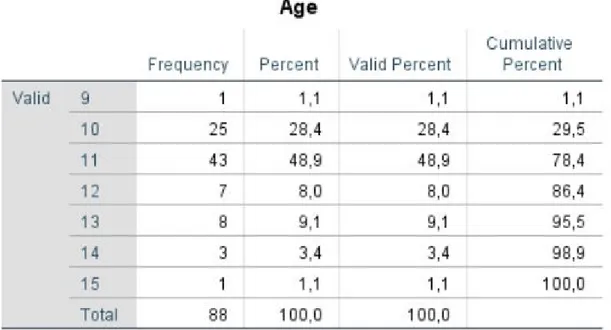
Figure 1: Frequency table of students’ age.
Figure 2: Frequency table of students’ gender.
Figure 3: Frequency table of students’ grade.
Figure 4-7 shows what the students answered to the questions about DLTs.
Figure 4: Frequency table of how much students agree with the statement I want
to use DLTs in my courses. Note that zero students chose Disagree completely
or Disagree a little bit, which is why these options do not show up in the table.
Figure 5: Frequency table of how much students agree with the statement I
The table below shows what students answered to the question What do you
think DLTs could help you with?
What DLTs can help me with Percentage of students that thinks DLTs can help them with certain things Show examples of math concepts in the course 31.8% (28 / 88)
Provide exercises 52.8% (48 / 88)
Help you if you fall behind 48.7% (42 / 88)
Help you if you want something more challenging 44.3% (39 / 88)
Nothing 8.0% (7 / 88)
Other (free-text) 14.8% (13 / 88)
Figure 6: Frequency table of what students think DLTs could help them with. Note that more than one answer could be chosen, which is why the cumulative percent is more than 100%.
13 students answered with free-text. These answers are shown in the list below. They have been translated from swedish to english and sometimes worded differently to clear up things that might not be clear to the reader, but the gist of the answers has not been changed.
● Have DLT in case you have forgotten the physical book. ● Easier to do the exercises when I’m sick.
● Translate words. ● Everything.
● More fun to study and easier to concentrate. ● I don’t know.
● Easier to work with digital tools instead of with pen and paper. ● Good to have a DLT if you forget your book.
● Not sure, it could be easier to learn, but harder to concentrate. ● Read information about a subject.
● Concentrate better.
● It’s easier, more fun and you learn more.
● It helps me to be more precise since the computer forced me to provide the exact answer.
Figure 7: Frequency table showing to what extent students want to see DLTs for
mathematics in their education.
3.1.2 Questionnaire for teachers
6 teachers from four different schools answered the questionnaire.
Figure 8-11 shows the demographics of the students who participated in the study.
Figure 8: Frequency table of teachers’ age.
Figure 9: Frequency table of teachers’ gender.
Figure 10: Frequency table of teachers’ grade.
Figure 11: Frequency table of how many years teachers have been working as teachers.
Figure 12-16 shows what teachers answered to the questions about DLTs.
Figure 12: Frequency table of how much teachers agree with the statement I
want to use DLTs in my education.
Figure 13: Frequency table showing to what extent teachers want to use DLTs in
their education.
Figure 14: Frequency table showing how much teachers agree with the
statement I think that DLTs can have a positive effect on students’ school
results and understanding of mathematics.
The table below shows what teachers answered to the question In what areas
do you think DLTs can help you in your education?
What DLTs can help me with Percentage of teacher
that thinks DLTs can help them with certain things Show examples of math concepts in the course 50% (3 / 6)
Provide exercises 83.3% (5 / 6)
Do diagnostic tests 83.3% (5 / 6)
Better keep track on what students are doing 16,7% (1 / 6) Provide material for students that have fallen
behind 66,7% (4 / 6)
Provide material for students that need something
more challenging 66,7% (4 / 6)
None of the alternative above 0% (0 / 6)
Other (free-text) 0% (0 / 6)
Figure 15: Frequency table of what teachers think DLTs could help them with. Note that more than one answer could be chosen, which is why the cumulative percent is more than 100%.
Figure 16: Frequency table how much teachers agree with the statement I have
a positive attitude towards students using DLTs instead of course literature
outside of school..
The final question was a free-text question: Do you have any thoughts or
suggestions about DLTs for mathematics that were not brought up? One teacher answered the following:
● A couple of thoughts pop up: You don’t ask if I am familiar or have already used some DLT. Neither do you ask why I have a
3.2 Literature review
125 articles were found in ACM and 186 in ScienceDirect when the query described in section 2.2 was used. 128 articles were found in ACM when the term “mathematics” was replaced with “math” and 186 articles were found in ScienceDirect. 149 articles were found in ACM when the term “science” was used and 186 were found in ScienceDirect.
4. Analysis
4.1 Analysis of data gathered from the online survey
4.1.1 Analysing data from students
4.1.1.1 Manual analysis
The data gathered was first analysed manually in order to get hints and ideas about what to analyse with SPSS, as well as what aspects that could be of interest for further research.
The target audience for the student survey were students in grade 4-12, or a corresponding age of roughly 10-18 years old. The results show that the age distribution of the participants was highly concentrated in the younger years. 77.3% were either 10 or 11 years old. The youngest participant was 9 years old and the oldest was 15. This distribution will make it hard to draw any meaningful conclusions about how students’ age corresponds with other variables.
There was an almost equal split between males and females which is great for analysis. 42 participants (47.7%) were male and 46 (52.3%) were female. Since different groups might have different preferences and needs, it would be good to see if gender correlates with other parameters, e.g if males are more positive towards DLTs or vice versa. This analysis is presented in section 4.1.1.2.
When asked how much they agreed with the statement I want to use DLTs in
my courses the result was mostly positive. A likert scale was used where 1 = completely disagree and 7 = completely agree. 10.2% disagreed with the statement to some degree (1.1% completely disagreed), 17.1% were neutral and 72.7% agreed to some degree (29.5% completely agreed). This suggests that students in general have a positive attitude towards DLTs, or at least their perception of what a DLT is.
When asked how much they agreed with the statement I believe that DLTs can
help me perform better in school the result was also mostly positive. 17.0% disagreed with the statement to some degree (2.3% completely disagreed), 27.3% were neutral and 55.7% agreed to some degree (18.2% completely agreed). This shows that a majority of students think that DLTs can help them perform better in school. It also shows that more than 1 out of 4 students are neutral and that roughly 1 out of 6 students don’t believe that DLTs can help them perform better. It is important that students believe in whatever means of education they are using since that belief in and of itself could affect their performance.
When students were asked what features they want the DLT to provide 52.8% want the DLT to provide exercises. 31.8% want the DLT to show examples of math concepts in the course. When it comes to what situations students want the DLT to help them 48.7% want to have help when they fall behind and 44.3% want the DLT to provide something more challenging. This could be because of the inherent challenge with traditional education that there are limited resources and that students with special needs might not always get what they need. In this question students were also able to provide a free text answer, which 13 (14.8%) of them did. Their answers mostly had to do with practical things like making it easier to concentrate, good to have a DLT if you forget your book etc.
Students were asked to what extent they want to use DLTs for mathematics in their education with possible answers ranging from not at all to to such an
extent that they replace all normal activities. 63.6% want to use a DLT to some extent, but it shouldn’t replace any activities completely. 6.8% didn’t want to use a DLT at all. 29.5% want a DLT to replace some normal activities to some extent, and only 3.4% want a DLT to completely replace all normal activities. This data suggests that students in large have a positive attitude about DLTs but at the same time don’t want them to replace too much, if any at all, in their current education.
4.1.1.2 Statistical analysis with SPSS
SPSS was used for statistical analysis. A confidence level of 95% was used [1] - [3]. Gender was used as a control variable when comparing students' answers since it was the only parameter regarding the participants' demographic that had a good enough distribution for analysis. The goal was to find out if there were significant differences between males’ and females’ answers.
Crosstabulations were used to get an idea about where differences in opinions differ between genders.
Below is the distribution of how positive males and females are about using DLTs in their courses.
Figure 17: Crosstabulation of gender and how much they want to use DLTs.
Figure 17 shows that males have a slightly more positive attitude about DLTs. A Spearman’s rho test was done to see if this is a significant difference.
Figure 18: Spearman’s rho test showing correlation between gender and how
positive the students are about using DLTs in their education.
Figure 18 shows that the p-value is 0.147 (meaning that it is a 14.7% chance that the uneven distribution between genders presented in figure 10 is
because of chance). Since 0.147 > 0.05 it is concluded that there is not a significant difference between how positive males and females are about DLTs.
Below is the distribution of how much males and females believe DLTs can help them perform better in school.
Figure 19: Crosstabulation of gender and how much they believe DLTs can help
them perform better.
Figure 19 shows that males believe that DLTs can help them more than women believe DLTs can help them. A Spearman’s rho test was done to see if this is a significant difference.
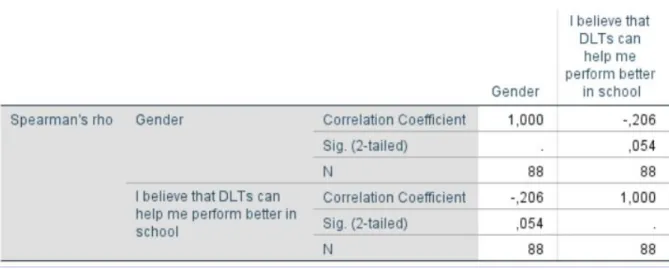
Figure 20: Spearman’s rho test showing correlation between gender and how
much males and females believe DLTs can help them perform better.
Figure 20 shows that the p-value is 0.054. Since 0.054 > 0.05 it is concluded that there is not a significant difference between how positive males and females are about DLTs. However, it is worth pointing out that the p-value is very close to the limit of 5% and that it is likely that the value could be below 5% in another survey with the same amount of participants. To be certain that there isn’t a significant difference it would be good to ask the same question to a much larger sample in order to get a more reliable result.
Below is the distribution of to what extent males and females want to use DLTs for mathematics.
Figure 21: Crosstabulation of gender and how much they believe DLTs can help
them perform better.
Figure 21 shows that there is no clear difference or pattern in what extent males and females want to use DLTs in their education. A Spearman’s rho test was done to find out what the p-value is.
Figure 22: Spearman’s rho test showing correlation between gender and to what
extent males and females want to use DLTs in their education.
Figure 22 shows that the p-value is 0.904. Since 0.904 > 0.05 it is concluded that there is not a significant difference between how much males and females and females want to include DLTs in their education.
4.1.2 Analysing data from teachers
Due to the limited amount of data gathered it would be meaningless to draw conclusions from the data. Therefore no statistical analysis has been done on this data.
4.2 Literature
One meta study [11] reviewed 92 articles about how technology can be used in schools to enhance the learning in secondary school mathematics and science. In general the groups that used DLTs had significantly better learning
outcomes compared to students in the control groups (g=0.65, p<0.001). However, results varied a lot between studies. The authors point out that one of the strongest contributing factors to student learning outcomes is what they call teacher training. Throughout the report they emphasise the importance of training teachers on how to make the best use of the DLTs for their students.
One important aspect of teaching is that every learner has a different learning style. There are a lot of different DLTs available today, but no DLT has the ability to adapt to these different learning styles [12]. If a DLT shall be able to teach students as effectively as possible it has to be able to adapt to students with different learning styles. In one study [12] the authors identified three different learner types that students can be categorized into. Each type is
argued that the user experience should contain features that align with how the particular student gets motivated [12]. For example, a more competitive type of person might be motivated if the DLT kept track of scores when they perform well, or if they only have a certain amount of time to complete a task. On the other hand, a more curious person might not need a high score, but should rather have the ability to explore as much as possible [12].
A university in Taiwan conducts all their education online, and researchers have researched if there is a difference in how males and females perform on these online courses [13]. At this university students can choose when to study and at what pace to study. Empirical data from the university was used. 24 different parameters were evaluated in SPSS and the goal was to find
statistically significant differences between males and females. The
researchers controlled for background information and found that females in general take more student loans, rented more books, did a higher amount of non mandatory assignments, got fewer warnings, and higher grades.
The authors thought that females in general tend to perform better than males in online education. Females do the assignments even if they don’t have to show them to a teacher in order to pass the course. They also take advantage of the available resources to a higher extent than males. These factors
contribute to better grades. The authors point out the importance of conducting further research in how online- and other digital learning platforms should be constructed in order to handle students that learn in different ways. And they also emphasize that gender seems to be a big factor; what works good for one gender might not work good for another.
In one study the researchers talked about the poor student performance in mathematics in Brazil among students aged 15 or younger [14]. Students there are generally very poorly motivated about mathematics, which in turn makes them perform even worse. It was also pointed out that having a good education in the early stages of education is critical for success in higher education as well as their career. Introducing DLTs make the education more interactive and engaging, which could have a positive effect on students’
grades [14]. They also point out that when it comes to mathematics, it is better to strive to create a deep foundational understanding of concepts instead of memorizing. Because of this it is important to try to integrate mathematics into other areas of life, and perhaps make the user experience more game like [14].
One aspect to consider when creating DLTs is how user agency, or how much control the user has of the user interaction, affects the learning. Some
research has been conducted on this and the results are somewhat similar but not entirely conclusive [15]. Too much agency might have a negative effect on learning outcomes.
5. Discussion
Since only 88 students participated in the conducted survey it has not been used to draw confident conclusions. Rather it has been used to get an idea of what probably is true for the bigger population, as well as what would have to be further researched. When it comes to the demographics, gender was the only parameter that could be used to separate the data into groups. 68 out of 88 students were either 10 or 11 years old. The rest was 9 or 12 - 15. A bigger and more even spread of ages would be necessary to be able to draw
conclusions about how to suit a DLT for students with different ages.
Since motivation is a factor that contributes to learning it is important that students and teachers like the DLT they are using. If they are forced to use a DLT that they don’t like, then this would have a negative affect on their
learning outcomes. However, from the survey conducted it was clear that most students have a positive attitude towards DLTs. 72.7% wanted to use DLTs in their education, 17.1% were neutral and 10.2% did not want to use DLTs in their education. Students in general also believe that DLTs can help them perform better.
When asked to what extent students wanted to use DLTs in their education only 6.8% did not want to use DLTs at all. The most frequent answer with 63.6% was that they wanted to use it to some extent but it should not completely replace any existing activities.
There was no significant difference between males and females opinions about how positive their attitude was towards DLTs, if they believed DLTs can help them perform better, or to what extent they want to use DLTs in their
education. It is worth noting though that the p-values for the first two of these questions were 0.147 and 0.054 respectively. Neither is significant, but the second is very close. It would still be worth conducting further research on these questions, even the first one, since there seems to be at least some difference between the genders. As pointed out in one study [13], there was a significant difference in how males and females performed in an online
education environment, so it is likely that there is some difference in attitudes, as well as what actions students take, between genders.
From the existing research it is clear that DLTs can have a positive effect on students’ learning. However it is important to understand that DLTs cannot just be introduced in a school and then expect students to perform better. Teacher training is critical.
The field of DLTs is very young compared to the traditional form of education. Because of this, and the fact that there is a constant and very rapid
usually are focused on researching a single aspect, like user agency. I think this is the right thing to do in these early generations of DLTs in order to get an understanding of how particular aspects affect learning outcomes in isolation. When the research is more conclusive about individual aspects it might be time to build bigger programs where multiple aspects have been considered.
Since people learn differently it is critical to identify different types of learners. In the study focused on adapting the DLT to individual students they used a simple classification system which they stated could be improved a lot. Having three different learner types is better than one, but it would be wise to make these categories more nuanced so that the user experience could be better customized for each person. This is an aspect that has more to do with the psychology of learning and personality types.
Another aspect to consider is how these different learner types are identified by the DLT, or how the DLT gets customized to suit different types. One option is to let the user have control over the settings. For example they could decide themselves if they want to have a time limit for each task, or when to move to harder exercises. Another option is to use some form of artificial intelligence in the DLT so that it can determine what type of configuration works best for each student. A student might think that they learn more efficiently in a certain configuration, but a DLT could find something that is more optimal.
One thing to remember is that a teacher cannot provide all help that every single student needs to reach their potential. Technology has that possibility. The “only” thing that is needed is to create a DLT that meets these needs and then make it available to students. If a DLT shall provide students with all the help they need, or at least fill in the gaps in traditional education, it is
important to build larger programs that are designed to provide a teaching experience that give students the knowledge they need to pass courses. If DLTs have to do more than for example showing how to multiply numbers. The content and information provided has to match a given curriculum if it is to provide value in a bigger context.
6. Conclusions
Both teachers and students are in general positive about using DLTs in their education and they believe that DLTs can help them perform better. Numerous articles show that DLTs can have a significant positive effect on learning
outcomes. Teacher training is one strongly contributing factor to how much better students perform with DLTs. Recent research points out the importance of considering the fact that people learn differently and that DLTs have to adapt accordingly.
There are a few things DLTs would have to do to teach mathematics as effectively and efficiently as possible. Since many students have a lacking motivation and inspiration for mathematics, one key ingredient that DLTs would have to do is to present students with an exiting and fun user
experience which could raise their motivation. This could be done by gamifying the experience, using vivid animations, avatars etc.
Another key feature is that DLTs have to be customizable to different students based on their learner type. Whether the DLTs use artificial intelligence to customize the experience based on how the student responds to different events, or if students get to customize the user experience manually by
changing settings is of less importance than DLTs actually having any type of customization.
DLTs also have to have a wide range of features that meet students’ different needs. Sometimes they might need good visualizations of key concepts, and sometimes they might need numerous exercises in order to solidify their understanding.
Having some level of user agency is important, especially if the DLTs don’t have the ability to sense if the student is struggling or not. If a student would quickly lose motivation if they are struggling and the DLTs keep plowing through the content without giving an option to take a step back and maybe review simpler material. The last thing DLTs should do is to decrease students’ motivation and confidence in their abilities. Having some level of user agency, but still not too much, would be good to make sure that students feel like they are in control and responsible for their own learning.
When integrating DLTs into schools it is important that the teacher first get training in how to best utilize them. If DLTs are to be used at large scale throughout entire courses they have to provide learning material that match a given curriculum. Creators of DLTs will have to cooperate with schools to make sure that the DLTs will teach students things that are relevant and that they will be examined on.
6.1 Further research
The current level of DLTs provide some level of value, but they don’t provide every student with what they need to fulfill their potential. I think that more research has to be done about DLTs since there is such a huge potential. If every child gets the support they need early on they will have a much higher chance of succeeding later in their education and career.
More research has to be conducted on how to customize the user experience for each individual based on a number of parameters. A comprehensive list of learner types has to be created as well as a list of features that are suitable for each type. More research would also have to be done on how to create a new level of DLT that combines knowledge gathered from existing DLTs and takes the best features from them and combines them into a next level DLT.
Once researchers are confident about what is needed to create a DLT that provides a learning experience that gives students what they cannot get in a standard education environment, it is time to research how to best integrate them in a course and match it with a curriculum. As DLTs continue to get more advanced we will have to evaluate what role DLTs have in education and what role teachers have. It could be the case that DLTs handle a bigger part as they get more advanced.
7. Acknowledgements
Thanks to my supervisor Dipak Surie for his valuable guidance.
8. References
[1] Oates, B., 2006. Researching Information Systems And Computing. 2nd ed. London: Sage.
[2] S. Körner and L. Wahlgren, Statistiska metoder, 3rd ed. Lund: Studentlitteratur, 2015.
[3] W. Albert and T. Tullis, Measuring the User Experience, 2nd Edition, 2nd ed.
[4] A. Resmini and L. Rosati, Pervasive information architecture, 1st ed. Burlington, MA: Morgan Kaufmann, 2011.
[5] "Coronavirus", Who.int, 2020. [Online]. Available:
https://www.who.int/emergencies/diseases/novel-coronavirus-2019. [Accessed: 06- May- 2020].
[6] "Start", Malmo.se, 2020. [Online]. Available: https://malmo.se/. [Accessed: 22- May- 2020].
[7] "Hitta och jämför grundskolor", Malmo.se, 2020. [Online]. Available:
https://malmo.se/Hitta-och-jamfor/Grundskolor/Hitta-och-jamfor-grundskol or.html. [Accessed: 22- May- 2020].
[8] "Gymnasieskolor A-Ö", Malmo.se, 2020. [Online]. Available:
https://malmo.se/Service/Utbildning-och-forskola/Gymnasieskola/Gymnasie skolor-A-O.html. [Accessed: 22- May- 2020].
[9] M. Haahr, "RANDOM.ORG - True Random Number Service", Random.org, 2020. [Online]. Available: https://www.random.org/. [Accessed: 22- May- 2020].
[10] "SPSS Software", Ibm.com, 2020. [Online]. Available:
https://www.ibm.com/analytics/spss-statistics-software. [Accessed: 22- May- 2020].
[11] D. Hillmayr, L. Ziernwald, F. Reinhold, S. Hofer and K. Reiss, "The potential of digital tools to enhance mathematics and science learning in secondary schools: A context-specific meta-analysis", Computers & Education, vol. 153, p. 103897, 2020. Available: 10.1016/j.compedu.2020.103897.
[12] Brian Magerko, Carrie Heeter, Ben Medler, Joe Fitzgerald, "Intelligent Adaptation of Digital Game-Based Learning", Rightslink.
[13] Yu-Chen Hsiao, Yi-Tzone Shiao, "Research on Gender Differences in the Digital Learning Performance of University Students", Rightslink, 2020.
[14] Priscila Cadorin Nicolete, Marta Adriana da Silva Cristiano, Juarez Bento da Silva, Simone Meister Sommer Bilessimo, José Pedro Schardosim Simão , Kryscia Daviana Ramírez Benavides , João Bosco da Mota Alves, "Mathematics and technological integration in the Brazilian basic education as motivation to STEM", Rightslink.
[15] Erik Harpstead, J. Elizabeth Richey, Huy Nguyen, Bruce M. McLaren, "Exploring the Subtleties of Agency and Indirect Control in Digital Learning Games", Rightslink.
[16] L. Rosenfeld, P. Morville and J. Arango, Information architecture for the
World Wide Web, 4th ed. Beijing: O'Reilly, 2015.
[17] Alan Dix, Alessio Malizia, Silvia Gabrielli, "HCI and the Educational Technology Revolution ", AVI ‘16.
[18] "MOOC.org | Massive Open Online Courses | An edX Site", Mooc.org, 2020. [Online]. Available: https://www.mooc.org/. [Accessed: 06- Sep- 2020].
[19] "Coursera | Build Skills with Online Courses from Top Institutions",
Coursera, 2020. [Online]. Available: https://www.coursera.org/. [Accessed: 06- Sep- 2020].
[20] "The purpose of education", GOV.UK, 2020. [Online]. Available: https://www.gov.uk/government/speeches/the-purpose-of-education. [Accessed: 07- Sep- 2020].
[21] "Teachers - Students per teaching staff - OECD Data", theOECD, 2020. [Online]. Available:
https://data.oecd.org/teachers/students-per-teaching-staff.htm. [Accessed: 07- Sep- 2020].
[22] "Why Math Is So Hard for Some Students", ThoughtCo, 2020. [Online]. Available:
https://www.thoughtco.com/why-math-seems-more-difficult-for-some-studen ts-1857216. [Accessed: 07- Sep- 2020].
[23] "Curriculum & Learning - Curriculum et apprentissage",
Dcp.edu.gov.on.ca, 2020. [Online]. Available:
https://www.dcp.edu.gov.on.ca/en/curriculum/elementary-mathematics/con text/the-importance-and-beauty-of-mathematics. [Accessed: 07- Sep- 2020].
[24] K. KELLEY, "Good practice in the conduct and reporting of survey research", International Journal for Quality in Health Care, vol. 15, no. 3, pp.
9. Appendix
9.1 Questionnaires
9.1.1 Pilot study for students
9.1.2 Pilot study for teachers
9.1.3 Students