Malmö University, 2007
Faculty of Odontology
Department of Oral Biology
JESSICA NEILANDS
ACID TOLERANCE OF
STREPTOCOCCUS MUTANS
Publication also available in electronic format at, www.mah.se/muep
Till mamma och pappa
”Knowledge is always the first step to a new medicine.” Peter Agre Nobel Prize Winner in Chemistry 2003
CONTENTS
LIST OF PAPERS ... 11 ABSTRACT ... 12 POPULÄRVETENSKAPLIG SAMMANFATTNING ... 14 INTRODUCTION ... 16 What is a biofilm?... 16Why study biofilms instead of planktonic cells?... 18
Biofilm development ... 18
The oral biofilm... 20
Streptococcus mutans... 21
Carbohydrate metabolism in oral streptococci ... 23
Acid Tolerance... 24
Development of caries ... 26
AIMS ... 29
MATERIALS AND METHODS ... 30
BACTERIAL STRAINS AND MEDIA ... 30
BIOFILM FORMATION... 30
PROTEIN EXPRESSION ... 33
ACID TOLERANCE ... 36
RESULTS ... 39
Paper I – Protein expression by planktonic and biofilm cells of Streptococcus mutans ... 39
Paper II – Effect of acid shock on protein expression by biofilm cells of Streptococcus mutans ... 42
Paper III – Protein expression by Streptococcus mutans during initial stage of biofilm formation... 46
Paper IV – Acid tolerance by biofilm cells of Streptococcus mutans ... 49 Additional results ... 54 DISCUSSION ... 59 CONCLUDING REMARKS ... 69 OWN REFLECTIONS... 70 ACKNOWLEDGEMENTS ... 74 REFERENCES ... 76
LIST OF PAPERS
This thesis is based on the following papers, which will be referred to in the text by their Roman numerals.
I. Protein Expression by Planktonic and Biofilm Cells of Strepto-coccus mutans
G. Svensäter, J. Welin, J.C. Wilkins, D. Beighton and I.R. Ham-ilton
FEMS Microbiol. Lett. (2001) 205:139-146
II. Effect of Acid Shock on Protein Expression by Biofilm Cells of Streptococcus mutans
J. Welin, J.C. Wilkins, D. Beighton, K. Wrzesinski, S.J. Fey, P. Mose-Larsen, I.R. Hamilton and G. Svensäter
FEMS Microbiol. Lett. (2003) 227:287-293
III. Protein Expression by Streptococcus mutans During Initial Stage of Biofilm Formation
J. Welin, J.C. Wilkins, D. Beighton and G. Svensäter Appl. Environ. Microbiol. (2004) 70:3736-3741
IV. Acid Tolerance of Biofilm Cells of Streptococcus mutans J. Welin-Neilands and G. Svensäter
Appl. Environ. Microbiol. (2007) 73:5633-5638 Microbe (2007) 10: 499 (Journal Highlights)
ABSTRACT
In nature, bacteria are organized in surface-associated biofilm communities. Dental plaque is one of the most studied biofilms and harbours many different species including the star of this thesis Streptococcus mutans. S. mutans has been implicated in the aetiology of caries and has been studied extensively but most research has been carried out on liquid cultures (planktonic cells). Biofilm cells have been shown to differ in many ways from plank-tonic cells when it comes to protein and gene expression, growth rate, and stress tolerance. The overall aim of this thesis was to study S. mutans grown in biofilms of different ages (2 hours – 3 days) and to study the acid tolerance response (ATR) in biofilm cells.
Biofilms were grown in chemostats, on glass slides and in flow-cell systems. To evaluate protein expression in flow-cells, 14C-labelled proteins were separated by 2-dimensional gel eletrophoresis (2-DE) followed by autoradiography and computer-assisted image analy-sis. Acid killing experiments were conducted by exposing the cells to pH 3.0 for two hours and then counting the number of survi-vors by plating on blood agar. ATR-experiments were carried out in a similar way to the acid killing experiments except that the cells were first exposed to pH 5.5 for 2-3 hours and then exposed to pH 3.0-3.5 for 30 minutes to two hours. Surviving cells were counted by plating on blood agar but also examined using LIVE/DEAD® BacLightTM viability stain. Inhibition of the cell’s ability to induce an ATR was tested by exposing the cells to 0.5 M fluoride.
Mature biofilm cells (3 days old) showed a different protein ex-pression pattern compared to corresponding planktonic cells with
the most prominent difference being the decreased expression of enzymes involved in carbohydrate catabolism. Contact with a sur-face induced changes in protein expression as quickly as two hours after surface adhesion. In these cells however, the proteins involved in carbohydrate catabolism were enhanced. Surface contact and growth in a biofilm lead to increased acid tolerance. In newly formed biofilm cells of S. mutans H7, 5% of the cells survived an acid shock of pH 3.0 for two hours compared to only 0.0004% of the planktonic cells. The mature biofilm cells were even more acid tolerant with 41.5% survivors after two hours at pH 3.0. Mature biofilms induced only a negligible ATR that did not enhance their survival significantly. Still, 20% of the proteins analysed had an altered expression after exposure to pH 5.5. In newly formed biofilm cells the ATR lead to decreased membrane damage at low pH as visualised by LIVE/DEAD® BacLightTM staining. Different strains showed different abilities to induce an ATR and it was also shown that this ATR could be inhibited by exposure to 0.5 M fluo-ride during the pH 5.5-adaptation period.
The results of the thesis show that biofilm cells of S. mutans differ from their planktonic counterparts and the strains of S. mutans tested behave somewhat differently.
POPULÄRVETENSKAPLIG
SAMMANFATTNING
Mikrobiologisk forskning har till stor del bedrivits genom att man odlat bakterier i näringslösningar och på agarplattor och sedan stu-dera bakterierna på olika sätt. Detta sätt att odla bakterier över-ensstämmer inte särskilt bra med hur bakterier växer i verkligenhe-ten. I naturen växer bakterier fastsittande på olika typer av ytor (tandemalj, epitel, stenar, plastytor etc.) i s.k. biofilmer. Det har visat sig att bakterier i biofilmer inte alls beter sig som bakterier som växer fritt i en näringslösning (planktonisk form). Biofilmbak-terier skiljer sig från planktoniska bakBiofilmbak-terier genom att de är mer resistenta mot antibiotika och biocider. De är mer stresståliga, de växer långsammare och de har ett annorlunda gen- och proteinut-tryck. Sammantaget har biofilmbakterier andra egenskaper. På grund av detta, har fokus inom mikrobiologisk forskning det se-naste decenniet riktats mot att studera biofilmer för att komma närmare bakteriernas verklighet.
I munnen växer bakterierna i biofilmer. Bakterierna i munnen är nödvändiga för att god munhälsa men de är också orsak till två av världens vanligaste sjukdomar; karies och parodontit.
Streptococ-cus mutans tillhör den normala munfloran men medverkar också
till att karies utvecklas. Karies uppstår när det blir en obalans i det orala ekosystemet. När man äter sjunker pH i munnen pga att bak-terierna i plack producerar syror när de bryter ner kolhydrater. Om man äter ofta kommer pH i plack att vara surt under längre perioder, vilket leder till en selektion av bakterier som är stresståli-ga och kan anpassa sig till den sura miljön. Detta resulterar i att en
sin tur kapacitet att göra det ännu surare i placket under långa pe-rioder. Detta kan leda till demineralisering av emaljen och upp-komst av karies. S. mutans anpassar sig till en sur miljö genom att inducera en syratoleransrespons (ATR) vid subletala pH-värden. Syftet med denna avhandling var att studera hur S. mutans beter sig när den växer i biofilmer och ta reda på mer om syratoleransre-sponsen i S. mutans biofilmer.
Resultaten från avhandlingen visar att S. mutans bakterier som vuxit i en biofilm i tre dagar har ett annorlunda proteinuttryck än planktoniska bakterier och att förändringar i proteinuttryck sker redan efter två timmar av ytkontakt. Proteinuttrycket ändras efter hand som biofilmen växer och blir äldre. Biofilmbakterierna visade sig också vara många gånger mer syratoleranta än de planktoniska bakterierna och ytkontakt i sig var viktigt för den ökade syratole-ransen. Äldre biofilmer (3 dagar) var mer syratoleranta än unga biofilmer (3 timmar) vilket kan bero på att de utsatts för pH chocker under växt i biofilmen och därmed inducerat en ATR. Unga biofilmer inducerade en ATR när de utsattes för pH 5.5 i tre timmar och denna ATR kunde inhiberas genom tillsats av fluor. Det visade sig också att olika stammar av S. mutans var olika syra-toleranta och hade olika förmåga att inducera en ATR. Detta kan i praktiken innebära att människor med bakterier som är mer be-nägna att inducera en ATR löper större risk att utveckla karies. Genom att förhindra induceringen av ATR skulle man alltså kunna förhindra utvecklingen av karies.
INTRODUCTION
What is a biofilm?
Imagine that you haven’t brushed your teeth for a while, that furry deposit on your teeth is caused by the development of a biofilm on the tooth surface. Inevitably I have to start with van Leuwenhoek; he was the first to discover biofilms in 1674, although he did not refer to them as such. He studied plaque under a simple micro-scope and found what he described as ‘little animalcules’. In the early 1940’s ZoBell observed that the number of bacteria on a sur-face was dramatically higher than in the surrounding media. He also noticed that if the bacteria were exposed to the surface for a couple of hours the bacteria could not be removed by washing (116). In the beginning of the 1960’s Millin and Smith published a paper on the nature and composition of dental plaque. Extensive research on these biofilms was conducted in order to find cures for dental caries and periodontal disease. Dental plaque which is a per-fect example of a natural occurring biofilm is probably the most examined biofilm in the world. In 1973, Characklis studied micro-bial slimes in water systems and showed that they were highly re-sistant to disinfectants such as chlorine (13). In 1978 a paper by Costerton et al described a theory of biofilms and explained mechanisms whereby micro-organisms adhere to living and nonliv-ing materials (16). Since then, interest in biofilms has increased and the term ‘biofilms’ is now well established in microbiology re-search. However the definition of a biofilm varies between scien-tists. Biofilms have been defined by Donlan and Costerton as: “Mi-crobially derived sessile communities characterized by cells that are irreversibly attached to a substratum or interface or to each other,
are embedded in a matrix of extracellular polymeric substances that they have produced, and exhibit an altered phenotype with re-spect to growth rate and gene expression.”(26). This definition is used by some scientists while others also consider protein films on a surface without bacteria to be biofilms. In our studies we have seen an altered phenotype in the bacteria as quickly as two hours after adhesion to a surface and we therefore consider biofilm cells to be those that have adhered to a surface even if they have not yet produced any matrix. Once adhered to a surface, the bacteria change their properties and go from free-floating planktonic cells to adhered biofilm cells (15, 31, 40). Biofilms can form on almost any surface - living or inert. They form on the bottom of boats, on rocks in rivers, in the intestine, in the vagina, on contact lenses, on implants and catheters and on many more surfaces including of course the oral cavity.
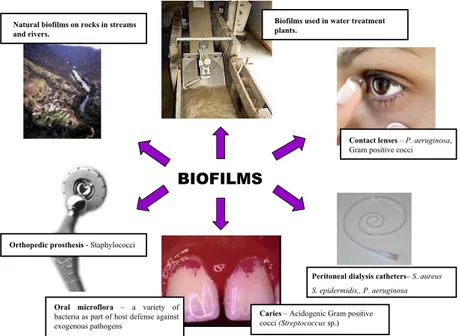
Figure 1. Examples of beneficial and non-beneficial biofilms growing in differ-ent environmdiffer-ents.
BIOFILMS
Contact lenses – P. aeruginosa,
Gram positive cocci
Peritoneal dialysis catheters– S. aureus S. epidermidis,, P. aeruginosa Caries – Acidogenic Gram positive
cocci (Streptococcus sp.)
Orthopedic prosthesis - Staphylococci Natural biofilms on rocks in streams and rivers.
Biofilms used in water treatment plants.
Oral microflora – a variety of
bacteria as part of host defense against exogenous pathogens
Biofilms can be beneficial, cleaning waste-water in water treatment plants, and are necessary factors in the host defence system against exogenous pathogenic micro-organisms (17). The biofilms in the intestine protect the host from the colonisation of exogenous pathogens and are important producers of vitamins K and B12 (79).
Biofilms are, on the other hand, also the source of 80% of all infec-tions in the human body, for example, airway, urinary tract, and intestine infections, dental caries and periodontal disease (19). Biofilm formation on implants and the resulting bacterial infections are growing problems due to the more widespread application of implants in medicine (77).
Why study biofilms instead of planktonic cells?
The first reason for studying biofilms is that in nature more than 90% of all bacteria exist in this state. The second reason is that biofilm cells are different in many ways to their free-floating plank-tonic counterparts. They are more resistant to biocides and antibi-otics, show different gene- and protein expression patterns, are me-tabolically different and have different growth rates (11, 81, 94, 106, 114). All in all, biofilm cells are different and behave
differ-ently to planktonic cells. So if we want to be able to extrapolate
results obtained in the laboratory to real life we need to study bac-teria under biofilm conditions.
Biofilm development
Biofilm development goes through different stages, however the development is dynamic and several stages occur at the same time. In short, once a surface has been exposed to naturally occurring liquids such as saliva, blood, water etc the surface is immediately coated with proteins (18, 25, 92). Bacteria will then adhere to this protein-coated surface where they will multiply and form micro-colonies. Surrounding bacteria will adhere (co-adhesion) to the biofilm and some bacteria in the biofilm will leave (detachment) and colonize new surfaces. The biofilm bacteria produce and sur-round themselves with an extracellular matrix consisting of poly-saccharides (EPS). In this way the biofilm grows and matures and a small community will evolve (25, 27, 90). In this community the cells can communicate with each other through signal peptides. Gradients of nutrients, pH, oxygen and waste products can arise creating different niches within the community almost like different areas of a city (109). During these different phases the bacteria within the biofilm can change their properties in relation to changes in the surrounding environment.
The most common model used is mono-species biofilms on dif-ferent kinds of surfaces, with or without surface coating. In
Strep-tococcus mutans grown on mucin-coated glass surfaces it has been
shown that biofilm development goes through four phases: adhe-sion (0-1h), adheadhe-sion and cell diviadhe-sion (1-4h), accumulation through cell division (4-12h) and finally a stabilization phase (60).
In Pseudomonas aeruginosa, a bacterium causing infections in
pa-tients with burn wounds and in cystic fibrosis papa-tients, biofilm de-velopment on coverslips has been described as proceeding through five stages (96):
1. initial, reversible attachment of the cells to the surface
2. production of EPS resulting in more firmly adhered, “irreversi-ble” attachment
3. early development of biofilm architecture 4. maturation of biofilm architecture
5. dispersion of single cells or clusters from the biofilm
Mixed-species biofilms are common in nature but are more diffi-cult to reproduce in vitro as it is difficult to grow several organisms together and analyse the biofilm. However using the combination
of Confocal Laser Scanning Microscopy and fluorescent probes it is becoming easier to undertake such studies (20, 115).
The oral biofilm
“One gram of human plaque consists of about 1 trillion bacteria. The average human has about 10 mg of plaque which is equivalent to 10 billion bacteria.”
M. Wilson, BioIMEB, Galway Ireland, 2003
The human oral cavity is colonized by a wide range of bacterial species, mycoplasmas, viruses and yeasts (72). Within the bacteria over 30 genera representing more than 600 species have been iden-tified. The resident microflora plays a critical role in the host de-fence system against exogenous pathogens by acting as a barrier to their colonisation. The bacteria persist by adhering to surfaces such as the tooth, the epithelial cells of the mucosa and to each other. Without secure attachment existence in the oral cavity would be short-lived since non-adherent cells will be washed away by saliva. Surface-attachment and biofilm growth are therefore fundamental to persistence in the oral cavity. Several factors, such as different surfaces for adherence, saliva, gingival crevicular fluid (GCF), tem-perature, redox potential, pH and nutrient availability affect the micro-organisms in the oral cavity and therefore the plaque biofilm varies on distinct anatomical surfaces (e.g. fissures, approximal and smooth surface, gingival crevices and dentures) (70). On top of the environmental factors, the biofilm bacteria are affected by each other and the presence of one species can be beneficial to one but disadvantageous to another. Even at sites that on first inspection appear to be close such as supragingival and subgingival plaque, the composition of the biofilm varies greatly. After a tooth has erupted or been cleaned it is immediately covered with salivary proteins forming a conditioning film on the tooth surfaces - termed the acquired pellicle. Studies have shown that this acquired pellicle consists of among other things acidic proline-rich proteins (PRP), mucins, lactoferrin, lysozyme, amylase and secretory IgA (48, 59). The primary colonising bacteria adhere to this pellicle. These bac-teria, predominantly belonging to the genus Streptococcus in
par-ticular S. mitis, S. oralis and S. salivarius, will grow and colonize the surface and their metabolic activities will modify the environ-ment making it more suitable for other species. These changes could include changes in redox potential, exposure of new recep-tors for adhesion and generation of novel nutrients. Late colonisers will attach via inter-bacterial adhesin-receptor interactions to the primary colonisers (55, 71, 91, 97, 112). The cells in the biofilm divide and the biofilm continues to mature until a stable situation with high species diversity has been reached. Detachment of bacte-ria from the biofilm also occur enabling cells to colonize elsewhere. In health the composition remains relatively stable over time but in disease the composition will change (71). In healthy individuals, a large proportion of the oral microflora consists of facultative an-aerobic Gram-positive bacteria with most of them belonging to the genus Streptococcus. Examples of other common species in the oral cavity include Actinomyces, Haemophilus, Lactobacillus,
Fusobac-terium, Veillonella, Porphyromonas and Prevotella (72). Since the
resident oral microflora is necessary for health but is also the source of disease in the oral cavity treating oral diseases is a chal-lenging problem.
Streptococcus mutans
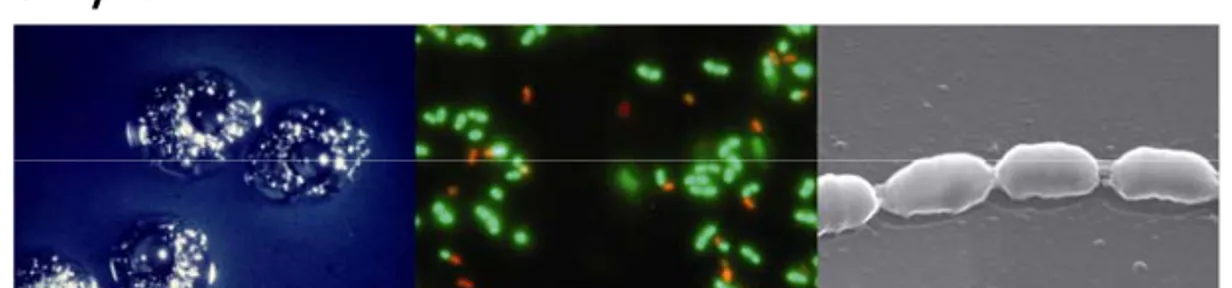
Figure 3. S. mutans visualised in different ways (from left to right): bacterial colonies on MSB agar with one colony containing thousands of bacteria, LIVE/DEAD® BacLightTM
fluorescent stain and scanning electron microscopy (SEM) at 1000x and 30000x respectively.
S. mutans is a Gram positive coccus belonging to the genus
Strep-tococcus and is part of the oral microflora. It got its name in 1924
when Clarke isolated an organism from a carious lesion that was more oval than round (see SEM Figure 3) and appeared to be a mutant form of Streptococcus (14). S. mutans belongs to the group of mutans streptococci to which S. sobrinus, S. cricetus, S. rattus,
S. ferus, S. macacae and S. downei also belong (72). Attention was drawn to S. mutans when it was shown that it could cause caries in germ-free rats and was later found in samples from carious sites and saliva from caries-active individuals (29, 30, 43, 64).
S. mutans possesses certain characteristics which are important
in the carious process (4, 56, 69):
(i) It has high and low affinity sugar transport systems that can operate over a wide range of conditions to ensure sugar uptake even at low pH and at low sugar concentrations.
(ii) It has an efficient glycolytic pathway that can rapidly degrade carbohydrates and, due to the acidic end-products, will lower the pH in the surrounding environment rapidly.
(iii) It produces extracellular polysaccharides (EPS) that contrib-utes to the plaque matrix and facilitate the colonisation of the bac-teria.
(iiii) It can produce and store intracellular polysaccharides (IPS) when carbohydrates are in excess. These IPSs allow metabolism and acid production even in the absence of carbohydrates.
(iiiii) It has the ability to induce an acid tolerance response (ATR) that will enhance its survival at low pH values (see below). The ATR is also accompanied by changes in cellular physiology that make the bacteria more cariogenic.
Although S. mutans possesses all these characteristics it should be noted that caries occurs in the absence of mutans streptococci and individuals with high levels of mutans streptococci do not nec-essarily develop caries (5, 54, 65). Other non-mutans streptococci have been shown to possess the same properties as S. mutans and could therefore be responsible for the development of disease (93, 108). S. mutans can, in our system, be considered as a model or-ganism and other oror-ganisms could be considered as well.
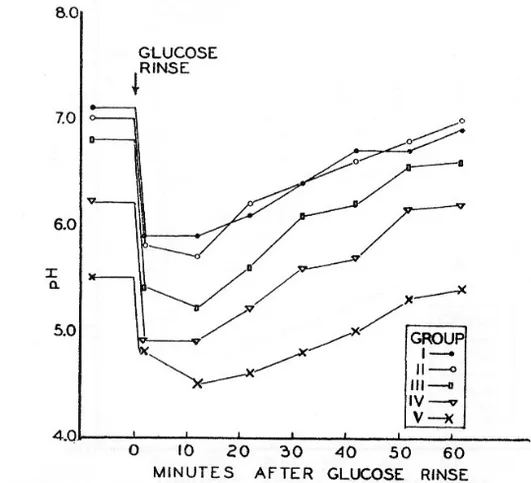
Carbohydrate metabolism in oral streptococci
Figure 4. The classic pH curves of Stephan showing pH drops in plaque from individuals with different caries activity (100).
In the early 1940’s Stephan showed that when oral plaque was ex-posed to glucose, the pH in the plaque dropped dramatically and the degree and rate of the pH fall increased with the concentration of carbohydrates particularly that of refined sugars in the food (100) (Figure 4). In oral streptococci carbohydrates are broken down in the glycolytic pathway (Figure 5) with different acids such as acetic acid, succinic acid, propionic acid, valeric acid, formic acid and lactic acid as end-products. S. mutans produce formate, acetate, ethanol, and lactate as end-products in the glycolytic pathway. At low sugar concentrations mostly formate, acetate and ethanol are formed while at high sugar concentrations S. mutans switch to lactate production to avoid ‘sugarkilling’. This is a toxic
condition for the cell which occurs due to accumulation of glyco-lytic intermediates in the cytoplasm. Lactate and protons are then transported across the cell membrane as lactic acid which rapidly lowers the pH in plaque (12). Therefore, shortly after food intake the pH in plaque will fall rapidly and then rise somewhat more slowly due to saliva clearance and the buffering capacity of the sa-liva which neutralises the metabolic acids (104).
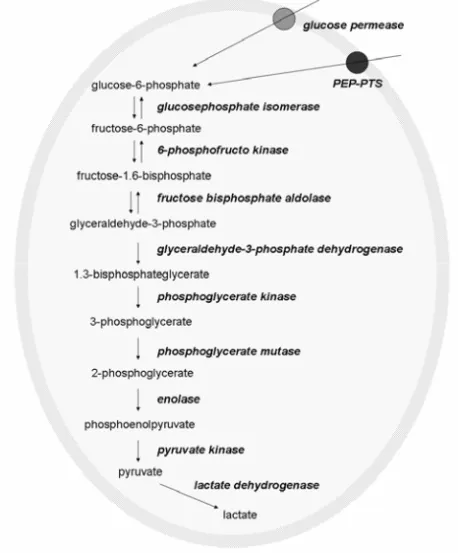
Figure 5. The glycolytic pathway in S. mutans.
Acid Tolerance
“Acid tolerance is the ability to sense and response to acid stress.”
J.W Foster. Microbial Responses to Acid Stress. In: Bacterial Stress Responses.
In the oral cavity the pH fluctuates over the day along with food intake and the bacteria in the plaque biofilm are thereby exposed to cycles of low pH. How long these cycles of low pH last depends on the flow and buffering capacity of the saliva and the amount and composition of the plaque. In order to survive the cycles of low pH different systems for tolerating and surviving these pH fluctuations have evolved amongst oral bacteria. In some species up-regulation of genes involved in base production is a response to acid stress. In S. salivarius urease production is enhanced at low pH (98). Urease converts urea to ammonia and carbon dioxide thus raising the surrounding pH. Another system for raising the surrounding pH is the arginine deiminase system. Arginine deimi-nase degrades arginine to ornithine, carbon dioxide and ammonia (22). Some bacteria such as Escherichia coli, Listeria
monocyto-genes and different Enterococcus species induce a so-called acid
tolerance response (ATR) (7, 35, 38). This phenomenon was first discovered in the human pathogen Salmonella enterica serovar
Ty-phimurium (former S. typhimurium). Foster and Hall showed that
cells that first had been exposed to a moderate pH change (pH 5.8) before exposure to low pH (pH 3.3) had a higher survival rate than those exposed directly to low pH (34). The ATR in S. enterica
se-rovar Typhimurium was also shown to be accompanied by changes
in protein expression (33). So if the bacteria have the chance to ad-just to a lower pH environment, they induce mechanisms that will promote survival at even lower pH values.
S. mutans has the ability to induce an ATR. This acid tolerance
re-sponse involves (10):
- increased ATPase activity
- shifts to lower pH optimum for glucose transport and gly-colysis
- increased glycolytic activity
- shift to homo-fermentative metabolism - increased proton impermeability - synthesis of stress-responsive proteins
Protons cannot diffuse freely over the cell membrane but can be transported along with, for example, weak acids at low pH. When the pH outside the cell is lowered, an increased proportion of pro-tons will enter the cell into the cytoplasm and the intracellular pH
will be lowered (41). S. mutans does not keep the intracellular pH constant but strives to maintain it about 1 pH unit higher than the external pH in order to facilitate the transmembrane pH gradient driving the proton motive force across the membrane. The trans-membrane pH gradient is maintained by proton extrusion via membrane-associated ATPase and acid end-product efflux (23). The activity of the ATPases has been shown to be enhanced on ex-posure to low pH (46). Glycolytic enzymes are sensitive to low pH and their activity is diminished as the pH is lowered. In S. mutans, the glycolytic rate initially decreases when the pH in the surround-ing medium falls. However once the cells have acclimatized to the new environment the pH optimum for the glycolytic enzymes is lowered and the glycolytic rate increases again and can exceed val-ues seen at neutral pH valval-ues (46). This means that S. mutans can continue to metabolise at lower pH values than bacteria that have not induced an ATR. It also means that the pH in plaque will con-tinue falling when under ‘normal’ circumstances it would have stopped due to inhibition of glycolysis at low pH. This ability to induce an ATR is of course a competitive advantage when the pH is lowered. As indicated by the pH curves of Stephan, plaque from caries-active individuals had a lower initial pH and was capable of lowering the pH after a sucrose pulse more than plaque from car-ies-inactive individuals. This suggests that an ATR can occur in vivo leading to a more acid tolerant phenotype.
Development of caries
“The ‘ecological plaque hypothesis’ states that the selection of ‘pathogenic’ bacteria is directly coupled to changes in the environ-ment and disease need not have a specific aetiology; any species with relevant traits can contribute to the disease process.”
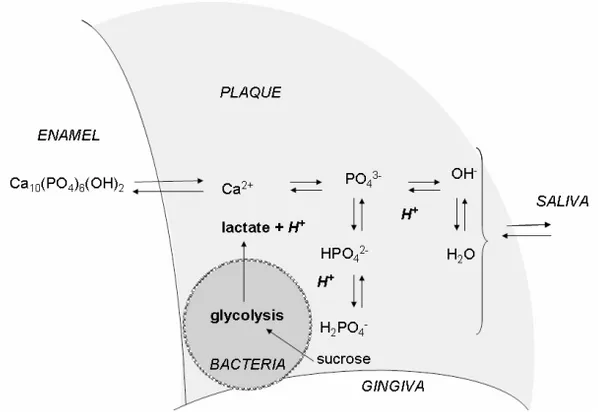
P.D. Marsh, Microbiology (2003), 149:279-294 The tooth enamel is built up of hydroxyapatite crystals (Ca10(PO4)6(OH)2). The stability of the enamel is dependent on pH
and the free active concentrations of calcium and phosphate in so-lution according to the following reaction (Fig 6):
Figure 6. Enamel demineralisation process. (Modified picture from Textbook of Cariology (105) .
When the pH in the oral cavity is lowered the reaction is shifted towards the right and more and more PO4
is transformed into HPO4 and H2PO4
-. The pH at which the reaction is balanced and the saliva is exactly saturated with respect to enamel apatite is termed ‘critical pH’. Below this pH, which is around 5.5, the enamel demineralises whilst above this pH the enamel tends to re-mineralise. Demineralisation and remineralisation occur constantly and caries arises when the balance between remineralisation and demineralisation is disturbed and there is a net loss of mineral from the tooth (105).
Paradigm shift in the concept of dental caries
Over the years our view of the aetiology of caries has gone through two paradigm shifts (28). Up until the end of the 1970’s the ‘non-specific plaque hypothesis’ proposed that it was the dental plaque that was the crucial factor causing caries and removal of the plaque was the way of curing the disease. In the mid-1980’s the ‘specific plaque hypothesis’ arose stating that out of all the organisms in
dental plaque only a few species were actively involved in the dis-ease. S. mutans was one of those organisms. However it was later shown that the presence of S. mutans could only explain about 6-10% of the caries experience in a given population and that dra-matic decrease in caries experience was documented in populations without apparent changes in salivary S. mutans levels (42, 101). These observations implied that S. mutans could not be the sole cause of caries development. Recently a new hypothesis has been proposed, the ‘ecological plaque hypothesis’ (67). This hypothesis suggests that disease is a result of a shift in the balance of the oral microflora due to changes in local environmental conditions. In this hypothesis it is not actually the presence of a certain bacteria that is necessary for disease development but bacteria with certain
characteristics. So, for example, a frequent intake of easily
fer-mentable carbohydrates will keep the pH in plaque low for pro-longed periods. Bacteria able to adapt to this low pH have an ad-vantage over others that cannot adapt and will therefore increase in number. This will result in the emergence of a more acid tolerant flora. These bacteria will be able to metabolize at low pH values and will further promote low pH in the oral biofilm. During healthy conditions when the oral ecosystem is in balance these bac-teria would still be present but they would not express their viru-lent characteristics (68). Being able to prevent oral bacteria from adapting to low pH and expressing virulent traits could be an ef-fective strategy in caries prevention.
AIMS
• To characterize protein expression of S. mutans grown as biofilms as compared to those grown in planktonic culture. • To characterize phenotypic changes in S. mutans occurring in
response to a surface and over time.
• To identify and investigate the function of acid stress proteins in biofilm cells of S. mutans.
• To study the acid tolerance response in young and mature biofilms.
• To investigate the influence of fluoride on the acquisition of acid tolerance in newly adhered biofilm cells.
MATERIALS AND METHODS
BACTERIAL STRAINS AND MEDIA
Three different strains of S. mutans were used in the different stud-ies. S. mutans H7 (I-IV) was isolated from dental plaque above a carious enamel surface (102). S. mutans XAB5 (IV) was also iso-lated from dental plaque and piso-lated onto non-selective solid agar pH 4.5, while S. mutans UA159 (IV) was a kind gift from Dr Den-nis Cvitkovitch, University of Toronto, Canada. The S. mutans classification was confirmed by biochemical tests carried out ac-cording to Beighton and co-workers (6, 111). The strains produced acid from inulin and had alpha-glucosidase and beta-glucosidase activity, but were negative for N-acetylglucosaminidase and arabi-nosidase. S. mutans H7 was the most frequently used strain since this strain had been used in previous studies.
In all the experiment minimal media (MM4) containing six amino acids (glutamate, cysteine, serine, valine, leucine and aspargine), 40mM phosphate/citrate buffer and 20mM glucose was used. The minimal MM4 media was used to resemble the conditions of the low nutrition in the mouth between meals.
BIOFILM FORMATION
Numerous models for biofilm formation exist. Biofilms can be grown in anything from simple models such as microtiterplates, on glass beads and in silicon tubing, to more advanced models such as flow-cells and chemostats. Every method has its advantages and disadvantages. A simple model can be easy and fast to use but the
few parameters can be changed, while a more advanced model might be harder to handle but on the other hand may mimic in vivo conditions better. The important thing is to find the model suitable for the experiment.
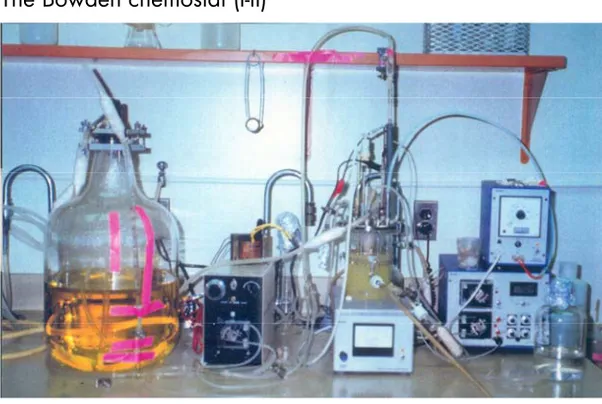
The Bowden chemostat (I-II)
Figure 7. Bowden chemostat up and running.
Picture: Prof. Ian Hamilton, University of Manitoba, Canada.
In papers I and II the Bowden chemostat (see Figure 7) was used to generate the 3-day old biofilms. The biofilm cells were grown on hydroxyapatite rods. The chemostat consists of a stainless steel vessel with a stainless steel lid. The junction between the lid and the vessel is sealed by a silicone gasket. The lid carries ports for in-oculation, medium input, pH electrodes, thermometer, gases and ports for 10 rods for the accumulation of biofilms. The vessel has a medium overflow port and a port to sample the planktonic phase. The dilution rate was controlled by the rate of delivery of medium by a peristaltic pump and was set to 0.1 culture volumes/h. The pH of the medium was controlled by addition of 0.1 M KOH or 0.1 M lactic acid and monitored by a pH controller. In our experiments the growth-limiting factor was glucose but could be other factors such as amino acids or nitrogen. To keep the temperature at 37° C the whole vessel was placed in a water bath. This is quite a
sophis-ticated system and it is possible to control the pH and gas-phase in the chemostat. Additions can also be made to the cells in the chemostat during the experiment and rods can be removed from the chemostat for analysis of the biofilm at different times during the experiment. This system is suitable for the growth of more ma-ture biofilms but is more difficult to handle and takes longer to set up than the models described below.
Glass slide model (III)
In paper III a simple glass slide model was used. Cells in exponen-tial growth phase were concentrated 100 times and allowed to ad-here to a glass slide for two hours. After the 2-hour incubation time the glass slides were rinsed and the cells that came off during the rinse were considered to be planktonic cells. The adherent biofilm cells were removed from the glass slide by sonication. The advantage with this model is that it is very easy to use while still giving enough biofilm cells for further analysis. A common prob-lem in biofilm research is achieving the same conditions for the cell types to be compared. The advantage of this model is that both biofilm and planktonic cells are exposed to exactly the same condi-tions making it easy to compare the two cell types. The disadvan-tage with this model is that once the experiment has started it is not possible to control parameters such as pH and nutrients and for this reason it is only suitable for short experiments.
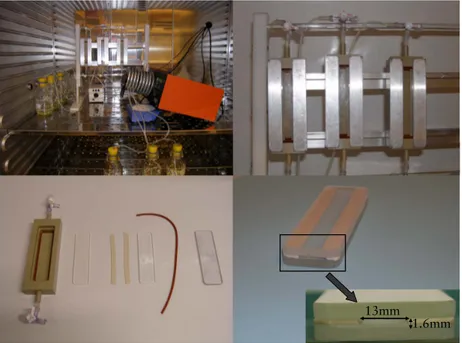
The flow-cell model (IV)
In paper IV we moved on from the glass slide model to the flow- cell model. The flow-cells are two parallel glass slides separated by 1.6mm rubber spacers and mounted in a holder, sealed with O-rings and covered by a lid (see Figure 8). The flow-cells were origi-nally designed at the University of Buffalo and were a modified version of the one described by DePalma (24). The flow-cells have a total surface area of 26 cm2 for biofilm growth. The total volume in the flow-cell is 2.1 cm3
. The flow within the cells is laminar and is controlled by a peristaltic pump. The flow keeps the pH in the flow-cell at pH 7.5 and lowers the pH in the flow-cell within five minutes during pH stress experiments. The glucose concentration is also maintained at a constant level due to the constant flow.
Figure 8. The flow-cell system up and running (top left), flow-cells in action (top right), unassembled flow-cell (bottom left), glass slides separated by sili-cone spacers showing space for biofilm growth (bottom right).
This system is suitable for short to medium term experiments. Old and thick biofilms (two days old and more) create a non-laminar flow in the flow-cell which tends to cause clogging. The use of two glass slides makes it possible to do two different analyses of cells that have been exposed to the same conditions. In this flow-cell model it is also possible to use different surfaces types e.g. tita-nium, hydroxyapatite etc.
PROTEIN EXPRESSION
Protein expression (I-III)
In papers I-III protein expression of biofilm cells and planktonic cells was compared. Whole cell (membrane, cell wall and cyto-plasmic), 14C-labelled protein extracts were separated by two-dimensional gel electrophoresis (2DE) using a pH 4-7 immobiline dry strip in the first dimension and a 14% SDS-PAGE in the sec-ond dimension. Proteins were separated in the first dimension
ac-13mm 1.6mm
cording to their isoelectric point and in the second dimension ac-cording to their molecular weight.
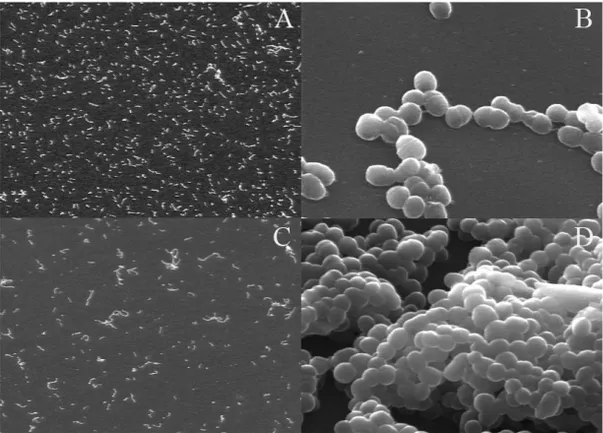
Figure 9. Newly formed (2-hour old) biofilms of S. mutans H7 grown in a flow-cell system (A = 250x and B 5000x). Notice the single cell layer in the newly formed biofilms. C and D show 24-hour biofilms of the same strain at the same magnification as the newly formed biofilms. After 24 hours the cells have started to divide and form multi-layer biofilms. Scanning electron images taken by Dr Ann Meyer at University of Buffalo.
The gels were dried and exposed to autoradiography film for ap-proximately three weeks. The advantage of using 14C-labelled pro-teins is that only propro-teins synthesized during the specific period of interest are studied. This is advantageous since although the amount of a protein produced can be relatively large during the experimental period, the total amount of the protein may still be small and difficult to detect with staining techniques such as silver staining or Coomassie blue. The disadvantage with 14C-labelling is that it takes time before the results are achieved due to the long exposure (sometimes months) of the gels to the autoradiography film.
Image analysis (I-III)
Analysis of the protein expression was made using Bio Image soft-ware on a Sun Sparc workstation. The integrated optical density (IOD) of each spot was expressed as a percentage of the total blackening of the image attributed to proteins to give the IOD%. The IOD% represents the relative rate of synthesis (RRS) for each protein spot, i.e. how much of the protein has been synthesized compared to the total protein synthesis. Studying the proteins in this way corrects for any reduction in total metabolism and growth rate between populations compared.
The coefficient of variation (CV%) was calculated for each spot by dividing the standard deviation by the mean IOD% for the spot and multiplying it by 100.
To select the proteins that displayed increased or decreased RRS the following criteria were used:
1. The spot had to be present in at least two out of three autoradiograms.
2. The average IOD% value for a spot had to be 1.3-fold higher or lower than the control cells.
3. The percentage increase/decrease had to be higher than the CV% for the spot.
Protein identification (I-III)
Protein spots were excised from dried or wet Coomassie stained gels. After tryptic digestion of the proteins, peptide mass finger-prints for protein identification were created by MALDI-TOF MS. The peptide mass fingerprints were matched against the sequence database of the sequenced strain of S. mutans UA159. MALDI-TOF was performed at two different laboratories: at Dr Beighton’s lab at GKT Dental Institute in London and in collaboration with Dr Wrezinski at The Centre for Proteomics Analysis in Odense. All protein spots were sent for analysis more than once to confirm the identification. Proteins were also identified by extrapolating identi-fications from the protein gels in the article ‘Cellular and extracel-lular proteome analysis of Streptococcus mutans grown in a chemostat’ by Len et al (58). The use of 14C-labelling gives a picture of which proteins have been produced during the time of interest. However, although some proteins may have been produced on a
relatively large scale, compared to others, there may still be insuffi-cient material for MS analysis and identification may thus be im-possible. Small proteins may also be difficult to identify since too few peptide fragments are generated to give a statistically reliable match. These are possible reasons why not all proteins of interest have been identified.
Figure 10. Protein identification starts with the protein spots being excised from either wet Coomassie stained gels (normally blue in colour) or dried gels. An autoradiogram is placed on top of the dried gel with the four crosses matching and protein spots are then excised using the autoradiogram as a guide.
ACID TOLERANCE
Acid killing experiments (II, IV)
Acid killing experiments were carried out on both 3-day old biofilm cells (II), 3-hour old biofilm cells (IV) and planktonic cells (II, IV). Acid killing was conducted by exposing the cells to pH 3.0 for two hours and counting the number of survivors by plating on blood agar.
Figure 11. Schematic picture of protein identification process using MALDI-TOF.
ATR experiments (II, IV)
Induction of an ATR in biofilm and planktonic cells was assessed by exposing the cells to pH 5.5 for 2-3 hours. In paper II, after pH 5.5 exposure, the biofilm and planktonic cells were exposed to pH 3.0 for two hours and the number of survivors counted as de-scribed above. In paper IV, after the 3-hour period at pH 5.5 the cells were exposed to pH 3.5 for 30 minutes. The biofilms were stained with LIVE/DEAD® BacLightTM
viability stain and exam-ined in a fluorescence microscope. Photographs of the biofilm cells were taken with a digital camera. The BacLight stain contains two different stains SYTO9 and propidium iodine. SYTO9 penetrates all cells and stains them green while propidium iodine can only penetrate cells with damaged membranes and stains them red. The principle is that cells with intact membranes are alive while cells with damaged membrane are dead. This is however questionable since bacteria are able to survive with a damaged cell membranes and have the capacity to repair them.
Database searches In-gel tryptic
digestion
Recover peptides MALDI-TOF
In the ATR and acid killing experiments the cells are exposed to pH 3.5 and 3.0. So why were these pH values chosen? In order to test if the bacteria have induced an ATR the cells must be tested at a pH that will show a difference between the different cell groups. If the pH is too high the cells will survive no matter what and if the pH is too low then all the cells will die. Therefore it is necessary to find the pH where the effect of pH 5.5 can be shown.
RESULTS
Paper I – Protein expression by planktonic and biofilm cells
of
Streptococcus mutans
Key findings:
-
Three day old biofilm cells of
S. mutans
express a
dif-ferent protein pattern compared to corresponding
planktonic cells.
-
Proteins involved in the glycolytic pathway are
re-pressed in biofilm cells of
S. mutans
while proteins
in-volved in biosynthetic processes are enhanced.
-
Three day old biofilm cells express proteins that are
not expressed in planktonic cells
Protein Expression in 3-day Old Biofilm Cells
Analysis of the 2-DE protein expression profiles of the biofilm and planktonic cells revealed that out of a total 694 protein spots ana-lysed, 78 proteins had a diminished relative rate of synthesis (RRS) while 57 proteins had an increased RRS in the biofilm cells com-pared to planktonic cells. The biofilm cells also expressed 13 pro-teins not expressed in planktonic cells while there were 9 propro-teins expressed in planktonic cells but not in biofilm cells. With the help of mass spectrometry analysis, 21 of the enhanced proteins and 20
of the diminished proteins where identified. Of the enhanced pro-teins identified, most (15 of 21) were involved in transcrip-tion/translation and protein folding. Of the identified proteins with diminished expression, 12 out of 20 were associated with energy metabolism – with 8 of them belonging to the glycolytic pathway. The proteins only expressed in biofilm cells were of course of great interest in the search for key enzymes that control biofilm charac-teristics. At the time of publication of the paper only one of the 13 ‘novel’ proteins was identifiable; this was the protein ‘Elongation factor’ which is involved in the elongation process during transla-tion. At a later stage another protein was identified by extrapola-tions from Len et el (58) and it was a protein involved in cell divi-sion, cell division protein Div IVA. The rest of the ‘novel’ proteins were expressed in too small amounts for MS analysis.
Figure 12. Autoradiograms of 2DE protein profiles of S. mutans H7 growing at steady state in planktonic phase (A) and in 3-day old biofilms on hydroxya-patite rods (B) in a chemostat. Proteins marked with arrows are enhanced (solid arrows) or diminished (open arrows) 1.3-fold or more in biofilm cells compared to planktonic cells. Proteins indicated with a star (*) in A were only expressed in planktonic cells and proteins indicated with a star (*) in B were only expressed in biofilm cells
Table 1. Identified proteins with enhanced or diminished relative rate of syn-thesis in biofilm cells compared to planktonic cells. Spot numbers refer to Figure 12.
Functional category Protein ID name Spot Spot no change Fold Carbohydrate catabolism Pyruvate dehydrogenase pdh 4a 2.3
NADH oxidase nox 37a 2.5
Glyceraldehyde-3-phosphate dehydrogenase gapd 51 1.9
75 1.6
Triosephosphate isomerase tpi 56 1.5
Enolase eno 72 1.6
6-phosphofructo kinase 6-fk 76 1.6
161b 1.9
Fructose-1.6-bisphosphate aldolase fba 78a 1.3
Pyruvate kinase pyk 108 1.3
6-phospho-β-galactosidase gal 119 1.8
L-lactate dehydrogenase ldh 985 2.2
Bioenergetics Adenylate kinase adk 97 2.6
Transcription/translation Elongation factor Tu Ef-Tu 5 1.9
81 2.8
Elongation factor Ts Ef-Ts 86 2.3
Elongation factor G Ef-G 201 8.1
LSU ribosomal protein L10P L10P 25 4.4
DNA-directed RNA polymerase rpo 31 2.6
SSU ribosomal protein S1P S1P 46a 1.5
46b 1.5
SSU ribosomal protein S2P S2P 77 3.9
Ribosome recycling factor rrf 91 1.5
SSU ribosomal protein S6P S6P 605 2.2
Protein folding DnaK dnaK 15a 1.6
310 1.4
Trigger factor tig 118a 2.1
Grpe protein grpe 136a 1.6
60 kDa chaperonin groEL 71 1.4
103 2.3
210 1.4
Cell division Minicell associated protein Div IVA div IVA 47 2.2 Cell division protein FTSZ ftsZ 118b 2.9 Lipid biosynthesis Acyl-carrier protein phosphodiesterase ACPe 48 3.9
Enoyl-[acyl-carrier-protein]reductase (NADH) ACPr 99 1.9
DNA replication ATP-dependent DNA helicase RECG RECG 52 1.8 Nucleic acid biosynthesis Formate tetrahydrofolate ligase ftl 60 2.5 Amino acid biosynthesis Phospho-2-dehydro-3-deoxyheptonate aldolase aldo 42 1.9 D-3- phosphoglycerate dehydrogenase serA 74 1.8 Antioxidant Manganese type superoxide dismutase sod 83 1.5
Paper II – Effect of acid shock on protein expression by
biofilm cells of
Streptococcus mutans
Key findings:
- Three day old biofilm cells of
S. mutans
are six orders
of magnitude more resistant to acid stress than
corre-sponding planktonic cells.
- Exposure of 3-day old biofilm cells of
S. mutans
to pH
5.5 for two hours does not induce an ATR as seen in
planktonic cells.
- In planktonic cells the ATR is accompanied by
de-creased expression of the glycolytic enzymes while in
biofilm cells expression of these was unaffected or
slightly enhanced.
Acid Tolerance of Planktonic and 3-day Old Biofilm Cells of S. mutans
In planktonic cells of S. mutans, exposure to a sub-lethal pH (pH 5.5) results in an induction of an ATR that enhances the survival at low pH. The object of this study was to determine if 3-day old biofilm cells induce an ATR in a similar manner to that seen in planktonic cells. Cells were exposed to pH 3.0 for two hours with or without prior adaptation at pH 5.5. Biofilm cells maintained at pH 7.5 were six-orders of magnitude more acid resistant than cor-responding planktonic cells (41.5% vs. 4x10⁻⁵
%). Exposure of planktonic cells to pH 5.5 resulted in a significant increase in the number of survivors at pH 3.0 (3.4%). In biofilm cells however exposure to pH 5.5 only increased the number of survivors at pH 3.0 slightly (73.5%). This increase was not significant (P = 0.61).
Table 2. Percent survival of pH 7.5 control and pH 5.5-incubated planktonic and 3-day old biofilm cells after two hours exposure at pH 3.0.
% survivors P Planktonic cells 7.5 0.00004 Planktonic cells 5.5 3.4 0.0003a Biofilm cells 7.5 41.5 Biofilm cells 5.5 73.5 0.61b a = planktonic pH 7.5 vs. planktonic pH 5.5 b = biofilm 7.5 vs. biofilm pH 5.5
Alterations in Protein Synthesis after pH 5.5 Exposure
In the planktonic cells, 102 proteins displayed changes in relative rate of synthesis in response to the pH change. In biofilm cells, 126 proteins had an altered expression after pH change. Twenty-three proteins were expressed in biofilm cells but not in planktonic cells and four proteins in planktonic but not in biofilm cells.
Figure 13. Autoradiograms of 2DE gels showing proteins involved in carbo-hydrate and energy metabolism whose synthesis was altered 1.3-fold or more after acid adaptation in biofilm (Ba) and planktonic (Pa) cells. Solid arrows indicate proteins with enhanced expression after acid adaptation and open ar-rows indicate diminished expression.
Mass spectrometry identified 44 proteins involved in carbohydrate and energy metabolism. The most apparent observation was the
acid-induced down-regulation of glycolytic enzymes seen in plank-tonic cells involving 11 of 19 isoforms identified (See Table 3) with several of the proteins being down-regulated more than 2-fold. One protein, ‘pyruvate dehydrogenase’ was however up-regulated 3.5-fold. This protein was also up-regulated 2.5-fold in biofilm cells. Apart from pyruvate dehydrogenase, the pH 5.5 exposure re-sulted in no change or up-regulations to a modest degree of the glycolytic enzymes in biofilm cells. Although not a large increase, lactate dehydrogenase expression was up-regulated significantly (P = 0.03).
Table 3. Effect of acid adaptation (pH 7.5 – 5.5) on proteins involved in car-bohydrate catabolism in planktonic and biofilm cells. Spot numbers refer to Figure 13.
Protein ID name Spot Spot no Planktonic cells Biofilm cells
6-phosphofructokinase 6-fk 76 1.9 1.3
161b nc nc
fructose bisphoshate aldolase fba 78a 2.7 nc
78b 1.5 nc
150a nc 1.6
331 2.2 1.3
triosephosphate isomerase tpi 56 1.6 nc
glyceraldehyde-3-phosphatedehydrogenase (NAD) gapd 51 2.2 nc
69 nc nc 75 1.4 nc 109 nc nc 112 nc nc 177 nc nc phosphoglycerate kinase pgk 65 nc 1.6 73 4.8 1.6 174 2.8 1.6 phosphoglycerate mutase pgm 79 3.9 nc 134 nc nc
enolase, high Mw eno 50 3.6 1.8
72 6.5 nc
191 1.9 nc
enolase, low Mw 262 1.8 1.4
318 nc nc
pyruvate kinase pyk 106 1.3 nc
107a 1.9 nc
108 1.8 nc
pyruvate dehydrogenase pdh 4a 3.5 2.5
L-lactate dehydrogenase ldh 985 1.7 1.6
formate acetyltransferase fat 140 nc 1.7
glyceraldehyde-3-phosphatedehydrogenase (NADP) gapd(P) 82a 1.5 nc
α-glucosidase α-gl 4c nc 1.4
acetate kinase ack 64 nc nc
347 nc nc
6-phospho-β-galactosidase gal 119 1.6 nc
(Putative phosphotransferase enzyme II, SGCA) (SGCA) (25) (1.5) (nc)
PTS mannose IIAB man 113 2.7 nc
HPr-phosphotransferase system Hpr 615a nc nc
615b nc nc
615c nc nc
615d nc nc
NADH oxidase nox 37a nc 2.3
H+/ATPase α-subunit 1060 nc nc
exopolyphosphatase exo 87 nc nc
adenylate kinase adk 97 nc nc
= increased relative rate of synthesis = decreased relative rate synthesis nc = no change in relative rate of synthesis ( ) = new ID, not carbohydrate catabolism
Paper III – Protein expression by
Streptococcus mutans
dur-ing initial stage of biofilm formation
Key findings:
- Contact with a surface induces changes in protein
expression in cells of
S. mutans
.
- In 2-hour biofilm cells of
S. mutans
proteins involved
in carbohydrate metabolism are enhanced compared
to planktonic cells.
- One protein is expressed only in adhered cells and
not in planktonic cells.
Changes in Protein Expression after Surface Contact
Since 3-day old biofilm cells of S. mutans showed a different pro-tein expression pattern compared to planktonic cells, propro-tein ex-pression in newly formed biofilm cells was investigated to see if changes occurred directly after contact with a surface. In this study, small gels (7 cm immobiline dry strips) were used since the protein load was too small for the use of large (14 cm) gels. The resolution of the small gels is lower than for the large gels and due to the lower protein load only proteins with high abundance will be revealed. Of 124 proteins analysed, 25 showed enhanced RRS while 8 showed diminished RRS. One protein was only expressed in biofilm cells while 5 proteins were expressed in planktonic cells alone. Twenty-three proteins were identified by extrapolating iden-tifications from large gels from previous experiments.
Figure 14. Autoradiogram of 2DE protein profiles of S. mutans H7. Protein expression in planktonic cells (A) and in 2-hour old biofilm cells (B). Open arrows indicate proteins whose expression was diminished more than 1.3-fold and solid arrows indicate proteins whose expression was enhanced 1.3-fold or more in biofilm cells compared to planktonic cells.
The most prominent change in these newly adhered biofilm cells was the enhanced expression of glycolytic enzymes. Seven enzymes: enolase, phosphoglycerate kinase, glyceraldehy3-phosphate de-hydrogenase, 6-phosphofructokinase, fructose bisphosphate aldo-lase, phophoglycerate kinase and pyruvate kinase, all belonging to the glycolytic pathway, were enhanced.
Figure 15. Comparison of the proportion of glycolytic enzymes in 2-hour biofilm cells and planktonic cells of S. mutans H7.
When comparing planktonic and biofilm cells the glycolytic en-zymes constituted 24.6% of all the proteins analysed while the same figure for planktonic cells was 15.7%, a difference that was statistically significant (P = 0.02) (Figure 15).
planktonic cells
glycolytic enzymes other enzymes 2-hour biofilm cells
glycolytic enzymes other enzymes
Table 4. List of identified protein spots in biofilm cells showing enhanced or diminished RRS more than 1.3-fold compared to planktonic cells. Spot num-bers refer to figure 14.
Protein synthesis Functional category Spot no name Spot change Fold Enhanced Carbohydrate catabolism 37a nox 2.1 NADH oxidase
72 eno 1.9 Enolase
985 ldh 1.7 L-lactate dehydrogenase
78a fba 1.7 Fructose bisphosphate aldolase
75 gapd 1.7 Glyceraldehyde-3-phosphate dehydrogenase
28 α-gl 1.7 Glucan 1,6-alpha-glucosidase
73 pgk 1.5 Phosphoglycerate kinase
108 pyk 1.4 Pyruvate kinase
79 pgm 1.4 Phosphoglycerate mutase
76 6-fk 1.4 6-phosphofructokinase
Protein folding 118a tpi 1.4 Trigger factor, ppiase
70 DnaK 1.6 DnaK protein
310 1.6
Transcription/Translation 77 S2P 1.5 SSU ribosomal protein S2P 45 S1P 1.5 SSU ribosomal protein S1P 91 rrf 1.4 Ribosome recycling factor 31 rpo 1.4 DNA-directed RNA polymerase 86 Ef-Ts 1.3 Elongation factor Ts Cell division 118b FTSZ 2.0 Cell division protein FTSZ
47 Div IVA 1.8 Mini-cell associated protein Div IVA Amino acid biosynthesis 42 aldo 1.7 Phospho-2-dehydro-3-deoxyheptonate aldolase
Diminished
Antioxidant 44 tox 2.0 Thiol peroxidase
Paper IV – Acid tolerance by biofilm cells of
Streptococcus
mutans
Key findings:
- After surface adhesion, cells of
S. mutans
become up
to 70.000 - fold more acid tolerant than
correspond-ing planktonic cells.
- Newly formed biofilm cells of
S. mutans
induce an
ATR when exposed to pH 5.5 that enhances their
sur-vival at pH 3.5.
- Fluoride inhibits the induction of an ATR in newly
formed biofilm cells of
S. mutans
.
Due to the change seen in protein expression after adhesion of S.
mutans to a surface and the increased acid tolerance in 3-day
biofilms we were interested in studying the acid tolerance response in newly adhered biofilm cells to see if they showed the same acid tolerance as mature biofilms. In this study different strains of S.
mutans were used (H7, XAB5 and UA159) to investigate
differ-ences in acid tolerance between them. The effect of fluoride on acid tolerance was also tested.
Acid Tolerance of Planktonic and 3-hour Old Biofilm Cells of S. mutans
Planktonic and 3-hour old biofilm cells of the three different strains were exposed to pH 3.0 for two hours. Of the planktonic cells, S. mutans UA159 was the most acid tolerant followed by S.
mutans H7 with S. mutans XAB5 being the least tolerant (see
Ta-ble 5). The same pattern was seen in the biofilm cells, however with less profound differences between the strains. As seen in Table 5, 8.2% of S. mutans UA159 survived the acid shock, 5.1% of S.
significantly (P < 0.05) more acid tolerant than corresponding planktonic cells but there was no statistical difference between the strains. Comparison between biofilm and planktonic cells of S. mu-tans H7 exposed to different pH values (6.0, 5.0, 4.0 and 3.0) showed that biofilm cells are more acid tolerant at pH 4.0 and be-low.
Table 5. Percent survivors in planktonic and biofilm cells of three different strains of S. mutans incubated at pH 3.0 for two hours.
% survivorsa
Bacterial strain Planktonic cells Biofilm cellsb P S. mutans UA159 0.01 8.2 < 0.05 S. mutans H7 0.0004 5.1 < 0.05 S. mutans XAB5 0.00005 3.5 < 0.05 a
= Percent survivors as compared to control cells kept at pH 7.5. Number of survivors was counted by plating on blood agar.
b
= Biofilm cells were scraped off from the glass surface and suspended in buffer before plating on blood agar.
Acid Tolerance Response in 3-hour Biofilms
The ability to induce an ATR in biofilms was tested by exposing the biofilm cells first to pH 5.5 for three hours, followed by pH 3.5 for 30 minutes and then analyzing the cell viability with LIVE/DEAD® BacLightTM
staining. Control cells were kept at pH 7.5 before acid stress at pH 3.5. As mentioned in the Materials and Methods section, cells with a damaged membrane are stained red while cells with an intact membrane are stained green. As seen in Figure 16, the non-adapted cells are mostly red (1-4% Figure 17) after exposure to pH 3.5. However if the cells were exposed to pH 5.5 prior to exposure to pH 3.5 the number of cells with intact membrane increased significantly, 66%, 51% and 18% of the cells had intact membranes for the three different strains UA159, H7 and XAB5 (Figure 17).
Figure 16. LIVE/DEAD® BacLightTM staining of S. mutans UA159, H7 and XAB5. The control cells were kept at pH 7.5 prior to exposure to pH 3.5 for 30 minutes. The adapted cells were exposed to pH 5.5 for three hours and then exposed to pH 3.5 for 30 minutes.
There was no statistical difference in acid adaptability between UA159 and H7 while there was a difference between XAB5 and the two other strains with XAB5 being less able to adapt at pH 5.5 (P < 0.01).
Figure 17. Effect of a three hour pre-incubation in pH 5.5 MM4-medium on the subsequent survival at pH 3.5 for 30 minutes of biofilm cells of three strains of S. mutans. Control biofilms were maintained at pH 7.5. Values rep-resent the percent viable cells as shown by LIVE/DEAD® BacLightTM
staining.
Role of Fluoride in Acid Adaptation
Fluoride inhibits the glycolytic enzyme, enolase, which leads to a diminished production of ATP and the acid end-products of me-tabolism. Fluoride also inhibits the proton-translocating ATPases, which, coupled with a reduction in the intracellular concentration of ATP, affects the cell’s ability to maintain intracellular pH (44, 45, 66). Addition of 0.5M fluoride during the pH 5.5 adaptation phase reduced the number of viable cells significantly (P < 0.01) from 77% in non-treated biofilm cells to 26% in the biofilm cells treated with fluoride. Viable counts also showed large differences in the number of survivors between non-treated (87%) and treated (12%) cells (Figure 18). 0 10 20 30 40 50 60 70 80 90 100 % v iab le cel ls 7.5 7.5/3.5 5.5 5.5/3.5 UA159 H7 XAB5
Figure 18. Effect of the fluoride inhibition of glycolysis during the adaptation period at pH 5.5 on the survival of S. mutans UA159 at pH 3.5 for 30 min. Values represent the percent viable cells as shown by LIVE/DEAD® BacLightTM
staining and plating on blood agar.
5.5 5.5/3.5 0.5M NaF 5.5 0.5M NaF 5.5/3.5 0 10 20 30 40 50 60 70 80 90 100 1 % vi ab le ce ll s
Culture on blood agar
0 NaF 0.5M NaF
Additional results
Figure 19. Protein map of S. mutans. Spot names refer to Table 6. Protein spot were identified by MS or extrapolation from Len et al (58).
An autoradiogram with a summary of all the proteins identified so far was made (Figure 19). Proteins were identified in two ways:
- With MALDI-TOF in collaboration Dr Beighton’s lab at GKT Dental Institute in London and with Dr Wrezinski at The Centre for Proteomics Analysis in Odense.
- By extrapolating identifications from the protein gels in the article ‘Cellular and extracellular proteome analysis of
Streptococcus mutans grown in a chemostat’ by Len et al
Spot names were place underneath each spot. In the case of sev-eral isoforms of the same protein, the ID was place underneath the most prominent spot and the rest of the spots were numbered start-ing with no 1 on the spot furthest to the left. When isoforms were far apart spots were named with ID and number (ex dnaK4). Protein expression profiles of different strains of S. mutans
In paper IV it was shown that different strains of S. mutans had different abilities to induce an ATR. By studying the protein ex-pression profile of the three different strains UA159, H7 and XAB5 it could be seen that, although most spots were expressed in all three strains, certain proteins were present in one strain but not in the others (Figure 20).
Figure 20. Autoradiogram of protein expression profiles of S. mutans UA159, H7 and XAB5. Spots marked with solid arrows show proteins which differed between the different strains. Open arrows represent spots that are missing but present in another strain.
Figure 20. Autoradiogram of protein expression profiles of S. mutans UA159, H7 and XAB5. Spots marked with solid arrows show proteins which differed between the different strains. Open arrows represent spots that are missing but present in another str
Table 6. Spot name, protein ID and protein category of proteins identified in S. mutans. For spot location on autoradiogram see Fig. 19.
Spot
name Protein ID category Protein
10kDa 10 kDa chaperonin PF
ABC ABC-transporter protein TB
ack Acetate kinase CC
ACPe Acyl carrier protein phosphodiesterase LS
ACPr Enoyl-[acyl-carrier-protein] reductase (NADH) LS
adk Adenylate kinase E
ahpd Alkylhydroperoxidase AOx
aldo Phospho-2-dehydro-3-deoxyheptonate aldolase AA
ams S-adenosylmethionine synthetase AA
asd Aspartate semialdehyde dehydrogenase AA
asp Alkaline shock protein X
cdi Cell division protein Diva IVA D
COF COF family protein/peptidyl-prolyl cis-trans isomerase TT
cp D,D-carboxypeptidase IM
cys Cystein synthase AA
def Polypeptide deformylase TT
deo Deoxyribose-phosphate aldolase NC
div IVA Mini-cell associated protein Div IVA D
DNA bp DNA-binding protein starved cells - like peroxidase resistance R
dnaK DnaK PF
dpr DPR protein X
Ef Elongation factor TT
Ef-G Elongation factor G TT
Ef-P Elongation factor P TT
Ef-Ts Elongation factor Ts TT
Ef-Tu Elongation factor Tu TT
eno Enolase CC
exo Exopolyphosphatase E
fba Fructose 1,6-bisphosphate aldolase CC
fk Fructokinase CC
6-fk 6-phosphofructokinase CC
ftsA Cell division protein ftsA D
ftsZ Cell division protein FTSZ D
gal 6-phospho-beta-galactosidase CC
gapd Glyceraldehyde-3-phosphate dehydrogenase CC
gapd(P) [NADP]-glyceraldehyd-3-phosphate dehydrogenase CC
gdh(P) NADP-specific glutamate dehydrogenase AA
gpdA Glycerol-3-phosphate dehydrogenase IM
gpi Glucose-6-phosphate isomerase CC
groEL 60 kDa chaperonine PF
Grpe Grpe protein PF
Hpr Hpr protein CC
ino/ftl Formate tetrahydrofolate ligase AA/NS
L10P LSU ribosomal protein L10P TT
L7/L12 Ribosomal protein L7/L12 TT
ldh L-lactate dehydrogenase CC
man II PTS, mannose-specific IIAB component CC
mur N-acetylmuramoylalanine-D-glutamate ligase CW
nag N-acetyl glucosamine-6-phosphate isomerase IM
nox NADH oxidase CC
opt Orotate phosphoribosyl transferase NS
pcst 2,3,4,5-tetrahydropyridine-2-carboxylate N-succinyltransferase AA
pdh Pyruvate dehydrogenase E1 component ȕ-subunit CC
pfl Formate acetyltransferase CC
pgk Phosphoglycerat kinase CC
pgm Phosphoglycerate mutase CC
phage Single strand bidning protein phage associated X
pir Dihydrodipicolinate reductase AA
prfA Peptide chain release factor 1 TT
pro ATP-dependent protease proteolytic subunit TT
pro(ATP) ATP-dependent clp protease ATP-binding subunit TT pss Phosphoribosylaminoimidazole succinocarboxamide synthase NS
pyk Pyruvate kinase CC
RECG ATP-dependent DNA helicase RECG R
rmlC DTDP-4-keto-L-rhamnose reductase NS
rpo DNA-directed RNA polymerase Į-chain TT
rrf Ribosome recycling factor TT
S1P SSU ribosomal protein S1P TT
S2P SSU ribosomal protein S2P TT
S6P SSU ribosomal protein S6P TT
serA D-3-phosphoglycerate dehydrogenase AA
sig 42 Sigma 42 protein (rmlD) X
sod Superoxid dismutase AOx
thr Threonine synthase AA
tig Trigger factor PPIASE PF
tkt Transketolase CC
tox Thiol peroxidase AOx
tpi Triosephosphate isomerase CC
UDP UDP-N-acetylmuramoylalanyl-D-glutamate-2,6-diaminopimelate ligase/responder protein CW
upt Uracil phosphoribosyl transferase+C48 NS
Į-gl Į-glucosidase CC
CC = carbohydrate catabolism, IM = intermediary metabolism, TT = transcription/translation, PF = protein folding, R = DNA replication, AA = amino acid biosynthesis, NS = nucleic acid biosynthesis, NC = nucleic acid catabolism, LS = lipid biosynthesis, TB = transport and binding, E = bioenergetics, AOx = antioxidant, D = cell division, CW = cell wall, X = other