Bachelor’s Degree Project Malmö University
INDUCTION OF INTERFERON
BETA IN HUMAN KIDNEY
EPITHELIAL CELLS BY
VIRULENT AND NON-VIRULENT
STRAINS OF
ESCHERICHIA COLI
INDUCTION OF INTERFERON
BETA IN HUMAN KIDNEY
EPITHELIAL CELLS BY
VIRULENT AND NON-VIRULENT
STRAINS OF
ESCHERICHIA COLI
MARTIN HAMBITZER
Hambitzer M. Induction of interferon beta in human kidney epithelial cells by virulent and non-virulent strains of Escherichia coli. Degree project in
Biomedical Laboratory Science 15 Credits. Malmö University: Faculty of Health
and Society, Department of Biomedical Science, 2016.
Urinary tract infections (UTI) are a common health concern and affect millions of people. The most severe form of UTI, acute pyelonephritis (APN) is associated with serious complications. Uropathogenic Escherichia coli (UPEC) that cause APN express P fimbriae which specifically bind to glycosphingolipid molecules on the surface of urothelial cells. This triggers a toll-like receptor 4 (TLR4) mediated but LPS-independent innate immune response. The role of interferon beta (IFN-β) in bacterial infections is not well known but experiments with IFN-β knockout mice have shown an increased susceptibility and severe kidney pathology when infected with UPEC. IFN-β induction in urothelial cells in response to bacterial infection was investigated. To find out whether this response is P fimbriae dependent, A498 human kidney carcinoma epithelial cells were exposed to the P fimbriated CFT073 pyelonephritis strain or the non-virulent E.
coli 83972 asymptomatic bacteriuria strain and incubated for 1.5 and 4 hours. For
control, cells were treated with PBS alone. The IFN-β expression was analysed using immunofluorescence (IF) and confocal microscopy, and Western blot. Confocal microscopy results showed that the response to bacteria was both time- and dose-dependent. The highest IFN-β expression was detected in cells exposed to CFT073 for 4 hours, while cells exposed to E. coli 83972 showed an inverse relationship. Western blot analysis revealed that the highest expression was in the
E. coli 83972 stimulated cells. IFN-β was expressed in all cells to some degree,
including control cells. This could imply that IFN-β is induced by some other means and/or is constitutively expressed by kidney epithelial cells.
Keywords: A498 cells, acute pyelonephritis, asymptomatic bacteriuria, CFT073,
INDUKTION AV INTERFERON
BETA I HUMANA
NJUREPITELCELLER MED
VIRULENTA OCH
ICKE-VIRULENTA
ESCHERICHIA COLI
MARTIN HAMBITZER
Hambitzer M. Induktion av interferon beta i humana njurepitelceller med virulenta och icke-virulenta Escherichia coli. Examensarbete i Biomedicinsk
laboratorievetenskap 15 högskolepoäng. Malmö Högskola: Fakulteten för Hälsa
och Samhälle, Institutionen för Biomedicinsk vetenskap, 2016.
Urinvägsinfektioner (UVI) är ett vanligt hälsoproblem som drabbar miljontals människor. Den allvarligaste formen, akut pyelonefrit (APN) kan ge svåra komplikationer. Urinvägspatogena Escherichia coli (UPEC) som orsakar APN uttrycker P fimbrier som specifikt binder till glykosphingolipider på ytan av uroepitelceller. Det sätter igång en toll-like receptor 4 (TLR4) beroende men LPS-oberoende immunreaktion. Den roll som interferon beta (IFN-β) spelar vid bakterieinfektioner är inte helt klarlagd men studier som gjorts på IFN-β knockoutmöss visade på en ökad infektionsbenägenhet och svåra njursymptom vid infektion med UPEC. IFN-β uttrycket i uroepitelceller som svar på bakterieinfektion undersöktes. För att ta reda på om uttrycket är P fimbrieberoende infekterades humana A498 njurcarcinomceller med den P fimbrieförsedda pyelonefritstammen CFT073 eller den icke-virulenta asymtomatisk bakterieuristammen E. coli 83972 och inkuberades i 1,5 respektive 4 timmar. Som kontroll användes celler som enbart behandlats med PBS. Uttrycket av IFN-β analyserades med immunofluorescens (IF) och konfokalmikroskopi, samt med Western blot. Resultaten från konfokalmikroskopi visade att celler som exponerats för CFT073 under 4 timmar uttryckte mest IFN-β medan cellerna som utsatts för E. coli 83972 visade på ett omvänt förhållande. Western blot visade på högst uttryck i de E. coli 83972-behandlade cellerna. IFN-β uttrycktes i alla celler, inklusive kontrollcellerna, i någon utsträckning. Det kan betyda att IFN-β även induceras på någon alternativ väg och/eller att det uttrycks konstitutivt av njurepitelceller.
Nyckelord: A498 celler, akut pyelonefrit, asymtomatisk bakterieuri, CFT073, E. coli 83972, interferon beta, konfokalmikroskopi.
ACKNOWLEDGEMENTS
I would like to thank the Svanborg research group at the Department of Microbiology, Immunology and Glycobiology (MIG) at the Institute of Laboratory Medicine, Lund University for their generosity in providing resources, guidance, encouragement and overall allowing me free reign of their laboratory: Catharina Svanborg, Ines Ambite, Caterina Cafaro, Daniel Butler, Aftab Nadeem and Manoj Puthia.
I would also like to thank Lars Ohlsson at Malmö University for his assistance with the discussion regarding various methodological problems.
TABLE OF CONTENTS
INTRODUCTION 5
Asymptomatic bacteriuria 5 Acute pyelonephritis 5 The role of fimbriae 6 Interferon beta 6
Aim 7
MATERIALS AND METHODS 7
Materials 8
Cell preparation 8 Exposure to bacteria 8 Immunocytochemical Staining 8 Confocal imaging 8 SDS-PAGE sample preparation 8 SDS-PAGE and Western Blot 8
Statistics 9 Methods 9 Cell preparation 9 Exposure 9 Immunocytochemistry 10 Confocal microscopy 10 SDS-PAGE sample preparation 10 SDS-PAGE and Western blot 10
Statistics 11
Ethics statement 11
RESULTS 11
Confocal imaging and fluorescence quantification 11
Western blot 13
DISCUSSION 15
Conclusion 17
INTRODUCTION
Urinary tract infections (UTIs) affect millions of people of all ages worldwide each year. It is estimated that more than half of all women experience at least one UTI during their lifetime and of these women, 25 % suffer recurring infections. Urinary tract infections are also among the most common hospital-acquired infections among inpatients [1-3]. Depending on the nature of the pathogens responsible and the organs affected, UTIs can take on various forms, both symptomatic and asymptomatic. These include common lower urinary tract infections such as asymptomatic bacteriuria and bladder infection (cystitis); and the more severe febrile upper urinary tract infection that is acute pyelonephritis. In the case of acute pyelonephritis the consequences can be dire, known complications include abscess formation and renal parenchymal scarring, especially in children. This may lead to the development of hypertension and kidney failure [4-6]. Potentially life-threatening urosepsis is seen in roughly a third of adult patients; in fact UTIs are a frequent cause of bacteraemia and sepsis [7-8].
Urinary tract infections are most often caused by Gram-negative bacteria, particularly Escherichia coli (E. coli), from the faecal and perianal flora entering in to the urinary tract, where they may colonize and infect the mucosal surface [3]. Infection then triggers an immune response with cytokine and chemokine release, neutrophil recruitment and infiltration, and inflammation [4,9].
Asymptomatic bacteriuria
The term asymptomatic bacteriuria (ABU) refers to the presence of bacteria (> 105 cfu/ml) in the urine and the persistence of said bacteria in the bladder and the urethra without clinical symptoms in the host and it is the most common form of UTI [1,3,10]. ABU is common in all age groups including young children and the elderly. The frequency of bacteriuria is increased in patients with incomplete voiding of the bladder, for example due to an enlarged prostate resulting in urine retention; and in patients with indwelling urinary catheters [3,6]. Asymptomatic bacteriuria is generally regarded as harmless and is, with the exception of ABU in pregnant women, normally not treated [3].
Clinical ABU strains, like the E. coli 83972 used in this study, exhibit few, if any, virulence factors and do not provoke an immune response, but in fact have been shown to adopt a commensal-like behaviour in relation to the host. Although in possession of several virulence genes, these strains do not express these genes in the host environment; rather they actively down-regulate their expression or lose functionality of the virulence genes altogether through point mutations. Studies have also indicated that infection with ABU strains inhibits colonization of the urinary tract by virulent bacteria, thus protecting the bearer from disease [1,11-13].
Acute pyelonephritis
Acute pyelonephritis (APN) is a bacterial infection of the renal pelvis, or pyelum. APN is caused by bacteria that ascend upwards from the bladder to the kidneys [3,10]. The infection can be uni- or bilateral and is accompanied by fever and flank pain. Abscess formation caused by excessive neutrophil infiltration is common and can lead to tissue damage, scarring and necrosis if the inflammation persists, which may lead to reduced functionality in one or both kidneys. Mucosal
damage in the renal pelvis may allow bacteria to enter into the bloodstream, causing bacteraemia or sepsis [3-4,10]. Risk factors for APN include urinary tract abnormalities, such as obstructions or deformities in the urinary tract and vesicoureteral reflux; a backwards flow of urine from the bladder to the ureters and renal pelvis, which may become distended [4,10].
Many patients with acute pyelonephritis do not have defective urinary tracts, but rather develop inflammation and disease due to abnormalities of the immune response to infection. Patients who are susceptible to acute pyelonephritis carry genetic variants that affect the functions of the signalling pathways involved in the inflammatory response. For instance, two single nucleotide polymorphisms in the promotor sequence of the gene coding for the type I-interferon transcription factor interferon regulatory factor 3 (IRF3) have been identified in APN-prone patients. These polymorphisms lead to a reduced expression of IRF3 and thus greatly affect the efficiency of type I-interferon induction [1,7].
The role of fimbriae
Successful colonization and persistence of bacteria in the healthy urinary tract are largely dependent on their ability to adhere to the mucosal epithelium. Uropathogenic E. coli (UPEC) express genes coding for fimbriae, elongated protein structures that facilitate adhesion of the bacteria to the epithelial surface through special proteins, adhesins, located at the distal ends of the fimbriae. These adhesins bind to specific structures on host cell surfaces which allows the bacteria to colonize the urinary tract and to avoid getting washed away by the flow of urine [10,14].UPEC strains causing APN, like CFT073, produce special fimbriae called P fimbriae that specifically bind to glycosphingolipid receptors found on the surface of uroepithelial cells through the PapG adhesin molecules [14-15]. P fimbriae appear to be one of the principal factors in APN pathogenesis; the pap gene that codes for P fimbriae has been found in 80 % of E. coli isolates from APN patients and in 100 % of isolates from patients with bacteraemia emanating from the kidneys [14,16].
Interferon beta
Urinary tract infections primarily involve the innate immune system in the acute phase and the response to invading pathogens is controlled by the Toll-like receptors (TLR) present on the surface or in endosomes of many cell types, including epithelial cells. The binding of a ligand to these receptors generate a signal transduction cascade that activates genes encoding defensins, cytokines and chemokines [1,9]. Interferon beta (IFN-β), along with interferon alfa (IFN-α), also called type I interferons, are cytokines whose role in the defence against viral infections is well established. Viral pathogen associated molecular patterns (PAMPs) that bind to (primarily) TLR3 (double-stranded RNA) or -7 (single-stranded RNA) induce production of type I interferons, which are then secreted and act on nearby cells through the IFN-α/β receptor (IFNAR). Type I interferons induce mechanisms involved in resistance against viral replication in cells through production of proteins Mx1 and Mx2 and protein synthesis inhibition including increased mRNA degradation through RNAse L. They also activate natural killer cells, macrophages and dendritic cells, increase expression of major histocompatibility complex class I (MHC I) in all nucleated cells and induce production and release of chemokines that attract lymphocytes to the site of infection. Lastly, type I interferons also serve to increase the production of more IFN-α/β in cells [17-18].
The function of type I interferons in the defence against bacterial infections is less well known. The pattern recognition receptor primarily involved in Gram-negative infections is TLR4, which recognizes lipopolysaccharides (LPS) found in the Gram-negative cell wall [9]. Induction of inflammatory genes in response to LPS does not occur directly through TLR4, but rather require another molecule, cluster of differentiation 14 (CD14), a receptor present on the surface of macrophages, neutrophils and dendritic cells and sometimes in soluble form in serum (sCD14), to first bind the LPS. The CD14-LPS complex then interacts with TLR4 and the resulting signal cascade activates transcription factors that facilitate the production of various cytokines and chemokines [5,19]. In the case of type I interferons these transcription factors are primarily interferon regulatory factor 3 and 7 (IRF3/7). Upon activation through phosphorylation they translocate to the nucleus where they induce transcription of Ifn-α/β genes [7,20]. However, kidney epithelial cells are CD14 negative, meaning TLR4 activation by LPS would not occur [19,21].
Researchers have found an alternative means of activation that involves P fimbriae. Binding of the PapG adhesin to glycosphingolipid receptors on the cell surface activates the cleavage of ceramide, a receptor component, and the released ceramides activate TLR4, triggering an immune response [7,14]. Thus, activation of TLR4 in the kidneys appear to be P fimbriae dependent and LPS independent and therefore specific to virulent bacteria. It could be hypothesised that exposure to a non-virulent, asymptomatic bacteriuria strain of E. coli would not induce production of IFN-β in kidney epithelial cells, whereas exposure to a P fimbriated acute pyelonephritis strain would.
Several mechanisms controlling the response to infection can be compromised or non-functional because of genetic polymorphisms, with various effects on host susceptibility or resistance to disease [1]. Loss of TLR4 function or reduced expression generally leads to the absence of an inflammatory response and an inability to clear the infection, leading to a state of asymptomatic carriage as seen in ABU patients [22]. On the other hand, genetic deficiencies reducing the expression of cytokines and chemokines or their receptors can lead to an increased susceptibility to severe infections such as acute pyelonephritis [23-24]. Though little is known of the exact function of interferon beta in urinary tract infections, experiments with knockout mice have shown that Ifn-β-/- and Irf3-/- mice develop acute kidney infections with increased pathology and mortality rates after infection with the uropathogenic E. coli strain CFT073, indirectly showing the importance of this protein in host resistance [7,24].
Aim
The aim of this study is to determine if and to what extent exposure to a P fimbriated pyelonephritis strain or a non-virulent asymptomatic bacteriuria strain of E. coli would induce production of IFN-β in human kidney carcinoma epithelial cells.
MATERIALS AND METHODS
To examine levels of interferon beta produced in infected cells, the cells were stained with anti-IFN-β primary- and Alexa Fluor® 488-conjugated secondary
antibodies and visualized through fluorescence microscopy and confocal imaging. Fluorescence intensity was quantified using image-processing software. As a secondary means of verifying the presence of IFN-β, proteins extracted from lysed infected cells were separated using sodium dodecyl sulphate-polyacrylamide gel electrophoresis (SDS-PAGE) and then transferred to a polyvinylidene fluoride (PVDF) membrane. The membrane was probed with anti-IFN-β primary- and HRP-linked anti-IgG secondary antibodies and the resulting bands were detected using the ChemiDocTM XRS+ gel imaging system. Band density was quantified with image-processing software and glyceraldehyde-3-phosphate dehydrogenase (GAPDH) was used as a “housekeeping” gene (a constitutively expressed protein) to normalize IFN-β expression levels.
Materials Cell preparation
Human kidney carcinoma epithelial cell line A498 was from ATCC/LGC Standards (Manassas, USA). HyClone RPMI 1640 medium supplemented with non-essential amino acids (1 %) and sodium pyruvate (1 %), with and without 10 % foetal bovine serum was from GE Healthcare (Pittsburgh, USA). Tissue culture flask 75 and tissue culture test plate 6, 6-well were from TPP (Trasadingen, Switzerland). Millicell EZ slide 8-well chamber slides were from Merck Millipore (Billerica, USA). The CK2 light microscope was from Olympus (Tokyo, Japan). Versene (dH20 20 %, PBS 80 %, EDTA 0.2 g/L) was from the Department of
Microbiology, Immunology and Glycobiology (MIG) at the Institute of Laboratory Medicine, Lund University (Lund, Sweden).
Exposure to bacteria
Escherichia coli strains CFT073 (pyelonephritis strain) and E. coli 83972
(asymptomatic bacteriuria strain) were from MIG. Trypticase Soy Agar (TSA) plates were supplied by Substrate dept. of Clinical microbiology (Lund, Sweden). SmartSpecTM Plus Spectrophotometer was from Bio-Rad (Hercules, USA).
Immunocytochemical Staining
Rabbit anti-human IFN-β polyclonal antibodies and DRAQ5 DNA Dye were from Abcam (Cambridge, UK). Alexa Fluor® 488 goat anti-rabbit IgG antibodies were from Life Technologies (Warrington, UK). FluoromountTM Aqueous Mounting
medium and formaldehyde (3.7 %) were from Sigma-Aldrich (Saint Louis, USA).
Confocal imaging
Zeiss LSM 510 Meta laser scanning microscope and LSM 510 Software were from Carl Zeiss (Oberkochen, Germany).
SDS-PAGE sample preparation
Lysis buffer containing NP-40 (a mild detergent), with protease and phosphatase inhibitors, NanoDrop 2000c UV-Vis spectrophotometer and Pierce™ 660nm Prot ein Ass a y Reagent were from Thermo Fisher Scientific (Waltham, USA). NuPAGE® LDS Sample buffer 4x came from Life technologies (Warrington, UK). Cell scraper M disposable cell scrapers were from TPP.
SDS-PAGE and Western Blot
NovexTM NuPAGE® 4-12 % Bis-Tris Gel, 1.0 mm 10 wells, NovexTM NuPAGER 4-12 % Bis-Tris Gel, 1.0 mm 17 wells, NovexR Sharp Pre-stained protein
standard, NovexTM NuPAGE® MES SDS Running buffer 20x, NovexTM NuPAGE® Transfer buffer 20x were all from Life Technologies. AmershambTM Hybond P 0.45 PVDF membranes and AmershamTM ECLTM Prime Western
Blotting Detection Reagent were from GE Healthcare. Rabbit anti-human IFN-β polyclonal antibodies were from Abcam, anti-rabbit IgG HRP-conjugated secondary antibodies were from Cell Signalling Technology® (Danvers, USA) and
rabbit polyclonal anti-GAPDH, HRP-linked antibodies were from Santa Cruz Biotechnology Inc. (Santa Cruz, USA). The ChemiDocTM XRS+ with Image LabTM 5.1 software was from Bio-Rad. RestoreTM PLUS Western Blot Stripping
buffer came from Thermo Fisher Scientific.
Statistics
Microsoft Excel 2010 software was from Microsoft Corporation (Redmond, USA). GraphPad Prism was from GraphPad Software Inc. (La Jolla, USA). ImageJ Image processing software (freeware) was from the National Institutes of Health (Maryland, USA).
Methods
Cell preparation
A498 cells were grown in RPMI 1640 medium supplemented with sodium pyruvate (1 %), non-essential amino acids (1 %) and 10 % foetal bovine serum (FBS) in 37° C, 5 % CO2 and passaged twice a week. Prior to infection, cells were
detached with Versene, quantified in a Bürker chamber and dispensed in the wells of 6-well culture plates at a concentration of 1.5 x 10⁵ cells/ml, 2 ml/well; or 8-well chamber slides at a concentration of 1.0 x 10⁵ cells/ml, 400 µL/well and
grown for 24 hours in 37° C, 5 % CO2. The medium was removed and cells were
washed twice with medium without FBS. After washing, the appropriate volume of medium without FBS (2 ml and 400 µL, respectively) was added to each well.
Exposure
E. coli strains CFT073 and E. coli 83972 were grown on TSA plates in 37° C, 5 %
CO2 for 24 hours and were then suspended by adding 10 ml of PBS/plate and
rubbing the bacterial colonies with disposable cotton-tipped applicators, dislodging them from the agar. The resulting suspensions were then collected and added to 13 ml tubes. Bacteria were washed by centrifuging the suspensions at 4000 rpm for 10 minutes, then removing the supernatant and re-suspending the pellets in 10 ml of PBS. After diluting the bacteria (1:10), the concentrations were measured with the SmartSpecTM Plus spectrophotometer (optical density 600 nm) and the bacteria were then further diluted to the desired concentrations. For the 6-well culture plates the bacterial concentration of 1.0 x 10⁶ cfu/ml was chosen for all wells except control and the cells were infected in duplicates (same condition/2 wells). For the 8-well chamber slides three different concentrations were chosen to determine whether the cell response was dose-dependent; the concentrations were 1.0 x 10⁶, 5 x 10⁵ and 1.0 x 10⁵ cfu/ml. Cells were exposed to either
CFT073, E. coli 83972 or PBS (for control) of the different concentrations by
adding a volume of bacterial suspension or PBS equal to 1/10 of the total contents of the wells (40 µL for 8-well chamber slides and 200 µL for the 6-well plates), resulting in final bacterial concentrations of 1.0 x 10⁵, 5 x 10⁴ or 1.0 x 10⁴ cfu/ml. The two plates or chamber slides were then incubated in 37° C and 5 % CO2; one
Immunocytochemistry
Cells grown in 8-well chamber slides were fixed in 3.7 % formaldehyde, permeabilized with 0.25 % Triton X-100 (a mild detergent) in PBS + 5% FBS and incubated with rabbit anti-human IFN-β polyclonal antibodies (1:200 in PBS + 5 % FBS) at 4° C overnight with gentle agitation. The cells were then washed with PBS + 0.025 % Triton X-100 and incubated with Alexa Fluor® 488-conjugated goat anti-rabbit IgG secondary antibodies (1:200 in PBS + 5 % FBS) for 1h in room temperature (RT). The cells were counterstained with DRAQ5 DNA Dye (diluted 1:100 in PBS) [7]. As a secondary antibody control, primary antibodies were omitted in one of the control wells on each slide (1.5 h/4 h infections) and instead these wells were only treated with PBS + 5 % FBS and secondary antibodies. The slides were then prepared with a cover glass, mounted with FluoromountTM mounting medium and sealed with nail polish.
Confocal microscopy
The LSM 510 Meta laser-scanning microscope was used for imaging of stained cells. Alexa Fluor® 488 excites at a wavelength of 499 nm and emits light at a wavelength of 520 nm (green). DRAQ5 excites at 647 nm and emits at 683 nm (red light, but the display colour blue was chosen). Fluorescence intensity (green channel, integrated density) in a total of 30 cells/well was measured and quantified using ImageJ software. Both total cell fluorescence and the nuclear fraction were measured and the nuclear fraction was subtracted from the total to obtain the cytoplasmic fraction, in order to examine the intracellular distribution of IFN-β in the differently treated cells.
SDS-PAGE sample preparation
Culture plates (6-well) with infected cells were removed from the incubator and the supernatant in each well was removed and collected in 2 ml tubes. The wells were then washed twice with ice-cold PBS to remove leftover medium, bacteria and unattached cells and to stop biological processes such as protein degradation in the samples. After careful removal of all of the PBS from the wells, 40 µL of lysis buffer was added to a single well and the attached cells were scraped in to the lysis buffer with a disposable cell scraper. The cell suspension was then transferred to the duplicate well (cells infected with the same bacterial strain or PBS, under the same conditions). The cells were scraped and collected in the lysis buffer and the suspension was collected in a 1.5 ml tube and kept on ice. This was repeated for all wells/conditions. The samples were kept on ice for 30 min and vortexed regularly, after which they were centrifuged for 10 min in 4° C at 13,200 rpm. The supernatant was collected in new 1.5 ml tubes which were kept on ice or stored in -20° C. Protein concentrations were measured compared to a protein standard curve with the NanoDrop 2000c using the PierceTM 660 nm protein assay. SDS-PAGE samples were prepared by mixing the supernatants with PBS, DTT (10x) and LDS sample buffer (4x), boiling them for 5 min and centrifuging them for 1 min at 13,200 rpm. 64 µL samples with a protein content of 14 µg/sample were prepared.
SDS-PAGE and Western blot
The proteins were separated on a NuPAGE® 4-12 % Bis-Tris Gel and then transferred to a PVDF membrane. The membrane was probed with rabbit anti-human IFN-β polyclonal antibodies (diluted 1:4000 in PBS with 0.1% Tween + 5% non-fat dry-milk) and incubated at 4° C overnight with gentle agitation. The membrane was then washed with PBS with 0.1 % Tween and incubated with
anti-rabbit IgG HRP-conjugated secondary antibodies (diluted 1:4000 in PBS with 0.1% Tween + 5% non-fat dry-milk) for 1h in RT. ECL chemiluminescent detection reagent was applied to the membrane and the resulting protein bands were detected in the ChemiDocTM XRS+. IFN-β levels were quantified by densitometry using ImageJ software. To accommodate for possible differences in protein concentrations or loading volume between samples, GAPDH levels in the different samples were also quantified. The membrane was washed with PBS 0.1 % Tween, stripped of antibodies using RestoreTM PLUS Western Blot Stripping buffer and incubated with anti-GAPDH HRP-conjugated antibodies for 1h in RT. The protein bands were then detected with chemiluminescence as described previously. IFN-β expression was normalized to GAPDH and to the control.
Statistics
Unpaired t-tests (two tailed, equal variance) to compare the means of fluorescence quantification results were conducted using GraphPad Prism statistics software. A confidence interval (CI) of 95 % was chosen for statistical significance.
Ethics statement
The A498 cells used in this study were from an established commercial cell line. No ethical permission was required for their use.
RESULTS
Confocal imaging and fluorescence quantification
The IFN-β response to infection was quantified by exposing human A498 cells to the uropathogenic E. coli strain CFT073 (CFT) or the asymptomatic bacteriuria strain E. coli 83972 (ABU).
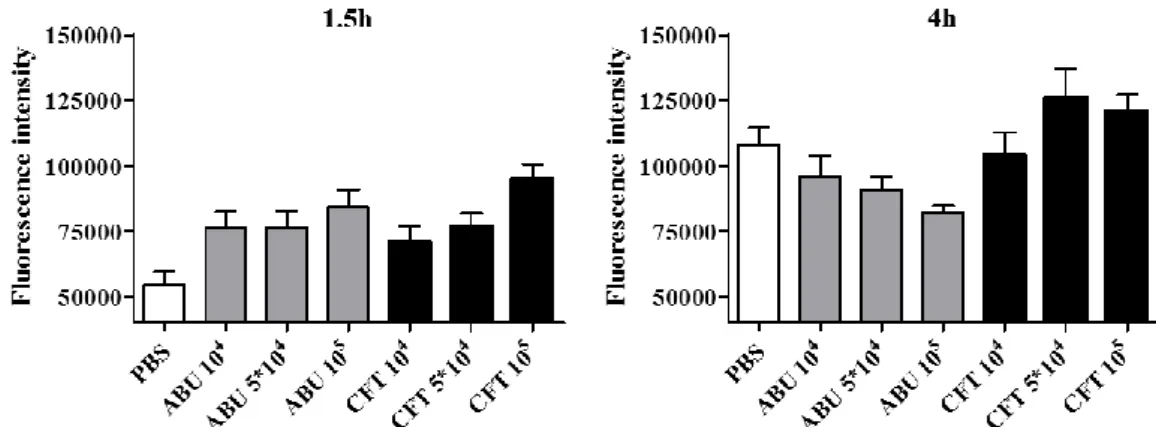
After 1.5 hours the infected cells showed significantly higher IFN-β levels compared to uninfected cells (PBS, p < 0.05). There were no significant differences (p > 0.05, not shown) between IFN-β levels in cells infected with ABU or CFT (Figure 1 and 2; Table 1 and 3).
After 4 hours, cells infected with 5 x 10⁴ and 105 cfu/ml of CFT showed elevated levels of IFN-β compared to the control but the differences were not significant (Figure 1 and 2, Table 2 and 3). In contrast, infection had reduced the levels of IFN-β in the cells treated with the two higher concentrations (5 x 10⁴ and 105 cfu/ml) of ABU compared to the uninfected cells (p < 0.05; Figure 1 and 2; Table 2 and 3).
The IFN-β response to the virulent strain (CFT) increased in a dose dependent manner. IFN-β levels increased with increasing numbers of bacteria to reach the highest levels in cells exposed to CFT for 4 hours. ABU-infected cells showed an inverse relationship to bacterial concentration, IFN-β production decreased with increasing bacterial concentrations (Figure 1 and 2; Table 1 and 2).
Figure 1. Confocal images showing interferon beta expression in cells in response to bacterial exposure. A498 cells were exposed to different concentrations (cfu/ml) of CFT073 (CFT) or E. coli 83972 (ABU) bacterial strains, or PBS as control. The cells were then incubated in 37° C for 1.5 hours (left) and 4 hours (right), fixed in 3.7 % formaldehyde and then stained for IFN-β. Green: IFN-β (Alexa488), blue: nucleus (DRAQ5). Sec. Ab Control: Secondary antibody control.
Figure 2. Fluorescence intensity (mean ± SEM of 30 cells/well) in infected A498 cells after 1.5 hours (left) and 4 hours (right) of exposure. Cells were treated with different concentrations (cfu/ml) of CFT073 (CFT) or E. coli 83972 (ABU) bacterial strains, or PBS (control); and then stained for IFN-β.
Table 1. Total cell fluorescence (mean ± SEM of 30 cells/well) and intracellular distribution of IFN-β in A498 cells exposed to CFT073 (CFT), E. coli 83972 (ABU) or PBS (control) for 1.5 hours.
Sample Total cell fluorescence (1.5h) Nuclear fraction Cytoplasmic fraction PBS 54,404 ± 5,015 15,842 (29 %) 38,563 (71 %) ABU 104 75,906 ± 6,600 22,330 (29 %) 53,576 (71 %) ABU 5*104 76,493 ± 6,073 19,497 (25 %) 56,995 (75 %) ABU 105 84,047 ± 6,748 21,121 (25 %) 62,927 (75 %) CFT 104 70,484 ± 6,349 19,001 (27 %) 51,483 (73 %) CFT 5*104 76,824 ± 4,998 19,910 (26 %) 56,914 (74%) CFT 105 95,170 ± 5,540 23,483 (25 %) 71,688 (75 %)
Table 2. Total cell fluorescence (mean ± SEM of 30 cells/well) and intracellular distribution of IFN-β in A498 cells exposed toCFT073 (CFT), E. coli 83972 (ABU) or PBS (control) for 4 hours.
Sample Total cell fluorescence (4h) Nuclear fraction Cytoplasmic fraction PBS 107,927 ± 6655 35,263 (33 %) 72,663 (67 %) ABU 104 95,932 ± 7796 25,036 (26 %) 70,895 (74 %) ABU 5*104 90,564 ± 5338 30,118 (33 %) 60,447 (67 %) ABU 105 82,062 ± 2608 25,641 (31 %) 56,421 (69 %) CFT 104 104,041 ± 8568 27,772 (27 %) 76,270 (73 %) CFT 5*104 120,437 ± 9908 37,258 (31 %) 83,180 (69 %) CFT 105 120,963 ± 6306 39,060 (32 %) 81,903 (68 %)
Table 3. Results of t-tests (unpaired) comparing fluorescence intensity in A498 cells exposed to CFT073 (CFT), E. coli 83972 (ABU) or PBS (control) for 1.5 and 4 hours. NS: not significant.
1.5 hours 4 hours
t-test p-value t-test p-value
PBS vs. ABU 104 0,012** PBS vs. ABU 104 0,2482 PBS vs. ABU 5*104 0,0078** PBS vs. ABU 5*104 0,0458* PBS vs. ABU 105 0,0008*** PBS vs. ABU 105 < 0,0001*** PBS vs. CFT 104 0,0493* PBS vs. CFT 104 0,7228 PBS vs. CFT 5*104 0,0025** PBS vs. CFT 5*104 0,2991 PBS vs. CFT 105 < 0,0001*** PBS vs. CFT 105 0,1606 ABU (all) vs. CFT (all) NS ABU 105 vs. CFT 105 < 0,0001***
ABU 105 vs. CFT 5*104 < 0,0001*** ABU 105 vs. CFT 104 0,0045**
* Statistically significant p < 0.05, ** p < 0.01, *** p < 0.001
Analysis of the intracellular distribution of IFN-β in a total of 30 cells/well showed no discernible patterns attributed to the exposure to the different bacteria, their concentrations or incubation time in regards to the localization of the protein within the cells (Table 1 and 2).
Western blot
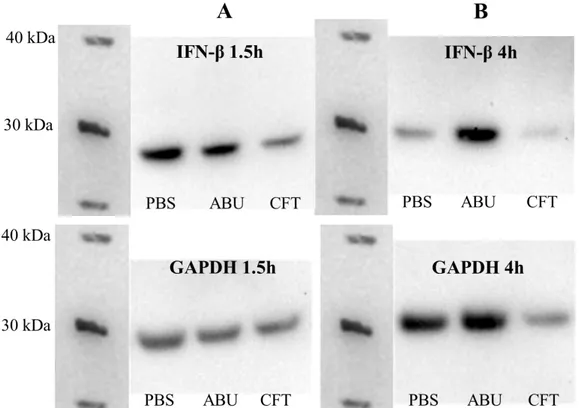
After 1.5h, the highest initial expression of IFN-β was found to be in the control cells (PBS), followed by the cells exposed to ABU. Cells infected with CFT for 1.5 hours instead showed a limited IFN-β expression (Figure 3A and 4A).
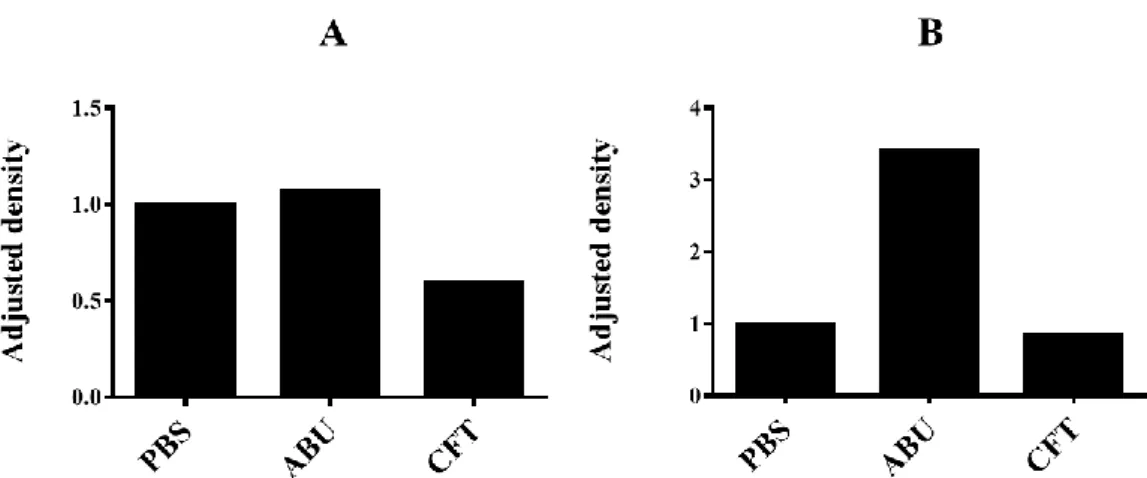
After 4 hours, expression in the control cells had decreased, while it continued to increase in the ABU-infected cells. The cells exposed to CFT showed a further decrease in IFN-β levels and total protein content compared to the control cells and ABU-infected cells after 4 hours (Figure 3B and 4B). Further, when IFN-β band densities were normalized to GAPDH and to the control (PBS) the cells exposed to ABU were found to have the highest IFN-β expression and the cells exposed to CFT the lowest expression at both time points (Figure 5A and B).
Figure 3. Western blot. Proteins were extracted from the lysate of A498 cells exposed to CFT073 (CFT) or E. coli 83972 (ABU) bacteria or PBS (control) for 1.5 hours (A) or 4 hours (B). The proteins were separated through SDS-PAGE and transferred to a PVDF membrane. The membrane was probed for IFN-β and GAPDH and the proteins were detected with chemiluminescence.
Figure 4. Quantified (raw) density of the bands on the PVDF membrane corresponding to IFN-β (top) and GAPDH (bottom) expression in A498 cells after exposure to CFT073 (CFT) or E. coli 83972 (ABU) bacterial strains, or PBS (control) for 1.5 hours (A) or 4 hours (B).
Figure 5. Fold changes (adjusted density) in IFN-β expression in infected A498 normalized to GAPDH expression and to the control cells. The cells were exposed to CFT073 (CFT) or E. coli 83972 (ABU) bacterial strains, or PBS (control) and incubated for 1.5 hours (A) or 4 hours (B).
DISCUSSION
It was the aim of this study to examine whether IFN-β is induced in kidney epithelial cells in response to virulent (P fimbriated) E. coli infection and if a non-virulent strain would enhance or suppress IFN-β levels in infected cells.
By confocal microscopy, dose and time dependent increases in IFN-β levels after infection with the virulent strain were detected. There was a correlation between IFN-β expression and prolonged exposure to, and increasing amounts of, virulent bacteria in the exposed cells. Uninfected cells showed lower IFN-β expression levels. In contrast, infection with the ABU-strain gave a biphasic response, with an initial upregulation followed by a decrease in IFN-β levels with increased exposure time and bacterial concentrations. These findings are consistent with observations made in previous studies, where the activation of Type I IFN responses and IFN-β were found to increase after infection with uropathogenic E.
coli [7]. The identified mechanism was nuclear translocation of transcription
factor IRF3/IRF7 resulting in the activation of IFN-dependent genes and protein expression. Patients with genetic variants in IRF3 and IFN-β affecting the expression or function of IFN-β are more susceptible to severe urinary tract infections [7,24]. The seemingly inhibitory effect of the ABU strain over time also agreed with previous studies, showing that ABU inhibits RNA polymerase II-dependent gene expression, including IFN-β and Type I IFN responses. This effect was biphasic with an initial increase, suggesting a regulatory event that remains to be identified [25].
Because there appeared to be differences in the distribution of interferon beta between the cytoplasm and the nucleus observed during microscopy, the nuclear and cytoplasmic fractions in the cells were measured and compared. Unfortunately no significant differences in distributional patterns caused by infection with different strains or concentrations of bacteria or variations in exposure time were observed, as shown in tables 1 and 2.
Based on results from previous studies showing increased activation and nuclear translocation of transcription factor IRF3 in response to uropathogenic E. coli; and
the increased susceptibility to severe urinary tract infections among patients with deficiencies in IRF3 and IFN-β expression or function, it seems reasonable that interferon beta expression would increase in cells infected with CFT073 compared to those infected with E. coli 83972 and uninfected cells, as confocal microscopy results showed [7]. It seems obvious from the results that induction of IFN-β in kidney cells, at least in vitro, may occur by some alternative or additional means to the interaction of P fimbriae with cell surface receptors, since the cells exposed to E. coli 83972 and the control cells also showed IFN-β expression. This alternative mechanism(s) may well be TLR4-independent, since ABU strains lack expression of fimbriae and A498 cells are CD14 negative, as previously mentioned [13,21].
Studies have shown that epithelial cells regularly facing environmental challenges, including low-virulent or commensal microorganisms, sometimes
constitutively express interferon beta, even without active induction through
pathogen derived signalling [26-27]. This appears to be an important “fail-safe” mechanism to quickly induce the transcription of interferon-inducible genes in order to limit viral replication in infected cells in some viral infections that inhibit the “normal” inducible IFN-β expression [26]. Since IFN-β has extensive immunomodulatory and anti-inflammatory functions, constitutive expression in
vivo might serve to limit spontaneous inflammation in tissues that are more
frequently damaged or replaced, like surface/mucosal epithelia. IFN-β has even been suggested to serve a function in regulating tissue growth homeostasis [27-29]. These findings could perhaps explain the expression of IFN-β that was evident in this study in both the cells exposed to the ABU strain and the control cells, in addition to the CFT infected cells. The kidney cells are not in their natural environment and being washed, passaged and poured into and grown in culture-plates and chamber slides could be considered “environmental challenges”.
The results of the Western blot indicated the highest relative expression in the ABU-treated cells after both lengths of exposure, while IFN-β expression in the cells exposed to CFT remained the lowest throughout. The CFT-infected cells also showed a decrease in total protein content after 4 hours, which may suggest a loss of cells during infection. Despite efforts to normalize protein concentrations in the samples, it is possible the amount of protein loaded in each well was not the same. In an effort to determine the presence of secreted IFN-β in the 6-well culture plates that may have been lost when the supernatants were removed and which could perhaps account for some of the differences, the respective supernatants from the wells were filtered through sterile filters to remove bacteria, dead or detached cells and cell debris and collected in new 2 ml tubes. Proteins were precipitated through trichloroacetic acid and acetone precipitation. The samples (pellets) were then run on a NuPAGE® 4-12 % Bis-Tris Gel and the proteins
transferred to a PVDF membrane which was probed for IFN-β. Unfortunately all blots turned out negative for any IFN-β, perhaps the protein contents in the samples were just not high enough to yield any visible bands. To ensure that protein yields from infected cells were as large as possible, Brefeldin A or an equivalent could have been added to the wells. Brefeldin A inhibits protein transport between the endoplasmic reticulum and the Golgi complex, effectively trapping all proteins within the cells [30]. For analysis of the IFN-β contents of the supernatants, enzyme-linked immunosorbent assay (ELISA) might also have
been a quicker and easier alternative to Western blot, but unfortunately no kits were available.
When working with antibodies there is always the risk of unspecific interaction between antibodies and the sample. Polyclonal antibodies are produced in donor animals inoculated with the protein (antigen) in question and are the result of many B-cell clones encountering the same antigen but reacting to different
epitopes on the antigen; they are antigen specific, not epitope specific. This means
that there is a greater possibility of unspecific binding of antibodies to another molecule than the antigen because this other molecule could theoretically contain regions resembling these epitopes in structure [31]. In immunofluorescence (IF) the protein of interest is in its native form in (or on) the cells, while in the SDS-PAGE sample preparation process the proteins are denatured, basically reverting to straight amino acid sequences [31]. Any epitope derived from the three-dimensional shape of the protein would be lost which would result in fewer or no antibodies binding and no detection. Given that polyclonal antibodies by nature are more “unspecific” however, it is not entirely unlikely that denatured proteins may actually present alternative or even more epitopes instead of fewer, resulting in more antibodies binding to other proteins. The same polyclonal primary antibodies to interferon beta were used in both IF and Western blot; according to the product datasheet they work in both applications [32]. Additional bands due to unspecific binding were observed on the membrane and it is possible that this also occurred in the immunocytochemical staining of cells for IF. Either way, an increase or decrease in the detected “signal” because of unspecific or reduced binding would most likely affect all samples/cells in any one experiment to an equal degree and would then not explain the apparent differences in expression in the different cells between Western blot and IF results. Without repeat experiments, it is not possible to verify the validity of the data obtained from the Western blot results.
Conclusion
The results show that human kidney epithelial cells constitutively express IFN-β and that bacterial infections appear to regulate IFN-β expression in those cells to a certain degree.
REFERENCES
1. Ragnarsdóttir B, Lutay N, Grönberg-Hernandez J, Köves B, Svanborg C (2011) Genetics of innate immunity and UTI susceptibility. Nature Reviews
Urology 8, 449–468
2. Cardwell S M, Crandon J L, Nicolau D P, McClure M H, Nailor M D (2016) Epidemiology and economics of adult patients hospitalized with urinary tract infections. Hospital Practice 44(1), 33-44
3. Brauner A, (2015) Urinvägsinfektioner I: Brauner A, Arvidson S, Blomberg J, Castor B, Falk K, Kärre K, Linde A, Thelestam M, (Red) Medicinsk
mikrobiologi och immunologi. Lund: Studentlitteratur, s 723-728
4. Kumar V, Abbas A K, Fausto N, Mitchell R N (2007) Robbin’s Basic
Pathology. 8th edition, Philadelphia, PA: Saunders Elsevier
5. Webb N, Brenchley P (2004) Cytokines and Cell Adhesion Molecules in the Inflammatory Response during Acute Pyelonephritis. Nephron Experimental
Nephrology, 96, e1-e6
6. Ansari B M, Jewkes F, Davies S G (1995) Urinary Tract Infection in Children Part I" Epidemiology, Natural History, Diagnosis and Management. Journal
of Infection, 30, 3-6
7. Fischer F, Lutay N, Ragnarsdóttir B, Yadav M, Jönsson K, Urbano A, Al Hadad A, Rämisch S, Storm P, Dobrindt U, Salvador E, Karpman D, Jodal U, Svanborg C (2010) Pathogen Specific, IRF3-Dependent Signaling and Innate Resistance to Human Kidney Infection. PLoS Pathogens, 6 (9), 1-17
8. Brauner A, (2015) E. coli I: Brauner A, Arvidson S, Blomberg J, Castor B, Falk K, Kärre K, Linde A, Thelestam M, (Red) Medicinsk mikrobiologi och
immunologi. Lund: Studentlitteratur, s 234-249
9. Abbas A K, Lichtman A H (2011) Basic Immunology. Functions and
Disorders of the Immune System. 3rd edition, Philadelphia, PA: Saunders Elsevier
10. Schaechter M, Engleberg N C, Eisenstein B I, Medoff G (1998) Mechanisms
of Microbial Disease. 3rd edition, Baltimore, MD: Williams & Wilkins
11. Sundén F, Håkansson L, Ljunggren E, Wullt B (2006) Bacterial
interference—is deliberate colonization with Escherichia coli 83972 an alternative treatment for patients with recurrent urinary tract infection?
International Journal of Antimicrobial Agents, 28S, 26–29
12. Zdziarski J, Brzuszkiewicz E, Wullt B, Liesegang H, Biran D, Voigt B, Grönberg-Hernandez J, Ragnarsdottir B, Hecker M, Ron E Z, Daniel R, Gottschalk G, Hacker J, Svanborg C, Dobrindt U (2010) Host Imprints on Bacterial Genomes—Rapid, Divergent Evolution in Individual Patients. PLoS
13. Hull R A, Rudy D C, Donovan W H, Wieser I E, Stewart C, Darouiche R O, (1999) Virulence Properties of Escherichia coli 83972, a Prototype Strain Associated with Asymptomatic Bacteriuria. Infection and Immunity, 67(1), 429-432
14. Wullt B, Bergsten G, Samuelsson M, Svanborg C, (2002) The role of P fimbriae for Escherichia coli establishment and mucosal inflammation in the human urinary tract. International Journal of Antimicrobial Agents, 19, 522-538
15. Welch R.A, Burland V, Plunkett G, Redford P, Roesch P, Rasko D, Buckle E.L, Liou S-R, Boutin A, Hackett J, Stroud D, Mayhew G.F, Rose D.J, Zhou S, Schwartz D.C, Perna N.T, Mobley H.L.T, Donnenberg M.S, Blattner F.R (2002) Extensive mosaic structure revealed by the complete genome sequence of uropathogenic Escherichia coli. PNAS, 99(26), 17020-17024
16. Brauner A, Leissner M, Wretlind B, Julander I, Svenson S.B, Kallenius G (1985) Occurrence of P-Fimbriated Escherichia coli in Patients with Bacteremia. European Journal of Clinical Microbiology, 4(6), 566-569 17. Murphy K P, (2012) Janeway’s Immunobiology. 8th edition, New York, NY:
Garland Science, Taylor & Francis Group
18. Hokland M, Basse P, Justesen J, Hokland P, (1988) IFN-induced modulation of histocompatibility antigens on human cells. Cancer and Metastasis
Reviews, 7, 193-207
19. Schilling J D, Martin S M, Hunstad D A, Patel K P, Mulvey M A, Justice S S, Lorenz R G, Hultgren S J (2003) CD14- and Toll-Like Receptor-Dependent Activation of Bladder Epithelial Cells by Lipopolysaccharide and Type 1 Piliated Escherichia coli. Infection and immunity, 71(3), 1470-1480 20. Sakaguchi S, Negishi H, Asagiri M, Nakajima C, Mizutani T, Takaoka A,
Honda K, Taniguchi T (2003) Essential role of IRF-3 in lipopolysaccharide-induced interferon-b gene expression and endotoxin shock. Biochemical and
Biophysical Research Communications, 306, 860-866
21. Frendéus B, Wachtler C, Hedlund M, Fischer H, Samuelsson P, Svensson M, Svanborg C (2001) Escherichia coli P fimbriae utilize the Toll-like receptor 4 pathway for cell activation. Molecular Biology, 40(1), 37-51
22. Ragnarsdóttir B, Jönsson K, Urbano A, Grönberg-Hernandez J, Lutay N, Tammi M, Gustafsson M, Lundstedt A-C, Leijonhufvud I, Karpman D, Wullt B, Truedsson L, Jodal U, Andersson B, Svanborg C (2010) Toll-Like
Receptor 4 Promoter Polymorphisms: Common TLR4 Variants May Protect against Severe Urinary Tract Infection. PLoS ONE, 5(5), 1-13
23. Lundstedt A-C, McCarthy S, Gustafsson M, Godaly G, Jodal U, Karpman D, Leijonhufvud I, Lindén C, Martinell J, Ragnarsdóttir B, Samuelsson M, Truedsson L, Andersson B, Svanborg C (2007) A Genetic Basis of
24. Ragnarsdóttir B, Svanborg C (2012) Susceptibility to acute pyelonephritis or asymptomatic bacteriuria: Host–pathogen interaction in urinary tract
infections. Pediatric Nephrology, 27, 2017-2029
25. Lutay N, Ambite I, Grönberg Hernandez J, Rydström G, Ragnarsdóttir B, Puthia M, Nadeem A, Zhang J, Storm P, Dobrindt U, Wullt B, Svanborg C (2013) Bacterial control of host gene expression through RNA polymerase II.
The Journal of Clinical Investigation, 123(6), 2366–2379
26. Bielenberg D R, Fidler I J, BucanaC D (1998) Constitutive Expression of Interferon Beta in Differentiated Epithelial Cells Exposed to Environmental Stimuli. Cancer Biotherapy & Radiopharmaceuticals, 13(5), 375-382 27. Hsu A C-Y, Parsons K, Barr I, Lowther S, Middleton D, Hansbro P M, Wark
P A-B (2012) Critical Role of Constitutive Type I Interferon Response in Bronchial Epithelial Cell to Influenza Infection. PLoS ONE, 7(3), 1-14 28. Kasper L H, Reder A T (2014) Immunomodulatory activity of interferon-beta.
Annals of Clinical and Translational Neurology, 1(8), 622-631
29. Kuo P-C, Scofield B A, Yu I-C, Chang F-L, Ganea D, Yen J-H (2016)
Interferon-β Modulates Inflammatory Response in Cerebral Ischemia. Journal
of the American Heart Association, 5, 1-16
30. eBioscience (2016) Brefeldin A Solution (1000X)
>http://www.ebioscience.com/brefeldin-a-solution.htm< (2016-03-24) 31. Wilson K, Walker J, (2011) Principles and Techniques of Biochemistry and
Molecular Biology. United Kingdom: Cambridge University Press.
32. Abcam (2016) Anti-Interferon beta antibody ab85803.
>http://www.abcam.com/interferon-beta-antibody-ab85803.html< (2016-03-11)