Examensarbete 15 högskolepoäng, grundnivå
Optimal placering av stroke-ambulanser för att uppnå förbättrad
strokevård
Optimal placement of a Mobile Stroke Unit (MSU) to achieve improved stroke care
Oliver Dahllöf
Felix Hofwimmer
Examen: kandidatexamen 180 hp Handledare: Johan Holmgren
Huvudområde: datavetenskap Examinator: Gion Koch Svedberg
Program: Informationsarkitekt, Systemutvecklare
Sammanfattning
Tid till behandling är livsviktigt för människor som får en stroke. På olika platser i världen har man därför sett värdet i att införskaffa en specialambulans för stroke (stroke-ambulans) som har specialutrustning och specialpersonal som kan utföra intravenös behandling (trombolys). Då det är uppenbart att dess involvering i vården skulle hjälpa åtminstone en viss andel patienter används ofta ingen utvecklad metod eller analys av var och hur denna stroke-ambulans ska placeras. Genom att noggrant undersöka läget i Skåne län om hur denna placeringen kan gå till, är vårt mål att genom vår metod, som bygger på optimering av förväntade transporttider, upplysa beslutstagare om olika perspektiv man bör ta hänsyn till. Vår metod kan användas över olika geografiska områden.
Vi föreslår en optimeringsmetod som utgår från två olika perspektiv: effektivitet och jämlikhet. Metoden visar att beroende på vilket perspektiv man väljer, kan den optimala placeringen för ett givet område variera kraftigt. Det är därför viktigt att beslutstagare av placering för stroke-ambulanser har tydliga och väl genomtänkta mål. Dessa mål bör även innefatta de lokala sjukhusens mål när det kommer till förbättring av behandlingstiden för strokepatienter, s.k. door-to-needle-time (DTN) då dessa i vissa fall kan göra större förbättringar än vad en införskaffning av en stroke-ambulans skulle göra.
Nyckelord − specialambulans, MSU, stroke-behandling, stroke, behandlingstid, DTN, trombolys, placering, positionering
Abstract
The time to treatment is vital for people who suffer from a stroke. Therefore, in different places in the world, the value of acquiring a specially developed ambulance for a stroke (i.e., a Mobile Stroke Unit, MSU) with special equipment and specialists who can perform intravenous treatment (thrombolysis) has been identified. Since it is clear that an MSU’s involvement in health care would aid at least a certain proportion of the patients, the MSU is often purchased and placed without any developed method or analysis of where and how this MSU is to be placed. By carefully examining the situation in Skåne Municipality of how this placement could be performed, we will inform decision makers about different perspectives that should be taken into consideration, including other areas than Skåne.
Our optimization method showed that depending on what perspective you are investing, efficiency or equality, the optimal placement for any given area can vary greatly. It is therefore important that decision-makers of MSU purchases have clear and well-thought-out goals. These goals should also include the goals of the local hospitals when it comes to improving the treatment time for stroke patients, door-to-needle (DTN), as the DTN may in some cases make greater improvements than a purchase of an MSU would.
Keywords - mobile stroke unit, MSU, stroke treatment, stroke, door-to-needle, DTN, thrombolysis, placement, location
Table of contents
Sammanfattning 1 Abstract 2 Table of contents 3 1. Introduction 5 1.1 Purpose 5 1.2 Objective 5 1.3 Background 5 1.4 Related work 7 1.5 Research questions 8 2. Methodology 9 2.1 Motivation of methodology 9 2.1.1 Expected value 10 2.2 Perspective description 11 2.2.1 Equality perspective 12 2.2.2 Efficiency perspective 122.2.3 Motivation for perspectives 12
2.3 Data collection 12 2.3.1 Sources 12 2.3.2 Data schema 12 2.3.3 Tools 14 2.4 Limitations 15 2.5 Threats to validity 16 2.6 Data analysis 16 2.7 Literature study 17 3 Results 18 4 Analysis 24 4.1 General analysis 24 4.2 Efficiency perspective 24 4.3 Equality perspective 25 5 Discussion 26 5.1 Efficiency vs equality 26 5.2 Additional discussion 27
6 Conclusion and future studies 30
6.1 Future studies 30
References 31
Appendix A (data) 33
Appendix B (Literature study) 37
Search phrases, filters and number of results 37
Name of literature and how it was found 37
1. Introduction
In Sweden, approximately 30.000 people have a stroke annually [6]. The effectiveness of intravenous thrombolysis treatment is time dependent, which makes the time from illness to treatment crucial for the patient's ability to recover after a stroke. The treatment is more efficient if the time from symptom onset to treatment is within 60 minutes, termed the golden hour [5]. Correct and timely diagnosis and treatment is of great importance for the individual’s recovery and for the society. A fast treatment reduces the recovery time for a stroke patient and has substantial long-term societal cost annual savings in the range of 200.000 - 400.000 SEK per patient treated [1].
The use of mobile stroke units (MSUs) has become an interesting alternative option for prehospital care and could potentially reduce the time to treatment for patients [2], making the golden hour a reality for many more patients, helping them recover faster and thereby minimize the suffering of the individual and the costs of the society.
1.1 Purpose
The purpose of our work is to contribute to improve the logistics concerning stroke patients, and in that way contribute to the improved treatment and life situation for stroke patients.
1.2 Objective
Our objective is to design a mathematical model to look at the potential benefits an MSU could have within a specified geographical area. The model could be used as a decision support for municipalities and states looking to invest in MSUs and thereby potentially reduce the time to treatment within their specified geographical area.
1.3 Background
In average, every 17th minute someone gets a stroke in Sweden [6]. The consequences range from death to full recovery, but the time to treatment is absolutely crucial for the patient's ability to recover. Stroke is the most costly medical condition and costs the Swedish society about 16 billion SEK annually [6]. The most effective solution to the problem is to minimize the damage on the individual’s brain and the cost on society by reducing the time to treatment as much as possible. For every minute that the brain is blocked by a blood clot, the brain loses 2 million brain cells and ages around three weeks [6]. Today, many logistical challenges stands in the way of the goal of treating stroke patients within 60 minutes. Transport of patients and slow door-to-needle times (the time between a patient's arrival at a hospital and treatment started) consumes a lot of very important time for the stroke patients. The hospitals’ goal is to help stroke patients get a door-to-needle time of 40 minutes [6]. This means that the hospital has a goal of starting the treatment with thrombolysis
within 40 minutes after the patients arriving to the hospital. In a perfect scenario then, the patient would have to be picked up and transported to a hospital within 20 minutes with an ambulance to get the needed treatment within the first 60 minutes. With the current logistical system it is essentially impossible to provide treatment within this golden hour. In the great majority of cases, hospital door-to-needle times are greater than 40 minutes and closer to 80 minutes at some hospitals (as seen in Appendix A), leaving some stroke patients without treatment for upwards 140 minutes.
The use of a specialized mobile stroke unit (MSU) has become an interesting alternative to help stroke patients get faster treatment [2]. The MSU is a specialized stroke ambulance equipped with a computed tomography scanner (CT scanner) that scans and provides pictures of the brain, allowing the ambulance team to quickly assess if a patient is having a stroke and what type of stroke it is. If it is determined that a patient is having a stroke caused by a blood clot, the tissue plasminogen activator (tPA), a protein involved in breaking down blood clots, can be administered immediately to start an intravenous thrombolysis. This treatment aims to resolve the blood clot. The MSU can provide treatment as soon as the patient is picked up, cutting down the time of transport and eliminating the varying door-to-needle times of the hospitals.
In cases were the blood clot is big and the thrombolysis is unsuccessful in breaking down the clot, the patient can undergo a surgical removal of the clot called thrombectomy. This treatment needs specialized competence and it is only provided by a few hospitals in Sweden. With the current logistical system, patients with the need of thrombectomy lose even more time since only few specific hospitals provide this type of treatment. This means that distances are greatly increased and causes hours of logistical delays for some patients. In this thesis we will only focus on the time it takes for patients to get a thrombolysis without looking further into the difference an MSU would do for patients in need of a thrombectomy. However, the use of an MSU is expected to yield great results for patients in need of a thrombectomy since patients can be diagnosed faster. Patients can be brought to a thrombectomy center directly from their home without the time consuming process of going through a regular clinic to do the CT scan and diagnosis first. This should be further studied to calculate the potential impact an MSU would have on reducing transport times for those in need of a thrombectomy.
The use of MSUs has been studied in Berlin, Germany and showed a decreased time to treatment without an increase in adverse events [2]. Based on the results of earlier studies showing decreased time to treatment and substantial long-term savings for the society with shorter treatment time, this thesis aims to develop a method of assessing where a placement of an MSU could be within a specific geographic area based on two different perspectives. One of the perspectives is to look at how the MSU will contribute to more equal care for stroke patients within a municipality. From this perspective we look at how an MSU can shorten the time to thrombolysis for patients that live in rural areas, far from clinics with thrombolysis. From the other perspective we looked at
effectiveness, i.e., where should we place the MSU in order to help as many stroke patients as possible to get a shorter time to thrombolysis?
1.4 Related work
In previous work related to stroke and treatment there has been great evidence showing the importance and benefits of a fast diagnosis and treatment. Randomised controlled trials in Sweden concludes the great benefits for an individual and the great societal cost savings that can be made by offering fast and correct treatment with thrombolysis and thrombectomy [1]. Saver et al. [3] underline the importance of finding better and faster ways to help stroke patients get access to fast thrombolysis. They conclude that “earlier thrombolytic treatment was associated with reduced mortality and symptomatic intracranial hemorrhage, and higher rates of independent ambulation at discharge and discharge to home following acute ischemic stroke”.
The most relevant study for this thesis is the study made in Berlin, Germany [2] that concludes that the use of an MSU decreases the treatment time of patients by 25 minutes in Berlin, without any increase in adverse events. Berlin is one of very few cities where an MSU has been widely used and studied. Another study made in Berlin [5] also shows that the percentage of patients that received thrombolysis within the golden hour increased with the use of an MSU. Time savings have been observed in other places as well. A small trial in Norway concluded that the use of a mobile CT scanner used in an MSU could greatly decrease the time for patients living in rural areas by correctly diagnosing and transporting patients to the correct clinic without logistical delays. In their trial the patients lived between 45-160 km from the closest neurosurgical department and by correctly diagnosing the patients’ stroke before being transported to a hospital they saved 2-2.5 hours of pre-neurosurgical time [11].
Ambulance location and relocation models have been studied and modelled over the last 30 years [12]. “Deterministic models are used at the planning stage and ignore stochastic considerations regarding the availability of ambulances. Probabilistic models reflect the fact that ambulances operate as servers in a queueing system and cannot always answer a call. In addition, dynamic models have been developed to repeatedly relocate ambulances throughout the day ” [12]. Optimization and simulation models have also been developed to not only maximize availability but the survival rate of patients with cardiac arrests [13,14]. These models study the outcome of optimizing fleets of ambulances and the location of the base stations to achieve maximum survival [14]. No published study or work has been done on the optimal placement of an MSU. With the use of a single MSU as in our studied case, a new model will be proposed as a way to find the optimal placement.
1.5 Research questions
The questions listed in table 1 below together form the research questions (RQ) of our study:
○ RQ1: How can expected value optimization be used in order to compare the possible benefits of an MSU compared to today’s situation?
○ RQ2: What is the optimal placement of an MSU in order to reduce the time to treatment for the stroke patients in the rural areas of Skåne?
○ RQ3: What is the optimal placement of an MSU in order to reduce the time to treatment for the highest amount of stroke patients in Skåne?
Table 1: Research questions for optimizing placement of an MSU.
2. Methodology
The main purpose of this study is to contribute to reduced time from illness, i.e., showing symptoms of stroke to treatment for stroke patients. Below we present our methodology that can be used to predict the effects of stroke ambulance transport logistics and decision-making principles, including opportunities for care of stroke patients in the ambulance.
We used the methodology to gather concrete knowledge about a range of actions that are expected to lead to improved stroke logistics, such as the use of ambulances equipped with the tools to accurately examine and fully treat patients inside the ambulance.
2.1 Motivation of methodology
We started looking at different mathematical functions that could take the following attributes into account; likelihood for the need of an ambulance in every municipality and time to care for patients. The reasoning behind this was that we needed to efficiently assess the situation of a particular geographic area, in our case Skåne, based on the data provided to us as well as to produce values that are easily comparable, i.e., using an MSU compared to not using one.
Other methods considered were simulation and modelling, in particular micro-level simulation approaches such as discrete event simulation [7]. These methods could consider alternate transportation modes, costs, and ambulance pickup windows but would demand a patient population to be simulated over time in order to deliver a high level of accuracy. Based on the data provided and collected by us we made the decision that we could not accurately recreate the state of ambulance logistics today in a fulfilling way. We arrived at this conclusion by analysing available data and after discussion with a stroke specialist from Skåne University Hospital.
Lastly we considered using an interview method. This could be useful since experts and doctors have a first hand experience which data cannot always replicate and therefore could potentially lead to a more accurate methodology. We took inspiration from this method by working with a neurologist from Skåne University Hospital but we mainly based our research on a quantitative, neutral method for estimating logistic improvements which the interview method could not provide us with.
By instead using a purely mathematical function to produce values based on time to care combined with the likelihood of stroke events, we could break down the components of ambulance logistics and look at isolated improvements for municipalities. However, this method generated some limitations, which are listed in Section 2.4.
Once we decided to look at mathematical functions, where mainly three different ones were considered; using likelihood based on amount of cases, logistic regression, and expected value. Only using likelihood based on amount of cases proved to be too simplified since we also had to take into account for the time to care for patients living in rural areas.
Logistic regression essentially shows how a probability grows when a factor changes, e.g. in order to show how a patient’s age increases will increase the probability of having a stroke. But after discussing the data provided and collected by us with a specialist from Skåne University Hospital it proved more useful using likelihood based on amount of cases combined with the total time to care for patients which is in mathematical terms called expected value.
Researching different optimization methods helped us to ultimately arrive at our research question RQ1 listed above, i.e., “How can expected value optimization be used in order to compare the possible benefits of an MSU compared to today’s situation?”.
2.1.1 Expected value
Expected value was posed in 1654 to Blaise Pascal by French writer and amateur mathematician Chevalier de Méré [8] . It has since then been used in multiple fields but specifically to determine the long-run average value of repetitions of the experiment it represents. The simplest way of describing the expected value can be illustrated with the case of a dice. A perfect dice has six sides (showing the numbers 1-6) with the same probability for each side to turn up when throwing the dice, resulting in the expected value:
[X] 1 3.5
E = × ⅙ + 2 × ⅙ + 3 × ⅙ + 4 × ⅙ + 5 × ⅙ + 6 × ⅙ =
Table 2: Equation of expected value for a perfect dice.
The equation above shows that the expected value for a perfect dice is 3.5 which means that it is the average number to expect when rolling a dice multiple times over a long time. Obviously, 3.5 is not a value on a dice but it effectively gives you a decent estimation of what average value to expect when different values have its own probability.
In our case we have different values all together. If we were to create our own dice based on the example above it would have 33 sides (one for each municipality in Skåne). The value on each side would then be the total time (in minutes) a patient will have to wait in order to receive care. Malmö Municipality has 78 minutes, for example. Lastly, instead of having the same probability of occuring like in the perfect dice example above, our 33-side dice will have a different likelihood on each side. We are using likelihood and not probability since we are examining how plausible it is a person would need care in a municipality based on observed data. Looking at all stroke cases in Skåne, there is roughly a 21% chance for it to happen in Malmö which would be the likelihood for the Malmö side on our dice. In this study we are looking at the expected value on the entirety of Skåne but if we were too look at the expected value of three fictional municipalities with the following values it could look like this:
Municipality 1: 10 minutes, 10% likelihood
Municipality 2: 20 minutes, 20% likelihood
[X] 10 .1 20 .2 30 .7 6
E = × 0 + × 0 + × 0 = 2
Table 3: Expected value of a number of municipalities.
The percentage of likelihood means that if a person gets a stroke in the area of these three municipalities it is most likely in municipality 3, not that people living in municipality 3 all have a 70% risk of stroke.
This example shows us that 26 minutes is the expected value of the three municipalities and allows us to easily compare to other expected values based on which perspective we considering.
2.2 Perspective description
To achieve a relevant placement for the MSU, our first step was to observe the problem from two different perspectives. The first perspective being how an MSU will contribute to increasing equal care for stroke patients within Skåne. The second perspective being efficiency, i.e. where will the MSU have the biggest positive impact.
In order to fully investigate a perspective, we added three additional states to each perspective which we also compare to each other. These are the following:
1. The state of today - this state represents the data as it was collected (from 2016). Some data is added (estimations) but nothing is changed.
2. Hospital goal - this state changes one value from the real data (the state of today), which is the time in minutes it takes for patients to receive care once they have reached the hospital (also known as door-to-needle). The hospital goal for Skåne is 40 minutes for each hospital. We use this state in order to compare whether an MSU would help more than a hospital simply improving their routines.
3. Performance of an MSU - lastly, we look at how an MSU would affect an area. This state essentially replaces the time to care with the estimated time of an MSU (total time 40 minutes). We use this state both to look at how much an MSU could affect the state of today as well as what role it would play if all hospitals improved their routines to the hospital goal time.
2.2.1 Equality perspective
From this perspective we look at how an MSU can shorten the time to thrombolysis for patients that live in rural areas, far from clinics with thrombolysis. By doing so, the goal is to offer new effective stroke treatment to all patients regardless of the place of residence, which will result in a more evenly spread coverage for Skåne. The most significant number for equality is average minutes for help and treatment of the entirety of Skåne without looking at any sort of likelihood.
2.2.2 Efficiency perspective
Based on all the factors being investigated during this study, where can the MSU be placed to make the biggest difference and potentially help a higher amount of people? This perspective is based on likelihood in the form of an expected value, which is explained below. Phrased simply, if an area has a significantly higher amount of cases per year it will most likely rank higher in our model. However, it is important to note that if two cities in an area have a similar amount of cases per year, other factors would decide where the MSU should be placed.
2.2.3 Motivation for perspectives
The two considered perspectives are widely discussed in Sweden [9][10]. Both are clearly relevant to investigate when an important decision such as placement of an MSU is being made. Our presumption was that people living in big cities would be significantly prioritized since it most likely is more cost-effective to focus on the bigger cities with a higher amount of people. This assumption led us to believe that if an MSU was purchased, efficiency would be the preferred perspective of the purchaser. Therefore we also wanted to assess the situation of the less fortunate when it comes to stroke treatment, i.e., corresponding to the equality perspective.
2.3 Data collection
In this section we describe the data used in this study.
2.3.1 Sources
For each of the two perspectives, we made a comparison between treatment without an MSU based on municipality data and hospital data from 2016 (Appendix A) as well as treatment with an MSU based on data from studies and a top neurologist from Skåne University Hospital.
2.3.2 Data schema
The data D1-D3 we collected and combined with our estimations E1-E2 in order to calculate C1-C3 and thereby determine how improvements could be made from both perspectives. Our data scheme is listed below, where D = data, E = estimation, C = calculation.
This is the time from when a regular ambulance receives a call until the ambulance has reached the patient.
D2 Door-to-needle (DTN)
This is the industry term for how long it takes from the patient’s arrival time at the hospital until an incision has been made.
D3 Amount of visits of patients with stroke (VTF)
One VTF or “Vårdtillfälle” is recorded in the data whenever a patient enters a clinic needing care for stroke. This means that a patient may have multiple VTF for the same stroke, which sometimes is needed. For example Skåne had 3842 VTF 2016 (Appendix A), spread out over all its municipalities. Malmö, for instance had 834 out of those 3842. This does not mean 834 people in Malmö had a stroke 2016. It most likely means less than 834 people had a stroke but 834 visits to the hospital were needed to fully treat all the stroke patients of Malmö 2016.
We prioritized this data point over others, such as looking specifically at certain age groups or similar. This, because it gives a clearer overview of how many times an ambulance is needed for each municipality. Our contact and neurologist at Skåne University Hospital informed us that this could be a more accurate way of calculating the likelihood when it comes to logistical improvements to health care.
E1 Layover time
Time it takes from when a regular ambulance has arrived until it leaves the site. This was estimated in accordance with a neurologist from Skåne University Hospital.
E2 Return time
After an ambulance has picked up the patient the clock starts again for measuring the return time, i.e. the time it takes for a regular ambulance to return to the hospital. This was estimated with the help of the Google Maps tool.
C1 Procentual VTF
The estimation of how likely a patient needs care for stroke in any given municipality. For example, the above mentioned 834 VTF of Malmö (see Appendix A) is divided by Skåne’s total VTF of 3842. In this way we calculate the likelihood for the need of an ambulance in every municipality:
mount of V T F in a municipality total amount of V T F in Skåne
a ÷
Table 4: Calculation for procentual VTF
For both perspectives, we asses the total time (in minutes) it would take for patients to receive care with a regular ambulance. The total time varies depending on the municipality. It is calculated as following:
response time + layover time + return time + DT N
Table 5: Calculation for total time
C3 Expected value
In order to assess the effect an MSU would have on the entirety of Skåne we give it an expected value, which is repeated for each municipality, which means every municipality receives an individual value based on the below equation which then are added together with all other municipalities in order to construct the expected value entirety of Skåne.
rocentual V T F otal time
p × t
Table 6: Calculation for expected value
Example of usage
( rocentual V T F of Osby p × total time of Osby) + procentual V T T of Y stad total time of Y stad)
( × +
(...) etc.
Table 7: Example of usage
2.3.3 Tools
In order to estimate certain distances, we used Google Maps. Specifically for estimating the return time of a regular ambulance as accurately as possible. A matrix was then constructed to show the closest hospital for each municipality. Specific times are listed under results. The closest hospital for each municipality is:
Hässleholm hospital Helsingborg hospital Kristianstad hospital Landskrona hospital Lund hospital Malmö hospital Trelleborg hospital Ystad hospital Ängelholm hospital Hässleholm Höör Osby Perstorp Bjuv Helsingborg Bromölla Kristianstad Östra Göinge Landskrona Svalöv Eslöv Lomma Lund Hörby Kävlinge Malmö Burlöv Staffanstorp Trelleborg Vellinge Svedala Ystad Tomelilla Simrishamn Sjöbo Skurup Båstad Höganäs Klippan Åstorp Ängelholm Örkelljunga
Table 8: Matrix over the closest hospitals for all the municipalities in Skåne.
2.4 Limitations
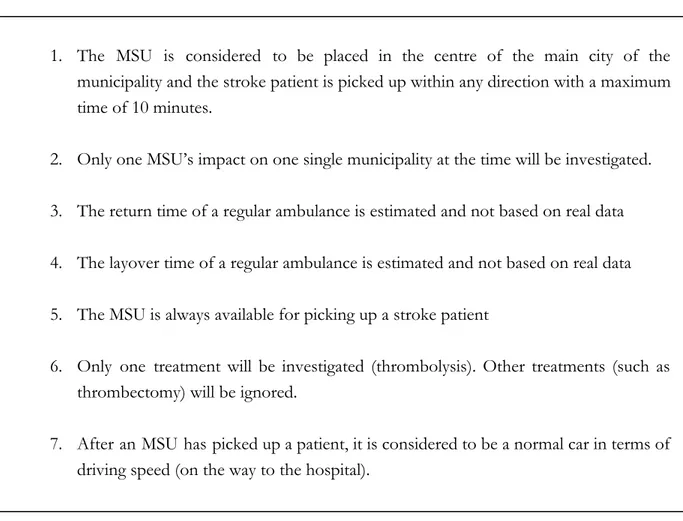
In order to develop our methodology and produce values that are easily comparable, the following limitations were made:
1. The MSU is considered to be placed in the centre of the main city of the municipality and the stroke patient is picked up within any direction with a maximum time of 10 minutes.
2. Only one MSU’s impact on one single municipality at the time will be investigated.
3. The return time of a regular ambulance is estimated and not based on real data
4. The layover time of a regular ambulance is estimated and not based on real data
5. The MSU is always available for picking up a stroke patient
6. Only one treatment will be investigated (thrombolysis). Other treatments (such as thrombectomy) will be ignored.
7. After an MSU has picked up a patient, it is considered to be a normal car in terms of driving speed (on the way to the hospital).
Table 9: Limitations made by the authors in order to complete the study.
2.5 Threats to validity
Even though the quality of the data we use is accurate (real hospital data, collected 2016), it is possible that the amount of data being used does not fully represent a long-time perspective. This could potentially affect our ability to form generalised conclusions and in turn would pose a threat to the validity of our thesis. To minimize this we have worked with a top neurologist in Skåne who has aided us in determining the validity of the data as well as constructing a methodology that could easily be changed to use more data.
Another threat to validity is the estimations we made, specifically the return time of ambulances. Since we only had data on response time we minimized the threat of estimation by using an individual google maps value for each municipality to the closest hospital. We did this in order to base our result in a more concrete way than simply estimating it ourselves based on presumptions or by simply doubling the response time. Note that this is still an estimation and could be improved vastly if hospitals collected data on return time in the future.
Lastly, a threat is that the researchers affect the results by being involved in the context of the study Both of the authors of this study have had members of family or friends affected by stroke, living in rural areas. To minimize this threat we conducted a comparison between different perspectives, which show clear advantages for both points of view rather than highlighting a preferred perspective.
2.6 Data analysis
In order to answer our research questions RQ2 & RQ3 (“ What is the optimal placement of an MSU in order to reduce the time to treatment for the stroke patients in the rural areas of Skåne?” & “What is the optimal placement of an MSU in order to reduce the time to treatment for the highest amount of stroke patients in Skåne?”) , the analysis of the data have consisted of three parts. (1) validate data with specialist, (2) identify similarities and differences between municipalities and (3) other potential findings.
Going through the data, partly found by us and partly supplied to us, with a specialist greatly increased our ability to perform further estimations and ensuring the data we used as a foundation matched with the specialist’s experience of stroke.
An extensive comparison was then needed in order to fully grasp the situation of stroke in Skåne. This also became crucial when we wanted to assess the situation in both our chosen perspectives and further comparisons.
2.7 Literature study
To make sure that we are credible and well informed on the subject of stroke, relevant treatment options and current state of stroke treatment, we have performed a systematic literature study in order to build the understanding and background knowledge we need for our research. Our systematic literature study and its findings will be presented and explained in this section.
We searched for articles and studies by using MAU Libsearch, the search tool provided by Malmö University, that makes it easy to search for all relevant databases at once. We also used Google Scholar to complement the searcheas done in MAU Libsearch. Searches were made using different combinations of keywords. The keywords used were: stroke, mobile, unit, "mobile stroke unit”, treatment, thrombolysis, placement, location, and position. Results and number of hits is presented in Appendix B.
From the literature study, we gathered studies and articles related to our thesis. Some of the articles have been found by personal recommendations and some were found by looking at references of others. In Appendix B we show the articles of which we followed Keshav’s three-pass approach [4] to further confirm that the literature is relevant and interesting for our thesis.
3 Results
We present our computational results with the format of only presenting the five most relevant municipalities of Skåne based on the two considered perspectives, i.e., the equality and efficiency perspective. The most relevant municipalities are those were the use of an MSU would have the greatest impact based on either efficiency or equality. On top of this, for the efficiency perspective we present how the entirety of Skåne is affected as well. For both perspectives we look at three parameters; care with hospital DTN today, care with hospital DTN goal, and care with use of an MSU. The five most relevant municipalities can vary depending on the perspective and chosen parameters.
Column keyword explanation
Likelihood - Likelihood that a stroke will occur in a specified municipality in comparison to the total of Skåne.
Response time - Time from when a regular ambulance receives a call until the ambulance has reached the patient.
Layover time - Time it takes from when a regular ambulance has arrived at the patient’s location until it leaves the site.
Return time - Time it takes for a regular ambulance to return to the nearest hospital after patient pickup.
Door-to-needle (DTN) - Industry term for how long it takes from the patient’s arrival at the hospital until an incision has been made.
Individual value - a municipality’s likelihood of stroke multiplied with the total time to treatment:
ikelihood (response time layover time return time door to needle time)
l × + + +
Expected value - all the individual values are added together to create an expected value for the entire Skåne:
ndividual value Malmö individual value Helsingborg ... etc.
Table 10: Keywords for our results
Efficiency perspective: care with hospital DTN today (without MSU)
Note that the return time and response time are identical for municipalities which has a hospital of their own. This is the case for all the municipalities in the tables below (tables 11-12).
Municipality
(name) Likelihood (%) Response time (min) Layover time (min) Return time (min) Door-to-needle (min) Total Time (min) Individual value (number) Malmö 0,217 9,4 15 9,4 44 77,8 16,89 Helsingborg 0,096 10,1 15 10,1 41 76,2 7,34 Kristianstad 0,065 12,1 15 12,1 46 85,2 5,59 Lund 0,057 11 15 11 57,5 94,5 5,43 Hässleholm 0,051 13,9 15 13,9 57 99,8 5,12
Expected value: 94,62 (sum of all individual values in Skåne)
Table 11: Five most relevant municipalities in the efficiency perspective (today)
Efficiency perspective: care with hospital DTN goal (without MSU)
Municipality
(name) Likelihood (%) Response time (min) Layover time (min) Return time (min) Door-to-needle (min) Total time (min) Individual value (number) Malmö 0,217 9,4 15 9,4 40 73,8 16,02 Helsingborg 0,096 10,1 15 10,1 40 75,2 7,24 Kristianstad 0,065 12,1 15 12,1 40 79,2 5,19 Lund 0,057 11 15 11 40 77 4,43 Hässleholm 0,051 13,9 15 13,9 40 82,8 4,24
Expected value: 83,11 (sum of all individual values in Skåne)
Table 12: Five most relevant municipalities in the efficiency perspective (goal)
Efficiency perspective: care with use of an MSU Municipality (name) Likelihood (%) Response time (min) Layover time (min) Return time (min) Door-to-needle (min) Total time (min) Individual value (number) Malmö 0,217 10 15 0 15 40 8,68 Helsingborg 0,096 10 15 0 15 40 3,85 Kristianstad 0,065 10 15 0 15 40 2,62 Lund 0,057 10 15 0 15 40 2,30 Hässleholm 0,051 10 15 0 15 40 2,05
Biggest change (individual value): 16.89 to 8.68 (Malmö, today), 16.02 to 8.68 (Malmö, hospital goal)
The decrease of Malmö’s individual value affects the expected value in Skåne the following way:
Expected value: 85,93 (Malmö, today), 74,43 (Malmö, hospital goal)
Table 13: Five most relevant municipalities in the efficiency perspective (MSU)
Efficiency perspective: expected value comparison
Here we compare the previous tables (table 11 - 13).
Care with hospital
DTN today
Care with hospital DTN goal
Care with MSU in Malmö hospital DTN today
Care with MSU in Malmö hospital DTN goal Skåne 94,62 83,11 85,93 74,43
The lowest achievable expected value in Skåne: 74,43 (Malmö, hospital goal)
Table 14: comparison of changes in expected value based on provided care. Lower number is better.
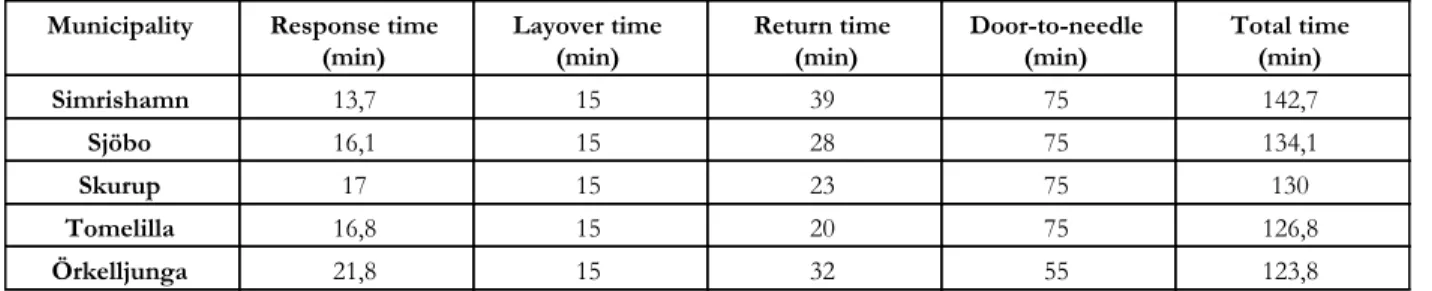
Equality perspective: care with hospital DTN today (without MSU)
Note that tables 15-19 below are not using likelihood to produce an expected value as in previous tables (11-14). We are now purely looking at the municipalities with the longest time to care.
Municipality Response time
(min) Layover time (min) Return time (min) Door-to-needle (min) Total time (min)
Simrishamn 13,7 15 39 75 142,7 Sjöbo 16,1 15 28 75 134,1 Skurup 17 15 23 75 130 Tomelilla 16,8 15 20 75 126,8 Örkelljunga 21,8 15 32 55 123,8
Average time in Skåne: 105,24 (average of all total times in Skåne)
Table 15: Five most relevant in the equality perspective (care with hospital DTN today)
Equality perspective: care with hospital DTN goal (without MSU)
Note how the list changes when all hospitals has reached the goal of a 40 minute door-to-needle time.
Municipality Response time (min) Layover time (min) Return time (min) DTN (min) Total time (min) Örkelljunga 21,8 15 32 40 108,8 Simrishamn 13,7 15 39 40 107,7 Osby 17,8 15 33 40 105,8 Höör 18,1 15 32 40 105,1 Hörby 14,2 15 34 40 103,2
Average time in Skåne: 90,43 (average of all total times in Skåne)
Table 16: Five most relevant in the equality perspective (care with hospital DTN goal)
Equality perspective: performance of an MSU with today’s hospital times
Municipality Response time (min) Layover time (min) Return time (min) DTN (min) Total time (min) Simrishamn 10 15 0 15 40 Sjöbo 10 15 0 15 40 Skurup 10 15 0 15 40 Tomelilla 10 15 0 15 40 Örkelljunga 10 15 0 15 40
Biggest change (total time in min): 142,7 to 40 (Simrishamn)
The decrease of Simrishamn’s total time affects the average in Skåne the following way:
Average time in Skåne: 102,13 (If placed in Simrishamn with today’s DTN times)
Table 17: Five most relevant in the equality perspective (care with MSU, hospital DTN today)
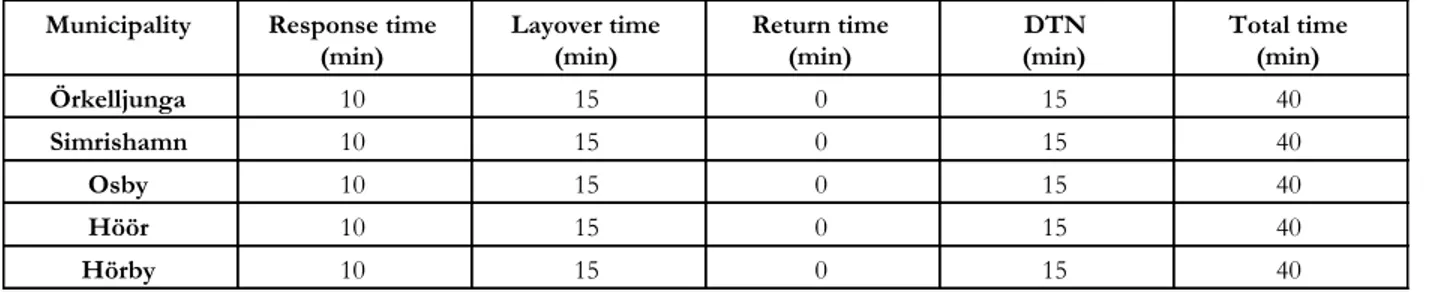
Equality perspective: performance of an MSU if used with hospital goal times
Municipality Response time
(min) Layover time (min) Return time (min) (min) DTN Total time (min)
Örkelljunga 10 15 0 15 40 Simrishamn 10 15 0 15 40 Osby 10 15 0 15 40 Höör 10 15 0 15 40 Hörby 10 15 0 15 40
Biggest change (total time in min): 108,8 to 40 (Örkelljunga)
The decrease of Örkelljunga’s total time affects the average in Skåne the following way:
Average time in Skåne (min): 88,34 (If placed in Örkelljunga with hospital DTN goals)
Table 18: Five most relevant in the equality perspective (care with MSU, hospital DTN goal)
Equality perspective: average time comparison
Here we compare the previous tables (table 15 - 18).
Care with hospital
DTN today (min)
Care with hospital DTN goal
(min)
Care with MSU in Simrishamn hospital DTN today
(min)
Care with MSU in Örkelljunga hospital DTN goal (min) Skåne 105,24 90,43 102,13 88,34
The lowest achievable average time in Skåne: 88,34 minutes (If placed in Örkelljunga with hospital DTN goals)
Table 19: Comparison of changes in average times based on provided care. Lower number is better.
4 Analysis
In the previous section, we presented the results from our model based on the data, estimates and calculations presented in Section 2. In this section, we compare, analyze and explain the results.
4.1 General analysis
Our results clearly show the potential benefits an MSU would have from both an efficiency perspective and an equality perspective. The results resonate with studies made in other places, like Berlin [2] where time to treatment was decreased without any adverse effects. A big difference from the study in Berlin is that our study is based on calculations with a mix of real data and estimates, whereas the Berlin study was conducted on real scenarios with the use of an MSU [2]. This means that the result in total is an estimation of how an MSU could impact the treatment times in Skåne. With more data for all of the calculated times, the model could yield different results. With the model in place it is easy to change the data and look at the effects it would have on the treatment times.
4.2 Efficiency perspective
In the efficiency perspective (Table 11-14), Malmö is the municipality in Skåne that is most affected by Stroke and would therefore benefit the most from an MSU. Bigger cities tend to already have a DTN time closer to the goal of 40 minutes, which means that to make a leap in total shorter treatment times for the city’s residents and the total of Skåne (based on expected value), an MSU could be an alternative. This is clear in this particular case of looking at Skåne but it should be noted that it could be less clear if our methodology was applied on a different geographic area. What is interesting in the efficiency perspective is that an MSU in Malmö would decrease the expected value for Skåne almost as much as if all of the Skåne hospitals reached the DTN goal of 40 minutes.
The MSU would however only be beneficial for the Malmö residents and nearby municipalities even though the results show a decrease of the expected time to treatment for all of Skåne. This shows the importance of providing fast care in the most affected municipalities where most people live. It also shows interesting alternatives for how money could be spent to aid stroke patients on large in Skåne. The results doesn’t show the economic cost and value of the different solutions, making it hard to establish what the best solution would be. The results could be looked upon as guidelines for future calculations, showing the effect different solutions would have on Skåne.
4.3 Equality perspective
In our equality perspective (Table 15-19) the results varied greatly. By looking at the state of today it is clear in Skåne that the area which is connected to Ystad hospital with a DTN of 75 causes a lot of trouble for patients. The very slow DTN time of Ystad hospital contributes to the longest time to treatment for any residents in Skåne. The municipalities in proximity to Ystad almost disappears completely when the goal sub perspective is applied and the DTN comes down to the goal of 40 minutes for all municipalities.
When the DTN comes down to the goal of 40 minutes, it becomes clear that the challenges of rural areas are the longer distances that equals to longer response and return times for the ambulances. With the use of an MSU, the time to treatment could be reduced by more than half for those most affected, making a huge impact on the treatment offered to the patients in rural areas. With the use of an MSU we could provide a more equal care for those who are the furthest from hospitals, providing emergency care in line with the care provided in the bigger cities. These results however, are only calculated on an individual municipality basis. This means that we only see the great effects in the direct municipality where an MSU is positioned. Further calculations could be made to show the differences it would make for a group of nearby municipalities as well. In all the results of the equality perspective, it becomes clear that an MSU has a great impact wherever it is placed, cutting the total treatment times from 100-145 minutes down to 40 minutes in the best scenarios. The question, however, is how beneficial an MSU placed in a rural municipality is for the average patient in Skåne. As seen in the results (Table 19), if we compare the average treatment time for a patient in Skåne, it is only lowered by 2-3 minutes with the use of an MSU compared to today.
The results shows the huge impact an MSU has for an individual in a rural municipality, but a small to non-existent impact for the average patient Skåne. Focus on hitting the DTN goal of 40 minutes in all hospitals would contribute a lot more to reduced treatment times for the average patient in Skåne, cutting the average treatment time with about 15 minutes as seen in Table 19.
5 Discussion
5.1 Efficiency vs equality
The result of the research question RQ2 “What is the optimal placement of an MSU in order to reduce the time to treatment for the stroke patients in the rural areas of Skåne?” ultimately creates a dilemma. Deciding the worst case in both the state of today and if each hospital keep their target time for DTN will result in different placements of the MSU. This leads to a crucial question when it comes to deciding the optimal placement of an MSU; should the hospital treating the municipality’s patients mainly focusing on improving their current routines and thereby decreasing their DTN or should our model still consider them for purchasing an MSU? Undoubtedly, a significant amount of people would receive help at a significant faster rate the same day the MSU is purchased.
Improving routines to decrease a DTN could be time consuming and would continue to put the stroke patients in rural areas at risk for the near future. A potential future study on this subject would be to examine the different routines of hospitals more closely in order to compare to our results.
Since every minute counts when it comes to stroke, our study examined how an MSU could lower the amount of minutes it takes to receive care for every municipality in Skåne. It should be noted, however, that decision makers could exclude areas that on average receives care within the golden hour of thrombolysis [5]. For instance, if patients in Malmö on average received care within the golden hour of thrombolysis but an MSU still produced the biggest impact in Malmö, one could lower this priority and focus on all of Skåne getting thrombolysis within the golden hour. We did not lower this priority ourselves since it would directly dismiss a big population of people who also need care and we wanted to maintain our research as objective and quantitative as possible.
Our first research question: “What is the optimal placement of an MSU in order to reduce time to treatment for the highest amount of stroke patients in Skåne?” that we examine in the efficiency perspective essentially examines one type of efficiency. Specifically the efficiency of increasing the number of people that could receive help faster. There is, however, more ways to look at efficiency. Mentioned previously in this study is how reducing the consequences of stroke could and would achieve reduced social costs [6]. Economic efficiency could be equally important for decision makers in terms of maximizing the amount of people you could help in the most economic way. For instance, it could be examined if purchasing an MSU is less expensive than the cost of educating hospitals to improve their routines.
Our way of looking at efficiency in Skåne resulted in Malmö as the clear choice for placing an MSU but for other provinces it could be less obvious. In Skåne, Malmö is by far the biggest municipality with a population of almost 25% of Skåne’s population. In an area with two or more cities with similar population our methodology would be able to find out which municipality would
need it the most. This combined with the previously mentioned economic aspect could be applied to comparisons as well in order to further help decision makers with purchasing an MSU.
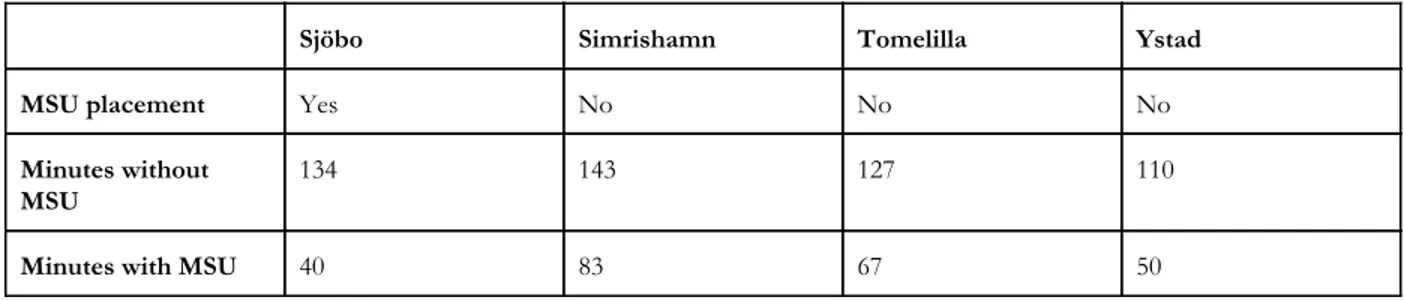
Lastly, we are examining how improvements could be made to one municipality at the time. Ultimately, and especially in the case of Skåne, the MSU could most likely be used in clusters of municipalities. As shown in the data in Appendix A, the amount of times patients need pickup is roughly 4000 a year which is about 11 cases per day. This does not mean that 11 people suffer from a stroke every day on average but they are picked up for stroke-related reasons. Potentially the MSU could improve a significantly higher amount than we examined in this study and we reserve this for future studies to examine. This example could be an illustration of how that type of calculation could be made for Skåne:
Sjöbo Simrishamn Tomelilla Ystad
MSU placement Yes No No No
Minutes without MSU
134 143 127 110
Minutes with MSU 40 83 67 50
Table 20: Example of how MSU placement in Sjöbo could affect its closest municipalities.
If Sjöbo Municipality was chosen for the MSU placement it would be affected the most (similar to our results) with a decrease of 94 minutes but adjacently located municipalities would in this case also get affected (contrary to our results), with about 60 minutes. The exact decrease in minutes of adjacently located municipalities would obviously have to be more precisely calculated than in this estimation above (Table 20).
5.2 Additional discussion
In this study, we mainly focused on thrombolysis since this is the most common approach for treating stroke for most patients. Increasingly, however, the use of thrombectomy has been used for removing bigger forms of blood clots. In the case of Skåne today, only one hospital has trained doctors able to give this form of treatment, which is the Skåne University Hospital located in Lund. There is however potential for the doctors from this hospital to be transported to wherever a patient in need of care is located. An MSU could obviously play an important part in either transporting or with greater speed determine if a patient is in need of thrombectomy instead of thrombolysis. Using an MSU in this fashion would have an immense impact since it would remove the time it takes for patients to be transported to their own hospitals as well as diagnosing the state of the patients faster. Examining this in a quantitative and objective way proved to be difficult, hence we placed it in our
limitations table (see Table 9) but is also something that most likely would make an MSU even more attractive for decision makers to purchase. This example could be an illustration of how that type of calculation could be made for Skåne:
Munici- pality Hospital time (min) Response time (min) Layover time (min) Return Scan (min) Transport time to Lund (min) Door-to- needle (min) Total time (min) Without
MSU Sjöbo Ystad 16,1 15 28 15 50 40 164.1
With MSU Sjöbo Ystad 10 15 0 0 40 40 105
Comment MSU scans patient, finds big clot MSU skips going to Ystad hospital MSU already performed scan Sjöbo is closer to Lund than Ystad is
Table 21: Example of a patient in Sjöbo in need of a thrombectomy, with MSU vs without MSU.
Using our methodology on other geographical areas than the area considered in our study is very simple as long as relevant data is present for the area one would wish to examine. However it could be time consuming if the area to study is significantly bigger than the area we examined (Skåne). One of the most noteworthy improvements to our methodology would be to make it less static by automating the process of its core function. For instance, if the data is correctly formatted and contains all the parameters we have used in this study, the methodology could be improved by automatically read in all the data for any given area and provide a result in a matter of milliseconds. It would also make it simpler to further develop the methodology and improve and add new functions/parameters to it.
Another thing to note, in the case of looking at Skåne, is that the data we used for our calculations could be improved. As far as we can tell, not everything is measured during the process of picking up, transporting and treating the patient. In our case we had to make some of our own estimations (Table 4) which may or may not be accurate. It is possible that there is stored data we are not allowed to get a hold of that could prove more useful for accurately deciding where to place an MSU. Furthermore, if this data does not exist anywhere, our study could potentially be used as a foundation for what parameters are important to track in order to assess the logistical situation of health care in any given area.
Our calculations of the number of people needing care is based on likelihood from data gathered 2016 (see Appendix A), e.g., statistical data about the number of cases in that year. This is not necessarily accurate and could potentially fail to reflect future outcomes. It would be interesting to compare our data with more probabilistic data regarding risk-factors, such as the number of elderly over a certain age multiplied by their probability for stroke based on risk-factors such as unhealthy diet, life-stiles, amount of exercise, unemployment rate, etc. Especially if the comparison
uses data from a longer time period, such as 5 years or more. If our data proves to be accurate, it could potentially be a more effective way to predict outcomes without gathering in-depth data which could be time-consuming.
Lastly, working with our contact at Skåne University hospital greatly helped our way at looking at the data they provided us and how we ultimately were able to finish our study in a fulfilling way. Therefore, we would greatly recommend using a more in-depth interview methodology combined with our expected value methodology in order to even further investigate this important and interesting field. Communicating and meeting with multiple doctors from different hospitals in the area that have a clear understanding of what medical and logistical challenges they are facing everyday would help us to further understand what problems the data would not show. Additionally, it would help to sort out what priorities should be made in terms of which ones that are most important to solve when it comes to treating stroke. This in turn could lead to a more nuanced solution and methodology and very likely prove to be more accurate, especially for the personnel working with stroke everyday, whose opinion obviously would matter if a decision maker ultimately would want to purchase an MSU.
6 Conclusion and future studies
In this section we summarize the answers for our research questions. We also suggest future studies and work that can be done to further use and develop our method and results.
RQ1: How can expected value optimization be used in order to compare the possible benefits of an MSU compared to today’s situation?
Based on our explanation of expected value in our methodology description, Section 2.1.1, it can be used to find the possible benefits of an MSU for efficiency, reducing the time to treatment for the highest amount of people. With the use of expected value, we can calculate how the likelihood of a stroke and time to treatment together change the expected value outcome and measure how different solutions could contribute to more efficient care. With the use of expected value optimization it is straightforward to compare the outcome of different placements of an MSU.
RQ2: What is the optimal placement of an MSU in order to reduce time to treatment for the stroke patients in the rural areas of Skåne?
Based on our method, the optimal placement of an MSU would be in Simrishamn to aid the individuals furthest away from care in Skåne compared to today's treatment times.
RQ3: What is the optimal placement of an MSU in order to reduce the time to treatment for the highest amount of stroke patients in Skåne?
Based on our method, the optimal placement of an MSU would be in Malmö to reduce time to treatment for the highest amount of people.
6.1 Future studies
Based on earlier analysis and discussion of the results we found a couple of areas that would be interesting for future studies and work. Here we list potential areas for future work that could help improve and answer more questions in relation to stroke and our method.
1. Calculate or simulate how an MSU could affect a bigger area (multiple municipalities, for example).
2. What effects an MSU placement would have on the economy of health care in Skåne. 3. How simple/difficult/expensive it would be for hospitals improving their routines
compared to purchasing an MSU.
4. Examining how multiple MSU’s could be placed efficiently in any given area.
References
[1] K. Steen Carlsson, G. Andsberg, J. Petersson and B. Norrving, “Long-term cost-effectiveness of thrombectomy for acute ischaemic stroke in real life: An analysis based on data from the Swedish Stroke Register (Riksstroke)” International Journal of Stroke, vol. 12, pp. 802-814, October 2017
[2] M. Ebinger, B. Winter, M. Wendt, J. E. Weber, C. Waldschmidt, M. Rozanski, A. Kunz, P. Koch, P. A. Kellner, D. Gierhake, K. Villringer, J. B. Fiebach, U. Grittner, A. Hartmann, B. Mackert, M. Endres and H. J. Audebert, “Effect of the Use of Ambulance-Based Thrombolysis on Time to Thrombolysis in Acute Ischemic Stroke. A Randomized Clinical Trial.” JAMA, vol. 311, pp. 1622–1631, April 2014
[3] J. L. Saver, G. C. Fonarow, E. E. Smith, M. J. Reeves, M. V. Grau-Sepulveda, W. Pan, D. M. Olson, A. F. Hernandez, E. D. Peterson and L. H. Schwamm, “Time to Treatment With Intravenous Tissue Plasminogen Activator and Outcome From Acute Ischemic Stroke” JAMA, vol. 309, pp. 2480–2488, June 2013
[4] S. Keshav, “How to Read a Paper” ACM SIGCOMM Computer Communication Review, vol. 37, pp. 83-84, July 2007
[5] M. Ebinger, A. Kunz, M. Wendt, M. Rozanski, B. Winter, C. Waldschmidt, J. Weber, K, Villringer, J. B. Fiebach and H. J. Audebert, “Effects of golden hour thrombolysis: A Prehospital Acute Neurological Treatment and Optimization of Medical Care in Stroke (PHANTOM-S) Substudy” JAMA, vol. 72, pp. 25-30, January 2015
[6] F. Hedlund, "Stroke - en kamp mot klockan" Medicinsk Vetenskap, vol. 1, pp. 32-37, February 2013
[7] Averill M. Law and W. David Kelton, Simulation Modeling and Analysis. Tucson: McGraw-Hill Higher Education, 1997
[8] O. Ore, “Pascal and the Invention of Probability Theory” The American Mathematical Monthly, vol. 67, pp. 409-419, May 1960
[9] E. Dahlborg Lyckhage, G. Lyckhage and E. Tengelin, Jämlik vård: normmedvetna perspektiv. Lund: Studentlitteratur, 2015
[10] Regeringskansliet, Strategi för en god och mer jämlik vård. Stockholm: Regeringskansliet, 2012-2016
[11] M. Hov, A. Ryen, K. Finsnes, J. Storflor, T. Lindner, J. Gleditsch and C. Lund, "Pre-hospital ct diagnosis of subarachnoid hemorrhage" Scandinavian Journal of Trauma, Resuscitation and Emergency Medicine, vol. 25, pp. 1, February 2017
[12] L. Brotcorne, G. Laporte and F. Semet, "Ambulance location and relocation models" European Journal of Operational Research, vol. 147, pp. 451-463, June 2003
[13] R. McCormack and G. Coates, "A simulation model to enable the optimization of ambulance fleet allocation and base station location for increased patient survival" European Journal of Operational Research, vol. 247, pp. 294-309, November 2015
[14] E. Erkut, A. Ingolfsson and G. Erdoğan, "Ambulance location for maximum survival" Naval Research Logistics, vol. 55, pp. 42-58, December 2007