In-situ phase studies
of the Zr-H system
Licentiate Dissertation by
For Information, address
Materials Science and Applied Mathematics Dept. Media Technology and Product Development Faculty of Technology and Society, Malmö University SE 20506 Malmö, Sweden
Homepage: http://www.mah.se/
Copyright Tuerdi Maimaitiyili Faculty of Engineering Lund, Sweden.
August 2014
Department of Construction Sciences Solid Mechanics
ISRN LUTFD2/TFHF-14/1049-SE ISBN: 978-91-637-6610-7
Printed in Sweden by Media-Tryck, Lund University Lund 2014
Faculty of Technology and Society
Acknowledgements
The work presented in this dissertation has been conducted at Materials Science and Applied Mathematics group at Malmö University. This work would not have been possible without the help of many people around me. Here I would like to take this opportunity to acknowledge the support of many who helped me out along the past couple years. There have been far too many to name everyone individually so I will be brief: I would like to thank my supervisor Christina Bjerkén, for her valuable suggestions, encouragement and constant support during this research. I am also thankful for my supervisors Per Ståhle and Jakob Blomqvist for their guidance.
I am deeply grateful to Dr. Axel Steuwer for introducing this scientific field to our group and his generous help both theoretically and practically. He not only share with me his knowledge but also share with me his valuable beam time at FRM2 and ESRF. I really thankful for his help and generosity.
Dr. Olivier Zenate spent quite a lot of his valuable time to teach me how to use Topas Academic, and gave me tons of tips about crystallography and as well as data analysis. He also generously share with me his beam time at ESRF and vast experience in this field. I am truly thankful for all his help.
Dr. Mathiew Blackmur and Dr. Pär Olsson, expressed their interest in my work and we had quite many rewarding discussions which gave me a better perspective on my own results and they both helped me with Matlab quite many times.
The Swedish Research Council (VR 2008-3844) and Malmo University supported this project which was crucial to the successful completion of this project. The European Synchrotron Radiation Facility (ESRF), Grenoble, France, and the Forschungsneutronenquelle Heinz Maier-Leibnitz (FRM II), Garching, Germany, are gratefully acknowledged for the provision of beam time.
Last but not least, I am so grateful to my beautiful and caring wife Zhayida, lovely daughter Lale and my loving parents for their support, encouragement and patience.
Maimaitiyili Tuerdi Malmö, Sweden August 2014
Abstract
Zirconium alloys are widely used in the nuclear industry because of their high strength, good corrosion resistance and low neutron absorption cross-section. However, zirconium has strong affinity for hydrogen, which may lead to hydrogen concentration build-up over time during a corrosion reaction when exposed to water. Hydrogen stays in solution at higher temperature but precipitates as zirconium hydrides at ambient temperatures. The formation of zirconium hydrides is considered to be a major cause of embrittlement, in particular as a key step in the mechanism of delayed hydride cracking.
Despite the fact that zirconium hydrides have been studied for several decades, the basic nature and mechanisms of hydride formation, transformation and exact structure are not yet fully understood. In order to find the answer to some of these problems, the precipitation and dissolution of hydrides in commercial grade Zr powder were monitored in real time with high resolution synchrotron and neutron radiations, and the whole pattern crystal structure analysis, using Rietveld and Pawley refinements, were performed. For the first time all commonly reported zirconium hydride phases and complete reversible transformation between two different Zr-hydride phases were recorded with a single setup and their phase transformation type have been analyzed. In addition, the preparation route of controversial γ-zirconium hydride (ZrH), its crystal structure and formation mechanisms are also discussed.
Appended papers
Paper A
T. Maimaitiyili, A. Steuwer, J. Blomqvist, B. Matthew, Z. Olivier, J. Andrieux, C. Bjerkén, R. Fabienne
In-situ hydrogen charging of zirconium powder to study isothermal precipitation of
hydrides and determination of Zr-hydride crystal structure, 16th International Conference on Environmental Degradation of Materials in Nuclear Power Systems-Water Reactors, August 11-15, 2013, North Carolina, USA. arXiv:1408.4665v1 [cond-mat.mtrl-sci].
Paper B
T. Maimaitiyili, A. Steuwer, J. Blomqvist, B. Matthew, Z. Olivier, C. Bjerkén, J. Andrieux, F. Ribeiro
The phase transformation between the δ and ε Zr-hydrides, submitted to Journal of Nuclear Materials, 2014
Paper C
T. Maimaitiyili, A. Steuwer, J. Blomqvist, Z. Olivier, C. Bjerkén, M. Hölzel
Contents
Introduction 1
Structure of the dissertation 3
The future work 4
The Zr-H system 5
Zirconium and its alloys 7
Materials and methods 9
Materials 9
In-situ studies 9
Powder diffraction 10
Experimental design 11
In-situ hydrogen loading setup 11
Neutron beam line setup 13
Structural analysis 14
Rietveld Refinement 14
Data Analysis 15
Results and discussion 17
In-situ hydrogen loading experiment 17 In-situ neutron diffraction studies 24
Conclusions 30
Reference 31
Introduction
Mechanical properties such as high strength, high melting point and excellent corrosion resistance in almost all environments make zirconium (Zr) and its alloys some of the widely used engineering materials in many different areas ranging from daily consumer goods to aerospace components. The most important application of the Zr is in nuclear power industry because of its neutron transparency [1-4]. As illustrated in Figure 1a, Zr-alloys are mostly used as fuel rod cladding to hold the nuclear fuel pellets inside the reactor core and during service they are in contact with surrounding neutron moderator and coolant. Depending on type of nuclear power plant, either light (H2O) or heavy (D2O)
water are most commonly used as moderators. During reactor operation, the environment inside the reactor core becomes very harsh (250-350 °C and 7-15 MPa) and Zr-alloys undergo aqueous corrosion according to chemical reaction [5]:
Zr+2H2O → ZrO2+2H2. (1.1)
In addition to hydrogen produced by corrosion, hydrogen can also be created through fuel oxidation, dissolved coolant hydrogen, trapped hydrogen during production and by radiolysis of water through reaction [5]:
2H2O → H2O2+H2. (1.2)
As deuterium and hydrogen are chemically indistinguishable, and the phase diagram of the Zr-deuterium (Zr-D) system is same as the Zr-hydrogen (Zr-H) system (Figure 1b) [6], these chemical reactions described above are also true for D2O, and in these cases
deuterium gas (D2) will form instead of hydrogen gas (H2). In the rest of the dissertation
I only use the notation of hydrogen, but same knowledge can be extend to deuterium. Among all those hydrogen sources, the corrosion is the most dominant one. Since at reactor operating temperature, hydrogen is more stable in solid solution in the Zr matrix than as its in gaseous form, a portion of hydrogen may be transported to the metal-oxide (Zr-ZrO2) interface and eventually absorbed into the cladding. Since Zr has relatively high
solubility of hydrogen at high temperature but very low (almost zero) at room temperature [7], hydrides will precipitate as soon as the hydrogen solubility limit is exceeded. Because the hydride phases have larger volume-per-unit than the α-Zr, the formation of hydrides will introduce internal stresses and which may lead to delayed hydride cracking as illustrated in Figure 1a. It is believed that the precipitation of hydrides is the major cause of embrittlement of Zr-alloys [8,9]. Additionally, in response to thermodynamic driving forces such as chemical potential, concentration and thermal gradients, some parts of the absorbed hydrogen diffuses in the material and causes local hydrogen concentration build up and forms blisters or rims to become a potential danger. Thus, the formation of hydrides is a potential issue during extended fuel burn-up and when reactors are taken
off-line and cooled to ambient temperature. To extend the life span of claddings and to avoid catastrophic failure, it is necessary to identify the nature of various Zr-hydride phases and their exact structures.
Figure 1: a) An illustration of a hydrogen induced degradation in nuclear fuel cladding; b) Redrawn binary Zr-H phase diagram based on data provided in [1].
Despite the fact that Zr-hydrides have been studied for several decades, still the basic nature and some mechanisms are not fully understood, owing to high diffusivity of hydrogen at low temperature, structural similarities of various phases, extended hydrogen concentration interval of hydride phases and influence of other impurity elements in the Zr-H system. The controversy surrounds the stability, crystal structure, formation mechanisms and the transformation temperature of the phases denoted γ [1,2,4,10-13]. Regarding the so called δ- and ε-phases, it is also not clear at what precise hydrogen concentration [14-16], at what temperature and in which transformation order [15,17-21] the FCT ε-hydride transforms into FCC δ-hydride.
According to literature, the stability of various hydride phases depends on alloying elements and internal stresses that are considered [2,4]. As many of these reported studies and structures are based on experiments carried out on ex-situ hydrided polycrystal alloy samples using different techniques and facilities, there might be alloying/impurity elements effect or experimental discrepancies involved between different measurements. To the best of the author’s knowledge, there has not been any in-situ hydrogen charging studies performed on commercial grade Zr powder, which is crucial to be able to answer all these questions stated above.
In order to decrease the gap and remove some of these discrepancies described here, a series of in-situ and ex-situ experiments have been carried out at various powerful synchrotron and neutron radiation facilities around Europe. Sets of in-situ hydrogen loading experiments have been performed at the high energy synchrotron radiation beam line ID15-B at the European Synchrotron Radiation Facility (ESRF) in Grenoble, France. An onsite high pressure/high temperature capillary system [22] was used to hydride commercial grade Zr powder to obtain all reported phases in the Zr-H system through one single setup and to follow their transitions. Rietveld [23-25] and Pawley [23-25] analyses were performed to determine the crystal structure of various phases.
In addition to in-situ hydridation studies, externally hydrided commercial grade Zr-powder also has been studied at the high-resolution thermal neutron structure Zr-powder diffractometer (SPODI) [26] at Forschungsneutronenquelle Heinz Maier-Leibnitz (FRM II), Garching, Germany.
Experimental observation and findings presented in this dissertation enabled not only the direct observation of the hydride formation and phase transformations, but also provided high quality data for crystal structure determination.
Structure of the dissertation
Considering that some parts of the research described in this dissertation already are presented in the appended papers, parts of the dissertation including the introduction are kept short. In Chapter 2, the Zr-H system is introduced and various Zr and hydridephases together with applications of Zr-alloys are described in details. Chapter 3 gives a detailed description of experimental setups together with an overall introduction of powder diffraction as well as in-situ diffraction studies. Chapter 4 introduces the main data
analysis tool of this paper the Rietveld method, and describes data processing and fitting procedures. Chapter 5 gives detailed descriptions of experimental observation, findings and analyzed results together with discussion. The final chapter presents the conclusions made from summarizing the three manuscripts major findings.
Paper A describes the in-situ hydrogen loading setup and presents some of the crystal structure related results.
Paper B is focused on stability of the δ- and ε-hydrides and addresses the transformation order problem between these two phases.
Paper C describes the ex-situ hydride preparation procedure, the high resolution neutron diffraction setup and results regarding the existence of a δ to γ transition, the exact δ to ε transition temperature and the structural variation of various hydride phases at various temperature and different hydrogen concentrations.
The future work
The work presented in this thesis is a part of a multi-disciplinary research approach, at Malmö University, constituted of several projects performed in collaboration with industry and other universities. The overall aim of these projects is to understand and describe the mechanisms of short- and long-term crack formation and propagation due to hydrogen induced embrittlement, and eventually develop a multi-level modeling strategy useful for industrial applications. In addition to the present dissertation, at Malmö University, the conditions for formation and evolution of metal hydrides are studied using atomistic calculations of hydride properties and thermodynamical quantities [3], as well as meso-scale phase field modeling of dislocation and crack induced phase transformation [27].
In this current work and as well as in the research community, the crystal structure of γ-hydride and its formation and transformation mechanisms have not been addressed yet. According to [1], γ-hydride forms through quenching, but as it described in Paper A, it was also observed after slow cooling. In addition, as it described in Paper C and in result and discussion part of this dissertation, the observed transformation temperature between ε- to δ-hydride was significantly different than literature [1]. To confirm those observations and find the real formation mechanism of γ-hydride and actual transformation temperature between ε- and δ-hydride, more measurements will be needed. Thus, in the near future I am going to tackle those problems and conduct such experiments and planning to revive findings in peer reviewed scientific journals.
The Zr-H system
As shown in the Zr-H binary equilibrium phase diagram (Figure 1b), Zr-hydride phases can exist at least in three different forms at atmospheric pressure, depending on hydrogen concentration, specific composition, irradiation, quenching rate and thermo-mechanical history of the host-alloy [1-4]. Phases reported in the Zr-H system include two allotropic forms of Zr, the hexagonal close packed (HCP) Zr phase known as α-Zr phase which is of Mg structure type (with space group symmetry P63/mmc, and unit cell parameters
a=3.2316 Å, c=5.1475 Å) and the body centered cubic (BCC) Zr phase known as β-Zr
phase which is of W structure type (Im-3m, a=3.6090 Å); two stable hydride phases, the face centered cubic (FCC) Zr-hydride known as the δ-Zr hydride phase which is of CaF2
structure type (Fm-3m, a =4.7783 Å) and the face centered tetragonal (FCT) Zr-hydride known as ε-Zr hydride phase with ThH2 structure (i4/mmm, a=4.9689, c=4.4479 Å); two
metastable hydride phases, the FCT γ-hydride phase with structure type ZrH (P42/n,
a=4.592 Å, c=4.970 Å), and one newly observed trigonal ζ-hydride (P3m1, a=3.242 Å, c=10.33292 Å) [1-4,28,29]. The crystal structure of all these reported phases are shown
in (Figure 2 and Figure 3), and basic crystallographic data are tabulated in Table 1.
Figure 2: Crystal structure of four different Zr-hydride phases. The green spheres represent Zr atoms and red spheres represent H atoms.
In α-Zr, hydrogen can occupy either octahedral or tetrahedral interstitial sites. Since the absorption/dissolution enthalpy of tetrahedral sites are lower in HCP α-Zr, hydrogen tends to occupy tetrahedral sites [30].
It is commonly believed that, the γ-hydride has an ordered tetragonal crystal structure and the hydrogen atoms in this structure occupy tetrahedral sites on alternate (1 1 0) planes with concentration of x=hydrogen/Zr≈1. The Zr atoms in γ-Zr hydride are located at the (1/4 1/4 1/4) sites while the hydrogen atoms occupy the (0 0 0) or (0 0 1/2) sites [1,2,4].
However, Kolesnikov et al. [31] reported that the structure of γ-Zr hydride is orthorhombic which belong to space group Cccm. Few reports suggest that this phase is the stable room temperature phase, with a δ to γ transition at 180 oC [12,32] or at 250 oC
[33], while other quote the δ-phase as being the stable room temperature phase with no such transition [1,4]. Most reports agree that the formation of γ-hydride favors higher rates (>10 oC/min) of quenching, while δ-hydride is often found after annealing [1].
Table 1: Some known and calculated crystallographic information about Zr and Zr-hydrides.
Phase Struct. Space group a [Å] b [Å] c [Å] Temp.
[°C] Reference α(Zr) HCP P63/mmc 3.2316 3.2316 5.1475 25 [1] 3.24205 3.24205 5.16645 25 Current studies 3.25721 3.25721 5.19881 25* β(Zr) BCC Im-3m 3.6090 3.6090 3.6090 863 [1] 3.75788 3.75788 3.75788 300 Current studies δ(ZrH1.66) FCC Fm-3m 4.7783 4.7803 4.7803 20 [1] 4.8051 4.8051 4.8051 500 [12] 4.84159 4.84159 4.84159 300 Current studies 4.77854 4.77854 4.77854 25* ε(ZrH2) FCT I4/mmm 4.9689 4.4689 4.4497 20 [1] BCT 3.51743 3.51743 4.52469 300 Current studies γ(ZrH) FCT P42/n 4.592 4.592 4.970 17 [1] 4.59966 4.59966 4.98654 25* Current studies ζ(Zr4H) Trigo. P3m1 0.33 0.33 10.29 - [29] Note: * after annealing.
In contrast to γ-Zr hydride, hydrogen atoms in δ-Zr hydride randomly occupy eight tetragonal (1/4 1/4 1/4) sites with a concentration of x=hydrogen/Zr≈1.5-1.7. At higher hydrogen concentration, all eight tetrahedral sites in Zr will fill with hydrogen and the FCT ε-hydride will form. The illustration of both δ- and ε-Zr hydride shown in Figure 2. The existence of the trigonal ζ-Zr hydride have been observed very recently through electron precession microdiffraction and electron energy loss spectroscopy by Zhao et al. [29]. The ζ-Zr hydride phase is observed to be metastable and fully coherent with Zr matrix, with a probable stoichiometry of x≈0.25-0.5. However, this phase has not been confirmed by other research groups yet.
Zirconium and its alloys
The 40th element zirconium is a metal with atomic mass of 91 amu. As the 18th most
abundant element with about 150 ppm concentration in earth crust, Zr exists in over 100 different minerals in nature. However, it mainly extracted from zircon (ZrSiO4),
baddeleyite (ZrO2) and a by-product of titanium (Ti) productions through a process known
as the Kroll Process [34].
Zirconium has five naturally occurring isotopes with one main oxidation state +4. Among five isotopes (90Zr, 91Zr, 92Zr, 94Zr, 96Zr) of Zr, the 90Zr is the most abundant with about
51.5% of the total mass [35].
The high purity Zr is grey-white, soft and ductile. Since pure Zr easily oxidizes at ambient temperature, a thin protective oxide layer always covers the surface of Zr and as a result it looks gray or dark on appearance. Due to the protective oxide layer, Zr possesses very good chemical resistance to various acids and bases. Zirconium with large surface area to mass ratio is considered to be flammable and it may ignite spontaneously at room temperature when exposed to oxygen [34,36].
As one of the member of the Group 4 family in the periodic table, Zr has close similarity to other Group 4 elements the Ti and hafnium (Hf). With almost identical ionic radii of Zr4+ and Hf4+ (72 and 71 pm respectively), these two shows very similar chemical
behavior and commercial grade Zr always contains some amount of Hf. The equilibrium phase diagram of Zr and Hf are also quite similar. Because of such close similarity and the strong affinity of oxygen it took more than a century to extract the high purity (100%) Zr after its first discovery in 1789 by the German chemist Martin Heinrich Klaproth [36]. Because of close chemical similarities of Zr and Hf, it is not important to remove Hf from Zr for many applications. However, the neutron capture cross-section of Hf is 550 times more than Zr, hence, the separation of Hf from Zr is crucial for nuclear applications [34,37].
Both elemental Zr and Ti has a hexagonal close packed (HCP) crystal structure (α-phase Figure 3c) at room temperature up to 866-882°C under atmospheric pressure and they transform to a body-centered cubic (BCC) crystal structure (β-phase, Figure 3b) at temperatures above. Under pressurization (≥2 GPa), the HCP α phase transforms to the loosely packed hexagonal phase (ω). The experimentally determined pressure– temperature phase diagram of Zr and Ti is shown in Figure 3a together with the c/a ratio of both low and high pressure HCP Zr phases.
Like any other structural materials such as pure iron (Fe), the pure Zr is soft and it does not have appreciable strength for construction. However, through alloying the mechanical strength of the Zr will significantly improves with strength range from 200-1100 MPa (for temperature interval 20 oC to 482 oC) [39]. The main alloying elements for nuclear
applications are niobium (Nb) and tin (Sn), and together with other minor elements. The nominal composition and applications of few of the most commonly used and recently developed Zr-alloys are listed in Table A-1 in Appendix A.
Compared with other conventional structural materials, Zr and its alloys have good compromise of mechanical properties under high pressure/high temperature condition and appreciable neutron transparency. The relative neutron capture cross-section and other physical properties of most common structural materials are presented in Table A-2 in Appendix A. Thus, Zr-alloys become popular material in nuclear industry and its behavior during manufacturing and in service as well as under accident scenarios is therefore of great importance and a topic of extensive research.
Figure 3: a) Compiled temperature–pressure phase diagram of Zr and Ti based on experimental data provided in [38]; b) crystal structure of β-Zr and β-Ti; c) crystal structure of α-Zr and α-Ti.
In addition to nuclear application, Zr and its alloys have many other different applications. Thanks to excellent corrosion resistance of Zr towards many different acids, basis and also seawater, Zr and its alloys extensively used in chemical industry and offshore business. Because of high melting and boiling point of Zr, they are also used in high temperature environment as refractory material. The compound zircon also used as a semiprecious gemstone. Since Zr does not have any known biological hazard they also be used for surgical instruments as well as implants, etc.
Materials and methods
Materials
The commercial grade, pure zirconium powder (99.2% purity) with maximum particle size about 45 µm was purchased from Goodfellow Ltd., Huntingdon, England (ZR006015). The detail nominal composition of the sample is shown in Table 2. To avoid oxidation and any other types of contamination, the Zr powder handled in extreme care under argon environment inside glove box. The details of sample preparation of each experiment are presented in respective attached papers.
Table 2: Nominal composition of the Zr-powder specimens used in investigation. Impurity elements [ppm]
C Hf Fe Cr N O H
250 2500 200 200 100 1000 10
In-situ studies
In the past, Zr-hydride and hydrogen behavior in Zr-alloys were investigated by ex-situ studies with techniques such as TEM, SEM, lab X-ray diffraction and metallographic observation [1,21,40,41]. With these techniques, it is possible to perform morphological and structural investigations. However, from literature [1,2,4], it is evident that in the Zr-H system there are metastable and low temperature hydride phases that only exist at specific temperatures and conditions. This means that the above mentioned techniques are of limited use due to possibility of issues such as data discontinuity before, during and after the experiment depending on environment of the system. In-situ studies, on the other hand, enable real-time observation while the system are under varying condition such as temperature, pressure, concentration and load. Thus, to understand true behavior of hydrogen in Zr and characteristics of various Zr-hydride phases, it is essential to conduct highly accurate in-situ studies. Neutron and synchrotron X-ray diffraction are two of the most widely used in-situ techniques for this purpose.
Both neutron and synchrotron X-ray diffraction techniques enable one, in principle, to measure the absolute atomic spacing in the crystal. Among the two, neutron diffraction is commonly used to establish the structure of light element materials, as neutrons directly interact with nuclei instead of electron cloud they can detect light elements better than X-rays. Neutrons have deeper penetration power and are sensitive to hydrogen and
deuterium compared to X-rays. This means that the presence and position of hydrogen in a crystal structure and their thermal motions can be determined far more precisely with neutrons. In addition, neutrons strongly interact with magnetic moments, so it is very good for studying magnetic properties of the materials. Compared with neutrons, the synchrotron X-rays, have higher flux rate, brilliance, resolution, high degree of coherence, easily tunable wavelength and easy accessibility. The instrumentation for X-rays is also easier and there is less concern about safeties. Thus, these two techniques are complimentary to each other and important when studying material structures and their properties.
Powder diffraction
Bragg’s diffraction occur in crystalline materials bombarded by a beam of X-rays or neutrons when Bragg's conditions are fulfilled. The material must be crystalline and the spacing between atomic layers should be close to the radiation wavelength. If beams diffracted by two different layers are in phase, constructive interference occurs and the diffraction pattern shows characteristic peaks, if atomic layers are out of phase, destructive interference occurs and there will be no peaks. Most often, all real materials have various kind of defects which most likely destroys the periodic atomic arrangement in space and leads to destructive interference. Therefore, to ensure good diffraction signal single crystals are sometimes used in various investigations. However, for certain materials such as compounds it is very difficult to produce a relatively large single crystal which is essential for high resolution measurements.
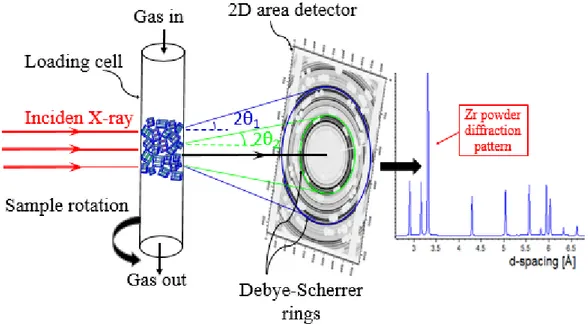
In contrast to single crystal diffraction, in powder diffraction techniques a powder of the material is used for investigation rather than an individual crystal. As illustrated in Figure 5, the powder of a specimen consist of randomly oriented perfect small/single crystallites of imperfect crystals. In powder diffraction all crystallite orientations are, in principle, equally probable and there will be a number of small crystallites at the correct orientation (θ1) for any given inter atomic spacing (d1) which can satisfies Bragg's law for
given wavelength (λ):
λ = 2d
1sin
θ
1.
(3.1)
Since each crystallite is randomly oriented, similar planes in different crystallite scatter in different directions. Thus, a cone of diffracted rays, with a semi-vertex angle of 2θ1 isproduced as shown in blue in Figure 5. Similarly, there are numerous other crystallites at the correct orientation, θ2, to satisfy Bragg’s law for planes spaced d2, and they generate
other diffraction cones, represented as the green cone in Figure 5. For simplicity only two diffraction cones are drawn, but all diffraction rings (also known as Debye-Scherrer rings) of hydrided Zr-powder is shown on an image plate together with its integrated diffraction pattern.
Figure 4: Illustration of powder diffraction.
Compared with single crystal diffraction, powder diffraction is often easier and more convenient since it does not require individual crystals to be made. In addition, in powder diffraction the rotation of the samples during measurement is also not necessary.
With powder diffraction it is possible to determine many important crystallographic parameters in high precision such as unit cell dimensions, the symmetry, the fractional coordinates of the atoms, atomic occupancies of the atoms, interatomic bond length, bond angles, thermal displacements of atoms, elemental composition, grain size distribution, particle size and microstresses in the crystal lattice, etc.
Experimental design
The thermal, high-resolution, multi-array neutron powder diffractometer SPODI at FRMII was used for in-situ heat treatment studies, and the high energy synchrotron X-ray diffraction beam line ID15B was used for in-situ hydrogen loading studies. These two specific beam lines were selected because of their high accuracy with low signal-to-noise ratio which is ideal for Rietveld analysis.
In-situ hydrogen loading setup
The experiment has been performed at ID15B beam line at the European Synchrotron Radiation Facility (ESRF). The ID15B is one of the side-station of a powerful asymmetric multipole wiggler (insertion straight section holds a 7 pole 1.84 T) beam line ID15. As a
side station, the ID15B cannot receive white beam, instead it receives monochromatic beam from a horizontally focusing monochromator. A fixed high energy, monochromatic X-ray beam of 87.7 keV was generated by a Si(511) bent Laue monochromator. The beam size was defined by a set of tungsten slits shortly before the sample stage. A large 2D flat panel detector (Pixium Trixell 4700, Thales) positioned far from the specimen (~1.2 meter) was used for data collection [22,42]. The high pressure and high temperature gas loading system together with a custom made mass spectrometer available at ID15B [22] were used for hydrogen reaction and detection. The complete hydrogen charging setup is shown in Figure 5. To avoid diffraction contribution from the single-crystal sapphire which was used for powder holding, a lead mask was placed in front of the detector, and these masked area can be seen as white spots on diffraction rings (Figure 5b). The details of the hydrogenation and dehydrogenation procedure is described in Paper A and Paper B.
Figure 5: a) Close-ups of the gas loading cell, b) A raw image of the Debye-Sherrer rings, c) The resulting diffractogram after correction and integration, d) Photos of the experiment setup at ID15B.
Neutron beam line setup
Neutron diffraction measurements for the gaseously deuterated Zr powder with 1:1 stoichiometric composition were performed on SPODI at FRMII rector source. Measurements were performed in Debye-Scherrer geometry with monochromatic neutrons (λ=1.548211 Å).
The powder sample was filled into a vanadium container that measured 40 mm long and 13 mm in diameter with a wall as thin as 0.15 mm under argon (Ar) environment in glove box. Then, the sealed sample container mounted into a vacuum high-temperature furnace available at beam line. To ensure quality of the data refinement, the each measurement was acquired with 40 steps (2º/0.05º) with several overlaps and 300 000 counts. The details of beam line, setup and heat treatment are described in Paper C.
Structural analysis
Rietveld Refinement
The Rietveld refinement is a whole pattern fitting structure refinement method which was first introduced by Hugo Rietveld in 1967 [25] and now has become an important method for structural analysis of nearly all classes of crystalline materials. In this approach, the calculated diffraction profile from a crystal structure model is compared to the observed profile, and a non-linear least square refinement is used to minimize the difference between these two profiles by adjusting various refinable model parameters. The quantity minimized therefore is in general form:
∆= ∑ 𝑤𝑤
𝑖𝑖 𝑖𝑖{𝑌𝑌
𝑖𝑖(obs) − 𝑌𝑌
𝑖𝑖(calc)}
2, (4.1)
where
𝑌𝑌
𝑖𝑖(obs)
= observed intensity at the𝑖𝑖
th step,𝑌𝑌
𝑖𝑖
(calc)
= calculated intensity at the𝑖𝑖
th step, and𝑤𝑤
𝑖𝑖 = weight of each observation.
Compared with other whole pattern fitting methods, like Pawley and Le Bail, in the Rietveld method the integrated intensities are included into all calculations as functions of relevant instrumental, specimen and structural parameters. This is fundamentally different from both Pawley in which the integrated intensities are regarded as free least square variables, and LeBail in which integrated intensities are determined iteratively after each refinement cycle [23,25].
The successful Rietveld refinement requires a reasonable initial approximation of many free variables. These usually include peak-shape parameters, zero shift error, unit cell dimensions and coordinates of all atoms in the model of the crystal structure. Other unknown parameters, such as background, scale factor, atomic displacement, etc., may be simply guessed at the beginning and then effectively refined as the refinement converges to a global minimum. These important refinable model parameters can be summarized into two distinct groups as listed in Table A-3 in Appendix A.
The peak positions and shapes of the diffraction pattern are mainly defined by instrument and geometry related parameters, and the intensity of diffraction pattern is mainly defined by structural and phase related parameters. Commonly used refinable parameters are tabulated in Table A-3 in Appendix A. Due to the high correlation between various model parameters in the Rietveld method, there will be instant divergence if too many non-linear variables are refined simultaneously or in wrong order with wrong combination. Therefore, it is important to perform refinement in sequential order from most linear and stable parameters to non-linear and less stable parameters. The best known Rietveld
In the Rietveld method, the residual function, Δ, is minimized through adjusting refinable parameters until it converges and achieves best fit. In order to measure the process of convergence and evaluate the quality of the fit, it is useful to have statistical agreement factors (fitting criteria). In the Rietveld method, several criteria have been developed for such purpose and are commonly known as “R-values”. Most commonly used fitting criteria are [23,25]:
𝑅𝑅
𝑃𝑃=
∑|𝑌𝑌𝑖𝑖(𝑜𝑜𝑜𝑜𝑜𝑜)−𝑌𝑌∑ 𝑌𝑌𝑖𝑖(𝑜𝑜𝑜𝑜𝑜𝑜)𝑖𝑖(𝑐𝑐𝑐𝑐𝑐𝑐𝑐𝑐)|(R-profile)
𝑅𝑅
𝑤𝑤𝑤𝑤= �
∑ 𝑤𝑤𝑖𝑖(𝑌𝑌𝑖𝑖(𝑜𝑜𝑜𝑜𝑜𝑜)−𝑌𝑌𝑖𝑖(𝑐𝑐𝑐𝑐𝑐𝑐𝑐𝑐)) 2 ∑ 𝑤𝑤𝑖𝑖(𝑌𝑌𝑖𝑖(𝑜𝑜𝑜𝑜𝑜𝑜))2�
1/2(R-weighted profile) (4.2)
𝑅𝑅
𝑒𝑒𝑒𝑒𝑤𝑤= {
∑ 𝑤𝑤(𝑀𝑀−𝑃𝑃) 𝑖𝑖𝑌𝑌𝑖𝑖(𝑜𝑜𝑜𝑜𝑜𝑜)2}
1/2(R-expected)
𝐺𝐺𝐺𝐺𝐺𝐺 = 𝑐𝑐ℎ𝑖𝑖
2=
𝑅𝑅𝑤𝑤𝑤𝑤 𝑅𝑅𝑒𝑒𝑒𝑒𝑤𝑤= {
∑ 𝑤𝑤𝑖𝑖(𝑌𝑌𝑖𝑖(𝑜𝑜𝑜𝑜𝑜𝑜)−𝑌𝑌𝑖𝑖(𝑐𝑐𝑐𝑐𝑐𝑐𝑐𝑐))2 𝑀𝑀−𝑃𝑃}
1 2(Goodness of fit),
where M is the number of observations (data points) and P is the number of parameters. Since a simple sum of all differences relative to all observed values defined in Rp,
overemphasizes the strong reflections in the diffraction profile, a weighting scheme been developed. The expected R value, Rexp, is mainly determined by counting statistics, hence,
it defines the best possible fit of the data with M data points and refined with P number of parameters. Considering that Rwp takes a minimized residual into consideration and
connects minimized residual with all weighted observed data, it has more mathematical values than others. The GOF is just another way of evaluation and its name comes from probability theory. Though, among these fitting criteria, Rwp, is the one which is often used
in literature. However, in certain cases both Rwp and other values does not give a good
judgment of the refinement result. Thus, they should not be used as sole criteria for judging the quality of the fit and determining factor of the convergence. Instead the graphical inspection as well as physical reasonableness of the refined model should be used as main criteria.
Data Analysis
The structure analysis software packages Topas-Academic [23] and GSAS [24] were used for the Rietveld and Pawley refinements. The basic crystal structure information of the various Zr-hydride phases and pure Zr needed for both Rietveld and Pawley methods was obtained from the literature [1].
The FCT structure is equivalent to the primitive BCT structure but with a lattice spacing
aFCT=
√2𝑎𝑎
𝐵𝐵𝐵𝐵𝐵𝐵, cFCT=cBCT. Even if BCT is considered more fundamental than the FCT, thecrystal structure of ε-ZrHx is commonly presented as a FCT structure in literature [1].
to BCT parameter, then performed both Pawley and Rietveld refinements on each spectrum. However, to be consistent with other literature and make the understanding easier, the refined unit cell parameters of ε-ZrHx are presented as FCT in appended paper
and as BCT in this dissertation. The equivalence of BCT and FCC is illustrated in Figure A-1 in Appendix A.
Both Pawley and Rietveld refinements were performed on the full diffractogram which spans from 0.37 to 9.46 degrees in 2θ and correspondingly 21.71 to 0.86 Å in d-spacing (for in-situ hydrogenation data). The peak profiles were modeled with a modified Thompson-Cox-Hastings pseudo-Voigt (pV-TCHZ) profile function [23]. The background was fitted with a Chebyshev function with five coefficients and the zero angular shift error calibrated with a standard
LaB
6 reference specimen. As our material in question is a high purity, fine grain powder, we did not considered any preferred orientation or texture effects in our analysis. The fractional coordinates were not refined in any refinements.In the first diffraction pattern, the following parameters were refined in the Rietveld refinement: scale factor, unit cell, background, and peak-widths, as well as asymmetry parameters, temperature factor and hydrogen occupancies. During batch refinement, all instrument related parameters were kept fixed. The Pawley refinement, also carried out in same strategy.
Results and discussion
In-situ hydrogen loading experiment
All observed diffraction patterns collected at different time and temperature during hydrogenation and dehydrogenation process of two different measurements are shown in Figure 6 as a two-dimensional plot, viewed down the intensity axis, with diffraction pattern number, time and temperature along the y-axis and peak positions along the x-axis. The heat treatment history is shown to the left of each diffraction pattern.
Figure 6: Complete phase transformation during two different hydrogenation and dehydrogenation processes at different heating cycles. a) From pre-hydrated sample, b) pure Zr-powder.
For clarity purpose, several selected diffraction patterns before, during and after hydrogenation from Figure 6b are compared in Figure 7. X-ray diffraction patterns in Figure 7 and the diffraction map in Figure 6b clearly show that in the beginning of charging there is only pure α-Zr phase. After introducing hydrogen gas at 313 ºC the α-Zr phase quickly transformed into δ-hydride phase. Then, the δ phase transformed into hydrogen rich FCT ε-hydride phases. This whole transition from α-Zr phase to ε-hydride phases is completed in about ten seconds. After completion of the δ to ε transition, there was not any structural change observed for about an hour. To see the reversibility of this transition the temperature was increased to 613 oC and the system was degassed. During
this process, the hydrogen rich ε-Zr hydride continuously transformed back to cubic δ-hydride at temperature at about 518 oC (Figure 6b & Figure 7).
Figure 7: Selected diffraction patterns obtained during heat treatment cycles. The color coded, small vertical tick marks represents HKL peak positions of the labelled phases.
In order to help understanding, the transformation region 4 + 5 in Figure 6b are shown separately in Figure 8. From Figure 8 and Figure 6b, one can clearly see that the transformation between δ- and ε-Zr hydride phases is completely reversible, and the transformation is continuous. The detail analysis and definition of transformation order between δ- and ε-Zr hydride phases is described in Paper B.
As marked with an arrow in Figure 8, at 556 ºC during the degassing process, a part of the δ hydride phase first transforms into α-Zr phase, and later on at 195 ºC it also transforms into γ-hydride phase. However, at room temperature the amount of δ-hydride phase that transformed into α-Zr and γ-hydride phases were not substantial. In the end of the measurement still 81 wt% of δ-hydride remains in the system (Figure 9). The color
coded horizontal tick marks in Figure 8 represent a Bragg peak position of each corresponding phase noted with same color on top.
Figure 8: Indexed transformation map of a) region 2 and b) region 4 + 5 in Figure 6b.
Figure 9: Rietveld refinement result (red) of the last measurement (black) from the in-situ hydrogen loading.
Each Rietveld refinement was performed using the structural models of all possible occurring Zr and hydride phases listed in Table 1. Figure 11 shows one typical resulting plot from the Rietveld analysis of a measurement seen in Figure 6a. The refined compositions and as well as other relevant parameters of the refinement are listed in Table 3.
Figure 10: A typical Rietveld fitting result of pre-hydrided sample. The figure on top is the full scale diffractogram, and the figure at the bottom is a magnification of the enclosed region.
During hydrogenation, the lattice parameter a of δ-phase is found to gradually increase and c decreases to convert the cubic structure to tetragonal structure (Figure 11a). Reversibly, during dehydrogenation the tetragonality of the ε-phase gradually decreases as shown in Figure 11b, and c/a ratio of the ε-phase slowly approaches unity with
The structural changes between δ → ε and ε → δ are found to be continuous and there is no discontinuity in between (Figure 6b, Figure 8 & Figure 11). These results justify that the crystal structure of ε and δ are continuously adopting itself between the tetragonal space group i4/mmm to the cubic Fm-3m depending on temperature and hydrogen concentration with a second order phase transformation character. This result is very similar to what Yakel [40] found for Ti-hydrides, which is chemically and physically very similar to the Zr-hydrides.
Table 3: Rietveld refinement result from pattern 30 in Figure 6a.
Parameter α-Zr ε-ZrHx δ-ZrHx a [Å] 3.23938 3.51674 4.78630 c [Å] 5.15980 4.46950 4.78630 V [Å3] 46.89076 55.27641 109.6478 Wt % 45.645 47.593 6.762 Rbragg 3.166 3.657 4.462 Scale factor 4.6695×10⁻⁵ 4.0625×10⁻⁵ 1.4606×10⁻⁶
Space group P63/mmc I4/mmm Fm-3m
Zr atomic coordinates x=1/3, y=2/3, z=1/4 x=0, y=0, z=0 x=0, y=0, z=0
H atomic coordinates - x=0, y=1/2, z=1/4 x=1/4, y=1/4, z=1/4
Zr_beq 0.5002 0.6388 0.00001
H_beq - 0.8034 0.00001
Zr occupancies 1 1 1
H occupancies - 1 0.82
Figure 11: a) is the Pawley fitting result for the hydrogenation (region 2 in Figure 6b), and b) dehydrogenation process (region 4 in Figure 6b), respectively. The embedded figure shows the c/a ratio versus temperature of the same transition. Error bars are included and they are smaller than the markers.
To the best of the author’s knowledge, the complete reversible transformation between the δ- and ε-phases in the Zr-H system has not been earlier recorded. The only available transformation between these two phases which shows a similar transition to this observation is assembled by Zuzek et al. [1] for temperature range between -200 to 630 ºC, based on three different sets of [40,41,43] experimental data. From Figure 12, one can clearly see that the transition temperature between δ and ε, observed in this current study, is significantly different than that reported by Zuzek et al. [1]. Such a large difference might arise because of: 1) in this study the dehydrogenation (degassing) of powder taken place at the same time as the temperature is decreased, but in these three experiments they only decrease the system temperature; 2) different test material with different composition and grain size; 3) the oxygen contamination might change the transition temperature as what these authors claimed. Another measurement with similar setup as in [1] or with the current study is needed to make final conclusion about exact transition temperature.
Figure 12: Comparison of unit cell parameters obtained by the present Pawley refinement with literature [1].
To assess the confidence of the calculation, observed and calculated spectra from the Rietveld refinements of region 4 in Figure 6b are compared in Figure 13. Figure 13 presents 2D stacks of (a) measured data, (b) calculated spectra, and (c) difference plot. As shown, the similarity of both peak intensities and their variations, as well as background intensities are excellent which gives confidence that the measurements and calculations are good.
Figure 13: a) Observed diffraction pattern of region 4 in Figure 6b, b) calculated pattern from Rietveld refinement of a), c) the difference between observed and calculated pattern.
The lattice parameters of α-Zr phase after post heat treatment, obtained in this study (
𝑎𝑎
= 3.24205 Å and𝑐𝑐
= 5.16645 Å) are in very good agreement with those reported in [1,2]. During heat treatment till complete phase transformation, the α-Zr phase showed close to linear thermal expansion behavior respect to temperature as depicted in Figure 14. The α-Zr phase did not yield exactly the same lattice parameters after cooling from 613 ºC to room temperature, instead it showed a little expanded structure as shown in Table 1. The small differences of the α-Zr phase unit cell parameters at room temperature prior to annealing might be caused by previous hydrogen charging, where the dissolved hydride could have caused the powder grain size to be smaller than originally, which could lead to slightly larger unit cells (on average) since the surface/bulk ratio is larger. As shown in Figure 8 and Figure 9, in the end of the heat treatment cycle there are α-Zr phase, δ-hydride and γ-hydride phase in the system, and according to the Rietveld analysis the amount of δ-hydride phase is quite substantial (81.94%). Since now α-Zr phase coexists with δ-hydride phase, the internal strains induced on the α-Zr phase might cause that small changes. The lattice parameters of δ hydrides after heat treatment are in good agreement with data published in the literature [1,2].Figure 14: α-Zr phase lattice parameters (a and c) versus measurements. The measurement numbers are same with Figure 6b.
In-situ neutron diffraction studies
Externally deuterated Zr powder with hydrogen concentration of 1:1 in atomic ratio showed a mixture of δ- and ε-Zr hydride(Figure 15a). The quantitative Rietveld analysis revealed that the amount of existing the ε-phase is 42 wt%, δ-phase 8 wt% and α-Zr phase 50 wt%. As the whole powder handling is taken under great care, no diffraction peaks which corresponds to Zr-oxides were observed. The results of two typical Rietveld refinements from data collected at room temperature before treatment (as-received sample, Figure 15a) and after the treatment (Figure 15b) are shown in Figure 15. In Figure 15, the diffraction profile in blue color is the observed data, the profile in red is the calculated pattern and the grey is the difference plot. The blue, black and green vertical marks represents the peak position of the α, δ and ε phases respectively. From the difference plot and weighted R values, one can see that the fitting results are quite satisfactory.
As shown in Figure 15, at room temperature after annealing it was observed that there are clear shoulders next to some of the α-Zr peaks. Any attempt to fit these shoulders with all currently reported hydride phases including recently reported ζ-ZrH0.25-0.5 [29], common
Zr-oxides and Zr-nitrides did not yield satisfactory result. Additionally, the existence of such side peaks have not been reported. It is not clear that whether such shoulder always
limited knowledge, author could not able to explain what might be the possible cause of such observations. To verify this observation another experiment at similar setups is needed.
Figure 15: a) The Rietveld fit of the deuterated Zr powders at room temperature (25 °C) before heat treatment, b) after annealing at room temperature (25 °C). The Rwp (R-weighted pattern) is the criterion of the fit.
The neutron powder diffraction patterns collected during heating from room temperature to 286 °C are shown in Figure 16. To make the understanding and visual observation easier, five patterns from temperature interval 25 to 190 °C are plotted on top of each other. From this figure it can be clearly seen that all the peak positions and shapes of the diffraction patterns in the temperature interval 25 to 190 °C are identical, but when the system temperature just reaches 286 °C a significant phase change is observed. This is highlighted by multiple diffraction peaks appearing/disappearing and changing in intensity. A few selected peak positions with significant change are marked with purple arrows in the figure. This implies that there are no phase changes in between 25 to 190 °C, instead phase transformation takes place around 286 °C.
Figure 17 shows diffraction patterns acquired when the temperature just reached 286 °C and five hours later at same temperature. As shown, in the beginning there are quite strong
ε-phase peaks, but after five hours all ε-phase peaks disappear and δ-phase peaks become
stronger with indication of a ε→δ transformation. Important structural parameters of the as-received sample from the Rietveld analysis are shown in Table 4 with statistical parameters and other supporting information.
Figure 16: Stack of neutron diffraction patterns collected during heating.
Table 4: Results of Rietveld refinement at 286 ºC after the ε to δ transformation.
Formula δ-ZrH1.66 λ [Å] 1.548211 Bkg 5 a [Å] 4.78381 V [Å3] 109.4767 Space group Fm-3m Wt % 54.019 Rwp 3.600 Rexp 0.935 Peak profile, TCHZ peak type U -0.1588, V 0.34924, W -0.04575, Y 0.73173, X 0.0, Z 0.0 Zr atomic coordinates x=0, y=0, z=0 Zr_beq 0.7295 D atomic coordinates x=0.25, y=0.25, z=0.25 D_beq 0.87
Figure 17: Observed diffraction patterns at 286 °C.
Quantitative estimations of α-, δ- and γ-phases were made with the mass volume relationship [23]:
𝑊𝑊
𝑤𝑤= 𝑆𝑆
𝑤𝑤(𝑍𝑍𝑍𝑍𝑍𝑍)
𝑤𝑤⁄
∑
𝑛𝑛𝑖𝑖=1𝑆𝑆
𝑖𝑖(𝑍𝑍𝑍𝑍𝑍𝑍)
𝑖𝑖, (5.1)
where W=relative weight fraction of phase p; S=scale factor; Z=atomic mass; M=number of formula units per cell; V=unit-cell volume. Figure 18 summarizes the phase quantity variation of each phase during complete heat treatment in the Zr powder obtained by quantitative Rietveld analysis. From Figure 18, it is apparent that there is a substantial amount of hydride phases in the powder. This implies that the deuteride preparation route developed in this study is quite functional and promising. As shown in the figure, the amount of δ-phase present in the structure was in a complementary relationship with phase. Starting at 23 wt% at room temperature, the amount of δ-phase increased as ε-phase decreased, at 286 oC after five hours of baking all of the ε-phase transformed into
δ-phase (78.64 wt%). The amount of the α-Zr phase during whole experiment was quite consistent. The α-Zr phase started with 23.48 wt% at room temperature and dropped slightly to 21.36 wt% at 286 oC after complete ε→δ transformation, then, ended with 22
wt% at room temperature after cooling. To prevent any confusion and make the figure more readable the phase quantity of the α-Zr phase was not included in the figure.
Figure 18: The δ- and ε-phase fraction variations with temperatures. To prevent confusion the α-Zr phase is not included. The volume fraction of the α-Zr phase is in average 23 wt%.
Diffraction patterns obtained at 286 °C (after 5 hour baking), 150 °C and 25 °C during the cooling cycle are identical (Figure 19). This indicates that the phase transformations that happened during heating is not reversible. To make visualization and comparison easier the diffraction profile collected at same temperature is presented in same color as in Figure 16 in this chapter and Figure 4 in Paper C. From Figure 15, 16 and 18, it can be seen that the transformation from ε to δ started as a mixture of three phases (α+δ+ε) and completed in slow rate at 286 oC for several hours with the indication that the sample was
not homogeneous and in equilibrium state in the beginning, but after transformation the hydrogen concentration homogenizes and it reaches equilibrium. This is supported by the observation that after the system temperature returned to room temperature, these hydrides which transformed to δ-Zr hydride will not transform back to ε-Zr hydride. Lattice parameter variations with respect to temperature of α-Zr phase are shown in Figure 20, and δ-Zr hydridetogether with ε-Zr hydrideare presented inFigure 12. As shown in Figure 20, during heat treatment (both heating and cooling), the α-Zr phase showed close to linear thermal expansion behavior respect to temperature. The calculated lattice parameters of α-Zr, δ- and ε-Zr hydrides obtained in this study before and after the heat treatment are in very good agreement with reported values [1].
Figure 19: Observed diffraction patterns from cooling cycle.
Figure 20: Variations of α-Zr lattice parameters with respect to temperature. In this figure, face filled markers represent heating, and un-filled markers cooling.
Conclusions
In-situ hydrogen charging and in-situ heat treatment studies were performed on high
purity Zr powder at ID15-B in ESRF and at SPODI in FRM2, respectively, with a purpose of identifying the formation mechanisms, stability and crystal structures of various Zr-hydrides. The following are the general conclusions:
• The present study has demonstrated the potential use of high energy synchrotron diffraction and neutron diffraction on in-situ measurement of phase transformation and identifications of the Zr-H system.
• By using a high pressure/high temperature gas loading capillary system at the ESRF together with large area detector, it is found to be possible to observe fast phase transformations in real time.
• For the first time, in-situ hydrogen loading experiment was performed on high purity Zr powder at a 3rd generation synchrotron X-ray radiation facility, and
complete reversible transformation between ε and δ was recorded with a single setup.
• The hydrogen rich ε-phase reversibly transforms to first pure δ-phase and then
α-Zr + δ-hydride as a function of hydrogen/Zr ratio as H2(g) was degassed from the
system at 600 ºC.
• Despite slow cooling rate, the γ-hydride was observed during in-situ
hydrogenation studies.
• The high temperature gas loading procedure is an effective way to produce deuterated samples for investigation of the Zr-deuteride structures.
• The preparation route which was implemented in the neutron diffraction study does not produce a γ-hydride phase; instead it gives a δ- and ε-phases at room temperature.
• After cooling there are shoulders observed next to the α-Zr peaks.
• The determined lattice parameters of α-Zr, δ-ZrHx and ε-ZrHx are in good
Reference
[1] Zuzek E, Abriata J, San-Martin A, Manchester F. Bulletin of Alloy Phase Diagrams 1990;11:385.
[2] Steuwer A, Santisteban JR, Preuss M, Peel MJ, Buslaps T, Harada M. Acta Materialia 2009;57:145.
[3] Olsson PAT, Massih AR, Blomqvist J, Alvarez Holston AM, Bjerkén C. Computational Materials Science 2014;86:211.
[4] Lanzani L, Ruch M. Journal of Nuclear Materials 2004;324:165.
[5] Clayton, J.C. Internal hydriding in irradiated defected Zircaloy fuel rods. In: Leo F. P. Van S., Craig M. Zirconium in the Nuclear Industry: Eighth International Symposium, ASTM international, San Diego, US. 1989,1023:266.
[6] Singh KP, Parr JG. Transactions of the Faraday Society 1963;59:2256.
[7] Singh RN, Mukherjee S, Gupta A, Banerjee S. Journal of Alloys and Compounds 2005;389:102.
[8] Coleman CE, Hardie D. Journal of Less Common Metals 1966;2:168. [9] Northwood DO, Kosasih U. International Materials Reviews 1983;28:92.
[10] Kerr, M. PhD thesis, Mechanical Characterization of Zirconium Hydrides with High Energy X-Ray Diffraction, Mechanical and Materials Engineering, Queen's University 2009.
[11] Tulk E, Kerr M, Daymond MR. Journal of Nuclear Materials 2012;425:93. [12] Root JH, Small WM, Khatamian D, Woo OT. Acta Materialia 2003;51:2041. [13] Kolesnikov AI, Balagurov AM, Bashkin IO, Belushkin AV. Journal of Physics:
Condensed Matter 1994;6:8977.
[14] Bowman RC, Venturini JEL, Craft BD, Attalla A, Sullenger DB. Physical Review B 1983;27:1474.
[15] Cassidy MP, Wayman CM. Metallurgical and Materials Transactions A 1980;11:57. [16] Veal BW, Lam DJ, Westlake DG. Physical Review B 1979;19:2856.
[17] Mueller WM, Blackledge JP, & Libowitz GG. Metal hydrides. California: Academic Press, 1968.
[18] Ivashchenko VI, Ivashchenko LA, Srynsckyy PL, Grishnova LA, Stegnyy AI. Ab Initio Study of the Electronic Structure and Phonon Dispersions For TiH2 and ZrH2.
In: Baranowski B, Zaginaichenko S, Schur D, Skorokhod V , Veziroglu A Editors. Carbon Nanomaterials in Clean Energy Hydrogen Systems, Springer Netherlands, 2009. p. 705.
[19] Cantrell JS, Bowman Jr. RC, Sullenger DB. Journal of Physical Chemistry 1984;88:918.
[20] Barraclough KG, Beevers CJ. Journal of Nuclear Materials 1970;34:125. [21] Moore KE. Journal of Nuclear Materials 1969;32:46.
[22] Andrieux J, Chabert C, Mauro A, Vitoux H, Gorges B, Buslaps T et al. Journal of Applied Crystallography 2014;47:245.
[23] Coelho, A. Topas Academic: Technical Reference;V4.1:http://www.topas-academic.net/, 2004.
[24] Larson, AC, Von Dreele, RB. Los Alamos National Laboratory Report LAUR 2000:86.
[25] Young RA. The Rietveld Method. New York: Oxford University Press, 1995. [26] Hoelzel M, Senyshyn A, Juenke N, Boysen H, Schmahl W, Fuess H. Nuclear
Instruments and Methods in Physics Research Section A: Accelerators, Spectrometers, Detectors and Associated Equipment 2012;667:32.
[27] Bjerkén C, Massih AR. Philosophical Magazine 2013;94:569. [28] Okamoto H. Journal of Phase Equilibria and Diffusion 2006;27:548.
[29] Zhao Z, Morniroli J-, Legris A, Ambard A, Khin Y, Legras L et al. Journal of microscopy 2008;232:410.
[30] Paul LB, Federico JM, Jane P, & Myriam I. Chemical thermodynamics of zirconium. Amesterdam: Elsevier Science, 2005.
[31] Kolesnikov AI, Bashkin IO, Belushkin AV, Ponyatovsky EG, Prager, M. Journal of Physics: Condensed Matter 1994;6:8989.
[32] Small WM, Root JH, Khatamian D. Journal of Nuclear Materials 1998;256:102. [33] Mishra S, Sivaramakrihnan KS, Asundi MK. Journal of Nuclear Materials
1972;45:235.
[34] Lemaignan C, & Motta AT. Zirconium Alloys in Nuclear Applications. Materials Science and Technology. New York: Wiley-VCH Verlag GmbH & Co. KGaA, 2006. [35] Clara Anghel. PhD Thesis, Modified oxygen and hydrogen transport in Zr-based
oxides, Royal Institute of Technology, KTH, Stockholm 2006 [36] GoodFellow. http://www.goodfellow.com/E/Zirconium.html 2014:1. [37] Varley FS. Neutron News 1992;3:29.
[38] Banerjee, S, Mukhopadhyay, P. Pergamon Materials Series 2005;12:840.
[39] Geelhood, KJ, Beyer, CE, Luscher, W. Pacific northwest national laboratory, U.S. Department of Energy 2008;PNNL-17700:1.
[40] Yakel JHL. Acta Crystallographica 1958;11:46.
[41] Moore KE, Young WA. Journal of Nuclear Materials 1968;27:316. [42] Daniels JE. Journal of Applied Crystallography 2008;41:1109.
[43] Kempter CP, Elliott RO, Gschneidner KA. The Journal of chemical physics 1960;33:837.
[44] IAEA. International Atomic Energy Agency (IAEA) Technical report IAEA-TECDOC-996:1, 1998.
Appendix A
Table A-1: Nominal composition of most common Zr-alloys [10,44].
Unit Elements Zry2 Zry4 Zr-1Nb Zr-2.5Nb Zirlo M5 Excel
Wt% Sn 1.2-1.7 1.2-1.7 0.9-1.1 - 1 3.5 Fe 0.07-0.2 0.18-0.24 <500ppm <650ppm 0.1 Cr 0.05-0.15 0.07-0.13 - <100ppm - Ni 0.03-0.08 - <200 ppm <35ppm - Nb - - 1.0 2.5 1 1 0.8 Mo 0.8 ppm O 900-1300 900-1400 <1000 900-1300 1000-1400 0.125% N <80 <65 <60 <65 H <25 <25 <15 <5 C <270 150-400 <200 <125 P - - - <10
Comment: Other impurity and minor alloying elements: Al<75 ppm, B and Cd<0.5 ppm, Co and Mg<20 ppm, and Hf<50-150 ppm. Al, B, Cd, Hf, N, O, Sn, Pb are α stabilizer and Cr, Co, Cu, Mn, Fe, Mo, Ni, Nb, Ag, Ta, Th, Ti, U, V are β stabilizers.
Table A-2: Material properties of few structural materials [34,37].
Element Be Mg Zr Al Nb Mo Fe Cr Ni Ti
Neutron capture cross
section [b] relative to Be 1 7 20 24 122 278 281 322 512 609
Melting point [oC] 1283 650 1852 660 2415 2625 1539 1890 1455 1660
Table A-3: Refinable parameters in Rietveld refinement.
Instrument and Sample Structural and Phase
2θzero zero error Scale Overall scale factor
bkg Background a,b,c,α,β,γ Unit cell metric
parameters
SD Sample displacement xn,yn,zn Fractional atomic
coordinates
U,V,W Peak width parameters beqn Isotropic temperature
factor
P, η, etc. parameter(s) Peak shape βij Anisotropic temperature
factor
PO Preferred orientation Occn Site occupation factor
Simple_Axial_Model Axial divergence CS-L, CS-G Grain size
Ab Absorption Strain_L, Strain_G Strain
Figure A-1: a): BCT lattice in a FCT (or FCC) lattice. The green is the visible atomic sites and light grey is not visible. The atomic site marked with red is the center of the BCC lattice shown.
![Figure 1: a) An illustration of a hydrogen induced degradation in nuclear fuel cladding; b) Redrawn binary Zr-H phase diagram based on data provided in [1]](https://thumb-eu.123doks.com/thumbv2/5dokorg/4109383.86908/16.756.159.613.157.851/figure-illustration-hydrogen-degradation-cladding-redrawn-diagram-provided.webp)


![Figure 3: a) Compiled temperature–pressure phase diagram of Zr and Ti based on experimental data provided in [38]; b) crystal structure of β-Zr and β-Ti; c) crystal structure of α-Zr and α-Ti](https://thumb-eu.123doks.com/thumbv2/5dokorg/4109383.86908/22.756.66.649.230.638/figure-compiled-temperature-pressure-experimental-provided-structure-structure.webp)