Erosion and runoff generation from fire disturbed Mediterranean forest area
11
0
0
Full text
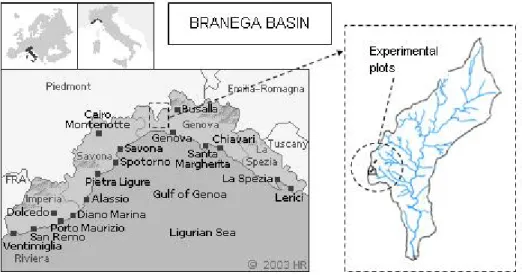
(2) Rulli et al.. The watershed response to fire is governed by many interacting factors, as the moisture content, the vegetation and the fire intensity. During a wildfire, the organic compound within the burning vegetation can vaporize. The vapour moves through the soil and, at a depth characterized by at lower temperature, it condenses forming a water-repellent layer (hydrophobic soil) (DeBano, 2000). The presence of the latter can cause an increment in the runoff production and in the sediment erosion (Dekker et al.,1994, Letey et al., 2000, Letey, 2001). The amount of sediment produced after wildfire is strongly influenced by the rainfall rate and the lag between the meteoric event an the wildfire. After a wildfire, a critical time window exists during which the erosion effect of the rainfall is greatest. To correctly point out the possible mitigation strategies, one needs to understand the processes controlling the soil erosion and the landscape response in post-fire condition. The aim of this project is to quantify the increase in soil erosion and in runoff production caused by the passage of fire in a Mediterranean area. To this end, some experiments were performed using a rainfall simulator, shedding precipitation onto two plots, approximately 4m by 8m. The plots were located the same basin, but one in a burned zone and the other one in an undisturbed zone. The study area was located a few kilometres from Genoa, the main city of the Liguria region, in north west Italy, and it is representative of the Mediterranean environment. Many wildfire have affected this area in the last years (85 fire events from1975 to 2003), causing serious damages to people and environment.. 2. Study Sites The study plots are located in the Branega catchment, 4.8 km2, 14 kilometres from Genoa, burned in early August 2003 (Figure 1) The local climate is Mediterranean with wet cool winter and dry warm summers. Months preceding the August 2003 wildfire were extraordinary dry and hot and the catchment received only 105 mm of rainfall from May to August. Average annual rainfall is about 1400 mm and it falls mostly during autumn, from October to December and during spring, from March to May. Intensity-frequency-duration curves for this area show that hourly rainfall with intensity of 100 mm/hr has a return period of 20 years.. 248.
(3) Erosion and runoff generation from fire disturbed Mediterranean forest area. Figure 1. Location of the Branega catchment and the experimental plots. Mean annual temperature is around 12°C. Elevation ranges from 0 m a.s.l. to 88 m a.s.l., with an average elevation of 288 m a.s.l. The mean slope of the catchment is 52%, with southerly aspect. Before August 2003 forest fire, the vegetation was dominated by a wood of Pinus Pinaster A., and by the typical shrubs of Mediterranean vegetation (Erica arborea L., Erica scoparia L., Arbutus unedo L., etc.).. 3. Plot characteristics The experiments were carried out on two 30m2 plots, approximately 4m by 8m. They were located on the same soil series, slope and vegetation cover (the control plot presented the vegetation type, that was present in the burned area before fire occurred). It was also considered the access to the rainfall simulator equipment and to the tanker and the limitation of the rainfall simulator with steep slopes. The morphology of the burned plot was characterized by a straight slope in the upper part and by a impluvium in the lower part, with a S-E aspect, while the unburned plot had a straight slope over the whole length, with a S-E aspect. Average plot slope was calculated from measures of the local slope, taken with a clinometer, and it resulted 24.4 % for the burned plot and 32.3 % for the unburned. The burned plot had over 90% bare soil compared with less than 20% in the unburned site and the remaining 10% was constituted of burned roots and stones. The vegetation of the control plot was characterized by Erica arborea and Erica scoparia in the upper part of the plot and by small pine trees in the lower part. The study plots have a different fire history: one was burned during the 2003 fire, and the other didn’t suffer that event. Both plots were subjected to the passage of a first fire in 1985 and of a second fire in 1997.. 249.
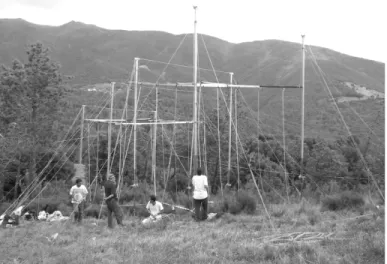
(4) Rulli et al.. 4. Rainfall simulator The experimental procedure employed a rainfall simulator built by the Italian Research National Council, CNR-IRPI/ISE. The instrument consists of a metallic square frame, on which either four or nine nozzles are stuck, depending on the desired rainfall rate: four nozzles generate a 38 mm h-1 rainfall, while nine nozzles generate a 76 mm h-1 rainfall. Each square is hoisted at 6 m over four poles and it is ensured with ropes and stakes, as shown in Figure 2.. Figure 2. Rainfall simulator. It was decided to use two basic units, to have the plots as large as possible, and nine nozzles for each square to obtain a rainfall intensity comparable to the critical event intensities of the area. Water was supplied by an electric pump and hydraulic head was properly set at each nozzle. Water was stored in containers easily assembled and dissembled for the transportation.. 5. Rainfall simulation experiments The simulations were performed six weeks after the forest fire. In the meanwhile the site received only few millimeters of rainfall. Each simulation consisted of a single 60 minutes application of rainfall at a constant intensity. The spatial distribution of simulated rainfall was assessed from 10 rain gauges placed in and around the plot. Each plot received three rainfall events: event 1 (dry) was conduced with existing soil moisture conditions, event 2 (wet) was few days after event 1 and event 3 (very wet) was conducted about two hours after event 2. The plots were bordered by 20 cm wide sheet metal, vertically inserted 5 cm into soil and the inside edges were sealed and waterproofed. Drains were also dug along the boundaries of the plots to avoid infiltration from outside. A covered trough was placed at the base of each plot to channel surface runoff and eroded sediment through an outlet tube, where they were collected manually in bottles, at regular 2 or 3 minute time intervals, throughout the entire rainfall simulation. Runoff samples were weighted and filtered to determine 250.
(5) Erosion and runoff generation from fire disturbed Mediterranean forest area. runoff hydrographs and sediment yields. The soil organic matter content and the particle size distribution curve were determined for the cumulative sediment yield in every simulation. At the end of each event any sediment remaining in the trough was also collected, dried and weighted and it was considered as bed load sediment. The authors also recorded the runoff starting time and stopping time. Before the experiments, four soil samples were collected in each plot with steel cylinders of 5 cm diameter and 5 cm length. Two samples were taken at the surface (0-5 cm for the control plot and 1-6 cm for the disturbed plot, because the ash layer was removed) and two at depths of 5-10 cm and 6-11cm, for the unburned and the burned site respectively. Then the samples were weighed and dried to assess the antecedent moisture conditions. Also, saturated hydraulic conductivity was measured with a Guelph infiltrometer at two points inside the plots, for the A and the B horizons. The mean values measured at the surface (0-6 cm) show a high decrease in permeability after the fire. It was around 300 mm/hr in the unburned plot and only 45 mm/hr in the burned plot (Results supported by those in Robichaud, 2000, Martin, 2001, Scott 1993). In addition, several Water Drop Penetration Time (WDPT) tests were performed on the burned plot, six months after the rainfall simulations, to investigate the presence of a fire-induced hydrophobic layer under the soil surface. In the recently burned plot no such layer was spotted in the first 20 cm. This means either that the August 2003 fire didn’t induce the formation of a water repellent soil layer or that it weakened or disappeared at the time of the WDPT measurements. Since the longevity of the fire-induced hydrophobic layer is deeply variable between regions but usually around six years (DeBano, 2000), the time elapsed from the fire to the WDPT seems not sufficient for the restoration of the pre-burnt conditions. The absence of the water repellent soil layer in the studied site can be due to the high soil moisture content at the time of the WDPT tests. In facts, field and laboratory tests have shown that water repellency disappears when the soil exceeds a certain moisture content (Dekker and Ritsema, 1994). As a consequence, soil hydrophobicity follows a seasonal trend: it can be very severe during dry seasons, disappear after long wet periods and then re-appear again (Shakesby et al., 2000). Thus, according to the distinction between actual and potential water repellency (Dekker and Ritsema, 1994), no actual water repellency was found in the investigated area, while none can be said about the soil potential water repellency, that should be assessed on oven dried samples.. 6. Results and discussion Considering the summary of the rainfall simulations in Table 1, it has to be noticed that two problems were encountered during the experiments. The first event on the burned plot was developed in a smaller area than the other experiments on the same plot. This was due to problems encountered with the electric pump. The nozzles of the upslope square could not be used. During the second event the rainfall rate was a bit lower than required, amounting to about 68 mm h-1 and the right value of 76 mm h-1 was definitely reached only during the third experiment. The results are presented, whenever it was con251.
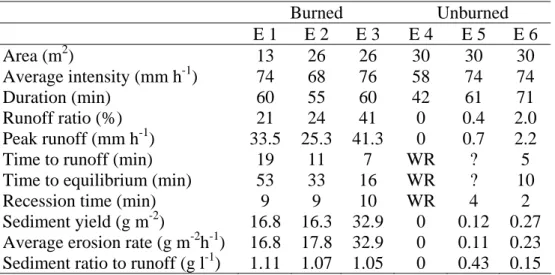
(6) Rulli et al.. venient, in non-dimensional form with respect to the area of the plots and to the amount of rainfall, as well as to rainfall duration, slightly different among the events. A second problem arose during the fourth simulated event, that is, the first simulation on the burned plot. Particularly, the unburned plot didn’t produce any runoff after 40 minutes of simulated rainfall. The simulation was interrupted to check for eventual losses. However, it was concluded that no runoff losses occurred and the event was considered valid. The extraordinary low flow rates of the following two events on the unburned plot also confirmed the result of this simulation. Table 1. Runoff and erosion data of the rainfall simulation experiments (E 1= Event 1, WR = Without Runoff, ? = not recorded). Area (m2) Average intensity (mm h-1) Duration (min) Runoff ratio (%) Peak runoff (mm h-1) Time to runoff (min) Time to equilibrium (min) Recession time (min) Sediment yield (g m-2) Average erosion rate (g m-2h-1) Sediment ratio to runoff (g l-1). E1 13 74 60 21 33.5 19 53 9 16.8 16.8 1.11. Burned E2 26 68 55 24 25.3 11 33 9 16.3 17.8 1.07. E3 26 76 60 41 41.3 7 16 10 32.9 32.9 1.05. Unburned E4 E5 E6 30 30 30 58 74 74 42 61 71 0 0.4 2.0 0 0.7 2.2 WR ? 5 WR ? 10 WR 4 2 0 0.12 0.27 0 0.11 0.23 0 0.43 0.15. The results are fully consistent with those obtained in other studies and confirm the significant impact of fire on the production of runoff and sediments. The summary of the results Table 1, clearly shows that the differences, in the hydrological and erosional responses, were extremely large between the burned and unburned plot and reasonably similar between events simulated on the same plot. 6.1.. Runoff The runoff ratio of the burned plot ranged from 21 to 41%, while, in the unburned plot, the range was from 0,4 to 2%. When comparing events simulated with the same antecedent soil moisture conditions, the runoff ratio from the burned plot was 60 times more than from the unburned, for the wet run, and 20 times more, for the very wet run. The runoff from the burned plots appeared to be generated by Hortonian mechanism, accordingly with the geomorphologic conditions of the sites, featuring by steep slopes and slightly permeable soils, and with the simulated event, which represented a severe storm, with high rainfall intensity. The surprising low runoff ratios from the unburned plot were due to the high hydraulic conductivity of the soil of the unburned site, mostly due to its high percentage of ground and canopy cover and to its coarser texture. The unburned soil could infiltrate most of the throughfall because the intensity of the applied rainfall (~74 mm/hr) was 252.
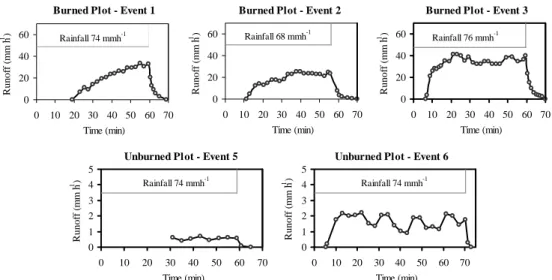
(7) Erosion and runoff generation from fire disturbed Mediterranean forest area. lower than the intensity required to generate Horton overland flow (~ 300 mm/hr) and because the soil was so deep that no saturation excess runoff could occur. The observed runoff rate in the control plot, therefore, was due to the infiltration excess mechanism which occurred in the small portion of the plot with bare soil, where small pools were noticed during the simulated event. On the contrary, the high rate of runoff from the burnt plot confirms the results obtained with the infiltrometric tests, showing that the saturated hydraulic conductivity for the burned plot is one order of magnitude less than for the unburned plot.. Anyway it is also to be considered that the differences in runoff production, between plots, can also be due to the wide differences in percentage of ground and canopy cover and in soil texture (Chandler et al., 1983, Chartres and Mücher, 1989), and to the lack of a litter zone in the burnt plot (Imeson et al.,1992). During the simulated events on the burnt plot, both overland flow and channelized flow were observed, while on the unburned plot, only sheet flow took place. The rill depths were measured in some points of the burned plot and the highest value, around 8 cm, was observed at the bottom, where many rills converged towards a single one. With respect to the runoff hydrographs of the two plots, their overall shapes were consistently related with the antecedent soil moisture conditions, with the time to runoff initiation decreasing with the humidity and the slope of the rising limb becoming steeper and steeper as the soil moisture increases (Figure 3).. 60. -1. 40 20. Rainfall 68 mmh. -1. -1. Rainfall 74 mmh. Burned Plot - Event 3. -1. Runoff (mm h ). 60. Burned Plot - Event 2 Runoff (mm h ). -1. Runoff (mm h ). Burned Plot - Event 1. 40 20. 60. 20. 0. 0 0. 0. 0. 10 20 30 40 50 60 70 Time (min). 10 20 30 40 50 60 70 Time (min). 0. 10 20 30 40 50 60 70 Time (min). Unburned Plot - Event 6. -1. Runoff (mm h ). Rainfall 74 mmh. -1. -1. Runoff (mm h ). Unburned Plot - Event 5 5 4. -1. Rainfall 76 mmh. 40. 3 2 1 0. 5 4. -1. Rainfall 74 mmh. 3 2 1 0. 0. 10. 20. 30 40 50 Time (min). 60. 70. 0. 10. 20. 30 40 50 Time (min). 60. 70. Figure 3. Runoff hydrographs of the burned and unburned plot. Comparisons between plots, based on the shape of their hydrographs, were only possible for the very wet event, which presented quite the same trend at both sites. The time to runoff initiation and the time to equilibrium runoff were 7 and 16 in the burned plot and 5 and 10 in the unburned plot. The main difference between the hydrographs regarded the duration of the falling limb, that was shorter for the unburned site, where it was 9 minutes versus 4, for the wet events and 10 versus 2, for the very wet events. The highest peak runoff rate was 41mm h-1 and it took place during the third simulated event; 253.
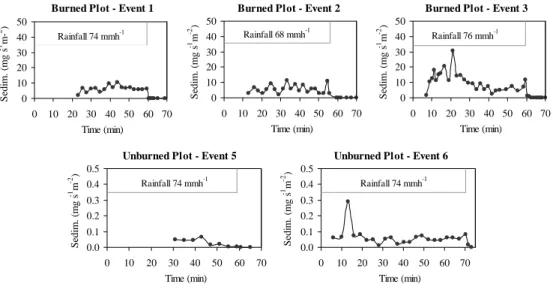
(8) Rulli et al.. the peak runoff of the second simulation was surprisingly lower than the one measured in the first experiment and the fact can be only partly ascribed to the lower rainfall intensity simulated during the second event. The observed runoff hydrographs didn’t show the behaviour that some authors found to be typical of a hydrophobic response although other studies report a moderate fire-induced water repellency but no evident hydrophobic trend of the runoff hydrographs (Benavides-Solorio and MacDonald, 2001).. 6.2.. Erosion With regard to the sediment production, large increases in sediment yields were measured from the burned plot compared with the unburned plot (Figure 4). At the burned site, the average erosion rate, that considers the total sediment yield per unit area and per hour, was about 16 g m-2 h-1 during the first two simulation and twice as much during the third one. On the contrary, the unburned plot yielded only 0,11 g m-2 h-1 of sediments, in the fifth event, and 0,23 g m-2 h-1 in the last one. Therefore, on the average, the total sediment production from the burned plot was more than two orders of magnitude higher than the control plot. The results presented by some authors, who carried out similar rainfall simulation experiments (Wilson, 1999; Johansen et al., 2001), indicate an increase in sediment yield of about one order of magnitude from pre-fire to post-fire conditions.. -1. 10 0 0. -2. -1. Rainfall 68 mmh. -1. -2. -1. Rainfall 74 mmh. 30 20. 30 20 10 0 0. 10 20 30 40 50 60 70. -2. -1. -1. Rainfall 74 mmh. 0.3 0.2 0.1 0.0 10. 20. 30. 40. 50. 60. -1. Rainfall 76 mmh. 30 20 10 0 0. 10 20 30 40 50 60 70 Time (min). Unburned Plot - Event 6 Sedim. (mg s m ). -1. -2. Sedim. (mg s m ). Unburned Plot - Event 5. 0. 50 40. 10 20 30 40 50 60 70 Time (min). Time (min). 0.5 0.4. Burned Plot - Event 3 Sedim. (mg s m ). Burned Plot - Event 2 50 40. Sedim. (mg s m ). -1. 2. Sedim. (mg s m- ). Burned Plot - Event 1 50 40. 70. 0.5 0.4. -1. Rainfall 74 mmh. 0.3 0.2 0.1 0.0 0. 10. Time (min). 20 30 40. 50 60 70. Time (min). Figure 4. Sedigraphs of the burned and unburned plot. The extremely large increase in sediment yield observed in the burned area can be due to many factors. The presence of the vegetation, in the unburned site, certainly played an important role, limiting the fraction of area affected by slash and so the detachment of soil by rainfall splash. The detachment of soil by overland flow was also deeply reduced by the presence of vegetation and litter. At the burnt site, the high runoff rate and the resulting flow velocity and height of the water level contributed as well to increase the 254.
(9) Erosion and runoff generation from fire disturbed Mediterranean forest area. sediment transport capacity of overland flow. Finally the sediment production could also be influenced by the different mean drop diameter of the soil. The soil of the burnt plot was finer because of its larger percentage of clay and silt and because of the presence of ash and charcoal, following the wildfire that passed through the area. The grain size diameter was calculated for the three events simulated on the burnt plot, while it was not possible to determine it for the eroded sediments on the control plot, because their amount was not enough.. There were no significant differences in the median grain size of the suspended and bed load sediment between the rainfall events in the burned plot. The D50 resulted to be around 0.02 mm for the suspended material and around 0.06 mm for the sediment deposited in the trough. There was also a moderate difference in the organic matter fraction, which was slightly declining with the total amount of rainfall received by the plot. This can be due to the initial availability of pine-needles and charcoal on the burnt soil, as a consequence of the passage of the fire, and to the fact that the study area didn’t received any significant natural storm before our rainfall simulations. The eroded material deposited in the runoff trough showed less marked differences between the burned and the unburned site. The trough sediment yield was 17 times higher, after the wet event on the burned plot, and 34 higher considering the very wet event. It is interesting to notice that for each plot the trough sediment concentrations tended to decline as the number of events simulated on that plot increases. It was 2,35 g m-2 for the first event and less than a half for the others on the burned plot, while on the unburned plot it was around 0.06 g m-2 for the fifth event and 0.02 g m-2 for sixth one. The sediment concentration in the runoff, that can provide a relative measure of soil erodibility, was surprisingly identical for all the events in the burnt site, around one gram per liter, and two or three times less in the unburned area. This indicates that the greater amount of sediment eroded from the burnt soil, was not only due to the higher runoff rate but was also related to fire-induced degradation of the soil and to the greater sediment mobilization from rainfall and overland flow. The temporal patterns of the sediment yield were also analyzed, considering the instantaneous erosion rates (Figure 4). During the first event the sediment erosion rate randomly fluctuated and become fixed when the runoff reaches the limit value, while during the second event it vary all over the simulation period without reaching a steady state conditions. The sedigraphs of the third and sixth events are the more consistent: they present an initial peak, followed by a flat or slightly declining trend.. 7. Conclusions The rainfall simulation experiments showed that the fire-induced changes in soil and vegetation can seriously increase the hydrological risk in the Mediterranean region. In these processes the vegetation appeared to play a leading role: the presence of many highly inflammable shrubs, typical of the Mediterranean area, increases burnt severity and consequently the disturbance of the soil that is reflected in the watershed response. The results showed the runoff ratio in post-fire condition ranged from 21 to 41%, while, in pre-fire condition, the range was from 0,4 to 2%. Simulating 255.
(10) Rulli et al.. the rainfall with the same antecedent soil moisture conditions, it resulted that the runoff ratio from the burned plot was 60 times more than from the unburned, for the wet run, and 20 times more, for the very wet run. With regard to the sediment production, fire appears to strongly accelerate soil erosion: large increases in sediment yields were measured from the burned plot compared with the unburned plot. Suspended sediment yields from the burned plot were more than two order of magnitude higher than the control plot in both events. This study suggests that an intense rainfall event can affect more the sedimentologic than the hydrologic response of a severely burnt catchment, being a potentially triggering cause of a desertification process. Acknowledgements Dr. D. Torri and Dr. P. Sanchez gave invaluable help in setting up rainfall simulator, many thanks also for supporting us with their precious experience in erosion problem. Funding for the project were provided by INRM through the project ”Analysis of hydrological and sedimentological response in burned areas”, by Liguria Region through INTERREG 3B DESERNET Project and by GNDCI -National Research Council (contract number 00.00545PF42).. References Beeson P.C, Martens S.N. and Breshears D.D., “Simulating overland flow following wildfire: mapping vulnerability to landscape disturbance”, Hydrological Processes, 15, 2917-2930 Benavides-Solorio and MacDonald, 2001, “Post-Fire runoff and erosione frm simulated rainfall on small plots, Colorado Front Range”, Hydrological Processes, 15, 2931-2952 Booker F.A.,1998, Landscape and management response to wildfires in California. Berkeley, University of California, Master Thesis Chandler C., Cheney P. Thomas P., Trabaud L. , Williams D., 1983, Fire in forestry, Forest Fire Behaviour and Effects, vol. 1, Wiley, New York (450pp) Chartres C.J., Mücher H.J., 1989, “The effects of fire on the surface properties and seed germination in two shallow monoliths from a rangeland soil subjected to simulated raindrop impact and water erosion”, Earth Surface Processes and Landforms, 12,407-417. DeBano L.F., 2000, “The role of fire and soil heating on water repellency in wildland environments: a review”, Journal of Hydrology, Volume: 231232, May 29, , pp. 195-206. Dekker L.W., Ritsema C.J., 1994, “How water moves in a water repellent sandy soil – 1. Potential and actual water repellency”, Water Resources Research, Vol. 30, No 9, Pages 2507-2517. Imeson A.C., Verstraten J.M., Van Mulligen E.J., Sevink J., 1992,”The effects of fire and water repellency on infiltration and runoff under Mediterranean type forest”, Catena 19, 345-361. Johansen P.J., Hakonson T.E., Breshears D.D., 2001, “Post fire runoff and erosion from rainfall simulation: contrasting forests with shrublands and grasslands”, Hydrological Processes, 15: 2953-2965.. 256.
(11) Erosion and runoff generation from fire disturbed Mediterranean forest area. Letey J., 2001, “Causes and consequences of fire-induced soil water repellency”, Hydrological Processes, 15, 2867-2875 Letey J., Carrillo M.L.K., Pang X.P., 2000, “Approaches to characterize the degree of water repellency”, Journal of Hydrology, 231-232,61-65 Margaris N.S., 1980, Structure and dynamics of Mediterranean type vegetation, Portugaliae Acta Biologica 16, 45-48. Martin D.A., Moody J.A., 2001, “Comparison of soil infiltration rates in burned and unburned mountainous watersheds”, Hydrological Processes, 15, 2893-2903. Naveh Z., 1975, “The evolutionary significance of fire in the Mediterranean region”, Vegetatio 29, 199-208. Pierson F.B, Robichaud P.R. and Spaeth E, 2001, Spatial and temporal effects of wildfire on the hydrology of a steep rangeland watershed”, Hydrological Processes, 15, 2905-2916. Prosser I., Williams L., 1997, The impact of wildfire on runoff and erosion in native Eucalyptus forest. Hydrological Processes, 12: 251-265. Robichaud P.R, 2000, ”Fire Effects on infiltration rates prescribed fire in Northern Rocky Mountaln forests, USA”, Journal of Hydrlogy, 231-232 Scott D.F., 1993, “The hydrological effects of fire in South African mountain catchments.”, Journal of Hydrology, 150, 409-432. Shakesby, R.A., Doerr, S.H., Walsh, R.P.D., 2000. The erosional impact of soil hydrophobicity: current problems and future research directions. Journal of Hydrology, 231-232, 178-191. Wilson C.J., 1999, “Effects of logging and fire on runoff and erosion on highly erodible granitic soils in Tasmania.”, Water Resources Research, Vol. 35, No 11, 3531-3546. Zierholz C., 1997, The effects of fire on runoff and soil erosion in Royal National Park, New South Wales. Camberra, Australian National University, Master Thesis. 257.
(12)
Figure
+2
Related documents
Studies on modern cave ventilation conditions (Spötl et al., 2005; Mattey et al., 2010) provide an excellent overview of the effects of temperature gradient-driven cave ventila-
We also discuss the equivalence of using a Monte Carlo approach - suited for inclusion in neutrino telescope Monte Carlos - and the density matrix formalism.. Identification of
My empirical approach involves computing the underlying asset volatility implied by corporate bond prices under the model of junior debt, then using the model of senior debt to
In this study, the SWAT (soil and water assessment tool) under GIS (Geographical Information System) was applied to simulate the yearly surface runoff and sediment load for the
Research question 2: the approaches that sellers use to judge the trustworthiness of buyers Once the initial trust has been built, the relationship between the buyer and the seller
This does not, however, agree with the result from the questionnaire survey, which showed that the employees of the joint-stock company overall was satisfied with the IT solutions
Our results show that these warm–dry and cold–wet compound days are associated with large values of the temperature–precipitation coupling parameter of the dynamical systems
In: Berg, N.H., (Technical coordinator), Proceedings of the Symposium on Fire and Watershed Management. General Technical Report PSW-109, U.S. Department of Agriculture,
