T-1357
ADSORPTION OF GASES ON
HOMOGENEOUS SURFACES
by
Girish Patel
ARTHUR LAKES LIBRARY CX)LORADOSCHCXDLC)FNKNES
ProQ uest N u m b e r: 10781711
All rights reserved INFORMATION TO ALL USERS
The qu ality of this repro d u ctio n is d e p e n d e n t upon the q u ality of the copy subm itted. In the unlikely e v e n t that the a u th o r did not send a c o m p le te m anuscript and there are missing pages, these will be note d . Also, if m aterial had to be rem oved,
a n o te will in d ica te the deletion.
uest
ProQuest 10781711
Published by ProQuest LLO (2018). C op yrig ht of the Dissertation is held by the Author. All rights reserved.
This work is protected against unauthorized copying under Title 17, United States C o d e M icroform Edition © ProQuest LLO.
ProQuest LLO.
789 East Eisenhower Parkway P.Q. Box 1346
T-1357
A Thesis submitted to the Faculty and. the Board of Trustees of the Colorado School of Mines in partial
fulfillment of the requirements for the degree of Master of Science in Chemical and Petroleum Refining Engineering.
Signed: G.M. Golden, Colorado Date: . S' .1971 Approved: Theirs ^Advisor of Department Golden, Colorado Date; g d . € .1971 1 1
A B S T R A C T
A static system was used to measure the pure component isotherms of freon-21{CHFClg) and ethyl chloride. The measurements were made at 323°K and at pressure range from 0 to 600 mm of mercury. Binary mixture measurements were also made at the same
temperature and at the system pressure of ^6l mm of mercury. The simplified method of Kidnay and Myers was used to predict mixture isotherms using only the pure component isotherms and gave satisfactory results.
ARTHUR LAKES LIBRARY COLORADO SCHOOL OF MINES
SOLDEN, C O W R AD O
Dedicated to my wife, Kusum
and to my parents, without whom this thesis would not have been possible.
TABLE OF CONTENTS
Page
ABSTRACT «... iii
DEDICATION...
1
... ivAPPENDIX... Vi LIST OF FIGURES... vii
ACKNOWLEDGEMENTS ... viii
INTRODUCTION... 1
BACKGROUND... 3
MATERIALS... 6
EQUIPMENT AND PROCEDURES... 7
Pure Component Measurements... 7
Mixture Measurements... 15
RESULTS... 18
Pure Component Adsorption Isotherms... 18
Binary Mixtures Adsorption Isotherms 24-SUMMARY... 27
NOTATION... 28
A P P E N D I X
Page I. Development of two- dimensional V. W. equation,.• 30
II. Development of two-dimensional R, K. equation.... 32
III. Pure component data... 37
IV. Calculation of pure component data ... 4l V. Binary mixture adsorption data... 4?
VI. Calculation of mixture measurements... 5^
VII. Data reduction for pure component... 60
VIII. Prediction of mixture isotherms... 63
LIST OP FIGURES
Figure Page
1. Flow diagram for pure component
measurements ... 9
2. Flow diagram for mixture measurements.. 14
3. Adsorption isotherms for pure gases... 20
4. Binary mixture isotherms... 25
A C K N O W L E D G E M E N T S
The author wishes to express his sincere appreciation for the assistance and guidance he received from Dr. A.J. Kidnay during the course of this investigation.
Thanks are also due to professors P.P. Dickson and W.R. Astle for their participation on the thesis committee.
The author is grateful to the National Science Foundation, to the office of Research Services of Colorado School of
Mines, and to the Colorado School of Mines Foundation, Inc., for financial support.
T-1357
I N T R O D U C T I O N
The potential for separating gases on an industrial scale by adsorptive procedures has drawn much attention to the study of gas-solid equilibria. Adsorption equilibrium data for gas mixtures are of importance in a variety of fields. For
instance, chemical engineers use mixed adsorption data to design multicomponent gas separation units and gas purifica tion units. Adsorbers can also be used to remove harmful contaminants from gas streams in pollution-control fields. Cryogenic engineers need this type of data in cryogenic refrigerators and liquifier designs.
Since the possible number of mixtures for study is enormous, it is necessary to have a reliable method for the prediction of equilibrium data.
In the past, the general method of calculation of mixed gas adsorption consisted of deriving a mixture adsorption isotherm by using the constants obtained from the pure
t
-1357
mixing rules to use for the constants of the mixture isotherm equation.
Recently, two advances have been made in the theory of
mixed-gas adsorption. The first is due to Myers and Prausnitz(1),. and the second is due to Hoory and Prausnitz(2). Myers and
Prausnitz approach the problem by a thermodynamic analysis that is parallel to the one used for vapor-liquid equilibria. They defined an ideal solution and developed an equation for calculating the activity coefficient for the adsorbed phase. Their approach is simplified by Kidnay and Myers(3)« Hoory and Prausnitz generalized the equations developed by Ross and Oliver(4) for pure gases to the adsorption of gas mixtures using a two-dimensional equation of state.
The usefulness of these theoretical advances in mixed- gas adsorption has been limited due to lack of experimental data with which to compare the predicted values for the mixed adsorption.
The objective of this research was to make a series of measurements on the adsorption of selected pure gases and their binary mixtures on homogeneous surfaces. A homogeneous surface was selected so that more meaningful comparisons
could be made between theory and experimental work. The adsorbent selected was sterling FT-D5, a highly graphtized carbon. The gases selected were freon-21 and ethyl chloride. The experimental data obtained provide a good comparison with the predicted mixed gas adsorption values.
T-1357
B A C K G R o ' u N D
Adsorption processes were reported as early as 1773 and were first used commercially to decolorize sugar in about 1800.
In spite of early work on the separation of mixture of gases, adsorption studies did not receive much attention until after 1930. Many researchers have measured thousands of pure
component isotherms on a wide variety of materials, but
relatively few of them have tried to measure mixture isotherms. The lack of mixture equilibrium data leads to difficulties
in the theoretical investigation of adsorption phenomena. It also hinders the development of techniques for predicting mixture isotherms from pure component isotherms.
The most comprehensive measurements of pure and mixture isotherms have been made by Szepesy and Illes(5»6), Lewis, et. al (7 ), Tompkins and Young (8), Basmadjian(9)# Basmadjian and Cook(lO), and Kidnay and Hiza(ll).
The study of pure component adsorption led researchers to develop various theories of adsorption as described by
t
-1357
Adamson(12)• Among those described, the one that has received much attention is the two-dimensional analogue of Van der Waals* equation and is the relation mainly considered during this
investigation. The basic equation is
(P + oC /A^) (A - (p ) = RT (1)
where o< and p are the analogues of the Van der Waals a and b respectively. The equation was used by Hill(13) and de Boer(l4) to develop the following equation for the adsorption isotherm
P e x p ( j 3 ^ - 0) (2)
de Boer(1 5 ) gives an interpretation of the two-dimensional Van der Waals constants in terms of the model of hard sphere with the attraction inversely proportional to the sixth power of the distance between two molecules. The relationships between cx and ^ with a and b are also developed in terms of critical properties of the gases.. Two assumptions are involved in the above development, first,the molecules are
spherical in shape and second, that the interaction between the molecules does not change even after adsorption. Qualitative agreement of this theory with some experimental work is
reported by Ross and coworkers(l6,17,l8).
An effort was made to develop the two-dimensional
analogue of the Redlich-Kwong equation during this investiga tion. The basic equation was
t
-1357
o< . . - (3)
V?A(A+p)) f
where cx and ^ are the analogues of the Redlich-Kwong*s
a and b respectively. Equation 3 combined with Gibb*s equation gives the following isotherm equation
F = %b I & r
- g^l. 5- ®) (l+e) R T lO j S
(4) The relationship between 2 and 3- dimensional Redlich- Kwong constants were also developed in terms of critical properties.
t
-1357
M A T E R I A L S
The gases selected for this investigation were freon-21 and ethyl chloride. The gases were obtained from the
Matheson Company. Both the gases were of research grade,
with purities of 99.95%* Preon-21 is colorless,non-flammable, non-toxic, and is mainly used as refrigerant and as a solvent, Ethyle chloride is colorless, highly flammable and toxic.
It is mainly used as refrigerant and solvent.,Both the gases have approximately the same thermal conductivity. The adsorb ent used was a highly graphitized carbon black, called Sterling FT-D5, manufactured by the Cabot Corporation. It has a uniform surface, with a B-E-T surface area of 11.5 sq. meter per gram as determined by the nitrogen adsorption technique.
T-1357
EQUIPMENT AND PROCEDURE
In the first phase of the investigation, pure component measurements were made. The flow-diagram for the apparatus
is shown in Figure 1. In the second phase of the investiga tion, the equipment was modified to allow mixture measurements to be made. The flow diagram for the mixture adsorption is shown in Figure 2. The pure gas data are tabulated in
appendix 3 and the mixture data are tabulated in appendix 5*
Pure Component Measurements
The pure component measurements were made in three steps:
Measurement of the dead volume of the system Reactivation of the adsorbent
Measurement of the pure gas adsorption
Measurement of the dead volume of the system: The step-wise procedure is as follows:
a. Keep valve 4 and 5 closed and start vacuum pump 1
The adsorption system includes everything right of valve I to the reference point on the left leg of the manometer.
T-1357
8
DESCRIPTION OP SYMBOLS USED IN FLOW SHEET
1• Pure gas cylinder
2. Helium gas cylinder
3$ 100 cc gas
burette-4. Constant temperature water bath
5. Adsorbent cell
6. Constant volume mercury manometer with 10 mm ID bore tubing
7• mercury trap
8. molecular sieve colümn for pressure drops 9• mercury trap
10. molecular sieve column for pressure drops Valves 1 and 6 are 1/8" OD Whitey
Valves 2 and 5 are 1/4" OD Whitey
Valves I and IV are two way glass stopper
Valves II and III are three way glass stopper Vacuum pump 1 and 2 are two vacuum pumps
T-1357
sO o| ro •H -P § I U W c3 0 B -P g § A B O O <D U a u o «P B d bû cd •H nd o rH 0 & •Ht
-1357
10
and 2.
b. Open valves 4 and 5 simultaneously so that mercury in reservoir under the manometer does not rise in bho
legs of manometer. Open valves 6 and I to pull a vacuum on the back line and the gas-burette, Keep valvoo II and IV closed.
c. After about two hours, close valve 6 and open valve 2. Allow helium to flow in the burette by opening valve I. d. Open valve IV and bring the gas-burette to atmospheric
pressure with helium. Adjust the mercury in both arms of the burette to the same level by opening valve II to vacuum line or the pressure line. This is the initial reading of the burette.
e. Raise mercury in the manometer to isolate the adsorption system by opening valve III to the pressure line.
Initially under good vacuum, the mercury in the manometer legs will be at the same level. Allow some helium to flow in the system by opening valve I to the system. Again /bring the mercury in both arms of the burette to the
same level. This will be the final burette reading,
f . Bring the mercury in the manometer to the reference point by adjusting valve III to the pressure line or the
vacuum line. The mercury level at the reference point keeps the system volume constant. Head the system pressure i.e. difference in mercury-level in both I
T-1357
11
of manometer.
g. Note the following things:
Atmospheric pressure and temperature, initial and final burette readings, system pressure and room temperature. See appendix 4 for the calculation of the dead volume of the system.
h. Add more helium to increase the system pressure differ entially to obtain some more readings.
Reactivation of Adsorbent: Repeat steps a and b of procedure I for about 12 hours while heating the adsorbent cell to about 400°F in a wax-bath and keeping valve 2 closed. The wax used for heating was petroleum wax with melting point range 112-124°? and flash point range 410-430°?. The wax was melted in a 250 ml beaker. The temperature was controlled by using a powerstat.
Measurement of the pure gas adsorption: The step-wise procedure is as follows:
a. Close valves I and 6. Allow one of the gases to flow in the gas-burette by opening valves I and 1. Open valve IV to allow the gas in the burette to come to atmospheric pressure. Bring the mercury to the same level in both arms of the burette. This is the initial burette
reading.
b. Remove the wax bath from around the adsorbent cell and replace it with a water bath adjusted to maintain a temperature of 50°C.
T-1357
12
C. Repeat steps e through g as in the case of dead volume measurements.
Repeat the steps above for another gas. See appendix 3 for tabulation of the pure gas measurements.
T-1357
DESCRIPTION OF SYMBOLS USED IN PLOW SHEET
1. Pure gas cylinder
2. Helium gas cylinder
3. 100 cc gas burette
4. Constant temperature water bath 5. Adsorbent cell
6. Constant volume mercury manometer with 10 mm ID bore tubing
7• mercury trap
8. Gas chromatograph
9• mercury trap
10. Molecular sieve column for pressure drop
Valves 1,6 and 8 through 10 are 1/8" OD Whitey Valves 2 through 5 and 7 are 1/4? OD Whitey Valves I and IV are two way glass stopper Valves II and III are three way glass stopper V.P. 1 and 2 are two Vacuum pump
T-1357
CO oo -p g § 5h U1 CÔ Q) E <D Sh -p X •H BI
•H 0 <p1
03 ♦H o 1-4 CM (D Jh •HT-1357
15
Procedure for Mixture Isotherm
Measurements for binary mixtures were made in 3 steps: Reactivation of the adsorbent
Introduction of the gas mixtures
Chromatographic analysis of the gas-phase at equilibrium Reactivation of adsorbent: First fill the system between valves 8,9 and 10 with helium. Close the valves 8^9 and 10 and reactivate the adsorbent as in step II of the procedure for pure component measurements. The reason for isolating part of the system is that the chromatograph sample valve is not entirely leak-proof. The rest of the system is leak- tight so at atmospheric system pressure we can make mixture measurements. After about 12 hours, remove the wax bath. Introduction of the gas mixtures : The step-wise procedure is as follows:
a. Close valve 6. Open valve 1 to let one of the pure gas into the burette. Close valve I and measure the volume of gas in the burette by opening valve IV and bringing the mercury to the same level in both arms of the
\
burette. Note the reading. The volume of gas is the burette reading plus the uncalibrated volume of burette. b. Change the pure gas cylinder and evacuate the line from the gas-cylinder to valve 6 by opening valve 6. After half an hour, close valve 6 and open valve 1. Slowly open valve I and let the gas into the burette. Close
t-1357
16valves I and 1, Bring the mercury to the same level and note the reading. The volume of gas introduced in this step is the difference between the two burette
readings. These two volume gives the composition of the binary mixtures. Raise and lower mercury in burette few time by means of valve II to mix the gases.
0 . Raise the mercury in manometer legs by opening valve III to the pressure line, and open valve I to the adsorption system to let the gas mixture in the burette flow in. At the same time put the constant temperature water bath under the adsorbent and adjust it to maintain the bath temperature at 50*^C. iNote the volume of mixture
i introduced..
d. The system pressure does not reach atmospheric pressure and so another mixture of about the same composition is prepared and introduced into the system to bring the system pressure to about atmospheric pressure.
e. Open valves 8 and 10. Keep valves 9 closed and switch on the circulation pump to circulate the mixture around the system. After about 12 to 15 hours switch-off the circulation pump and run the chromatographic analysis of the gas mixture in the sample loop. At this time read and note atmospheric pressure and temperature, the temperature of the water bath and the system pressure. Chromatographic analysis of the gas-phase at equilibrium: The
T-1357
17
step-wise procedure is as follows*
a. Set the helium carrier gas flow through the chromato graph to about 10 psig. Switch on the recorder and thermal conductivity circuit and allow few minutes to stabilize the recorder.
b. During the introduction of gas mixture, the sample valve remains in position 1 so that it is connected to the system. The sample valve is now switched to
position two so that the equilibrium gas mixture in the loop will be carried to the chromatograph. Measure and record the peak heights. Since the thermal conductivities of the two gases are about same, the peak heights were used to get the compositions.
. Repeat the above steps at various compositions at a fixed pressure and temperature for the system.
T-1357
R E S U L T S
The results are discussed in two parts: Pure component adsorption isotherms Binary adsorption isotherms
Pure Component Adsorption Isotherms
The isotherms of pure freon-21 and ethyl chloride are presented in Figure 3 and the results are tabulated in Table 1. They are reported as volume adsorbed at STP per gram of adsorbent as a function of equilibrium system pressure in mm of mercury. For comparison, theoretical isotherms predicted using the two-dimensional Van der Waals equation and the Redlich-Kwong equation are also
included in Figure 3# The pure component isotherm data have been treated with the two-dimensional Van der Waals equation^19 )
T-1357
19
W = In P - i n ^ - = In K ^ - g f ^ e ( 5 )
where W is an arbitrary constant. The value of W against 9 was then plotted. The intercept gave InK^ and the slope gave - 2 (X/RT^ , from which values of a( were obtained.
The value of cx and ^ are calculated from critical properties as follows:
where d is molecular diameter in
b is size constant in Van der Waals equation and is equal to 1/3 V^ Therefore Vc and 2 « = a (jB b
where a and b are constants in Van der Waals equation and
a = 3PcVZ b = 1/3V^ Therefore
o< = 9/2
The values of o( and obtained experimentally and
theoretically from critical properties are tabulated in Table 2,
t
-1357
Experimental Calculated by R-K Equation Calculated by V, W. Equation2.80
Preon-21 Ethyl Chloride Preon-21 2.40 s g 2.00 o w Tj cd o 1.60 — Ethyl chloride 1.20 •Preon-210.80
— — Ethyl chloride 0.40 0 100 200 300 500 600 Pressure, mm of HgPigure 3. Adsorption of Preon-21 and Ethyl Chloride on Sterling PT-D5 at 323OK
T-1357
21TABLE 1
Pure Component Isotherms
Freon-21, 323°K Ethyl Chloride, 323°K
Pressure Amount adsorbed
mm of Hg CO(STP)/gram Pressure mm of Hg Amount adsorbed GO(STP)/gram 35.3 0.21 58.3 0.29 139.3 0.88 146.2 0.75 262.6 1.35 260.9 1.30 377.9 1.70 358.5 1.55 466.0 2.06 477.9 1.85 573.1 2.40 590.5 2.33 TABLE 2 Gas c< X 10^ erg-cmr experimental cX X 10^ erg-cm^ calculated Preon-21 566.8 54.0 60.5 Ethyl Chloride 804.3 83.6 79.6
T-1357
22
The results obtained are within 10^.
Similarly an effort was made to treat the data for
* pure gases with the two deimensional Redlich-Kwong equation
W = InP - In = InK 0 0 1 - 0 1- 0 ^ r 0 ,1.5 [i f 4- l n ( l + 0 )
(
6)
1+0 + In ( 1 + 0 ) b RTThe values of W against the term
were plotted and the intercept gave InK^ and the slope
gave - from which values of of were obtained.
The values of o< and yg were calculated from critical proper ties are as follows.
- 3a/4d
where
a = 0.437R^tc ' c^ ' Vp
and = 3a/8d
The values of the constants obtained from calculation and from experimental data are tabulated in Table 3* The ethyl chloride results differ by about 3^ and the freon-21
results differ by about 20^.
T-1357
23
TABLE 3
Gas Kb «xlO^ 2 o<xlO^ 2
erg-cm erg-cm
experimental calculated
Freon-21 985 2050 2665
T-1357
24
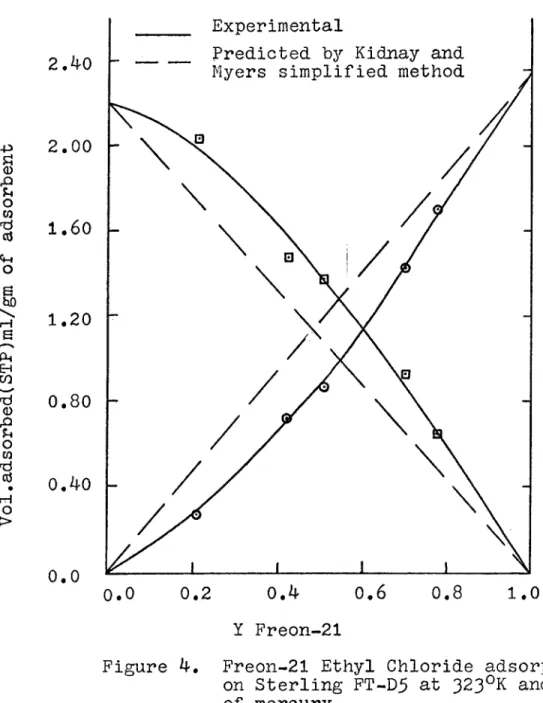
Binary Adsorption Isotherms
The isotherms for mixtures of freon-21 and ethyl
chloride are shown in Figure 4 and are tabulated in Table 4, There are number of techniques in the literature
for predicting mixture adsorption isotherms - using pure component isotherms, and most of these are summerized by Young and Crowell (20). The simplified technique of Kidnay and Myers (21) was used, in this thesis.
A comparison of calculated and experimental values
is shown in Figure 4, Details of the calculations are given in Appendix 6 .
The results shown in Figure 4 are satisfactory to those obtained using the simplified method of Kidnay and Myers,
Experimental isotherms do not agree to the predicted isotherms because of high concentration in the adsorbed phase that
T-1357
-p § € o CO rd cd Cm o §, t—I s Pk E4 CO 'd Q) ■g o (0 d cd rr| o > ExperimentalPredicted by Kidnay and Myers simplified method 2.40 2.00 1.60 1.20 0.80 0.40 0 0.6 0.4 0.8 0.2 1.0 0.0 I Preon-21
Figure 4. Freon-21 Ethyl Chloride adsorption on Sterling FT-D5 at 323°K and 5^1 mm of. mercury.
T-1357
26
a 9 E H CQ g <D +5 O CQ I—I g •H -p ft u o CQ d < (D u d 4-> X •H (D d •H g g •H r—I -p jc: •H O CQ O r H ft >5 6 .d O - P o w 0 CQtH Cd c\i ? g CQ 0 Cd Sh Ü ft 0 e S bûfn \ O -—' I—I ft s: EH o CO "—" I—I 8 ê “ d ft 0 « o w d <lj tH C\2 | g O 0 E ^ <; ft 0 ho îk ft d w ft W O 0 ^ g ft g § o ft ft 00 ft ft tH VA ON ON ON 00 ft ft VA ft ft 00 CO ON VA O Q o tH l>-VA ft it CA ON VA ON (A o it NO O tH ft tH O CA NO A- ft tH it 00 ft e- O-tH o o o tH CA D- NO CA O O- VA VA NO NO VA VA VA VA VA d o 0s
ft o MD 0 d 0 0 0 Sk ft 0 g 0 > <T-1357
S U M M A R Y
The pure component isotherms of freon-21 and ethyl chloride were measured at 323^% and in the pressure range of 30 to 600 mm of mercury. Binary adsorption isotherms of mixtures at various composition were measured at 323°K and at 56I mm of mercury.
The pure component measurement agrees very well with Van der Waals equation values but do not agree well with values predicted by Redlich-Kwong equation. The mixture values predicted by Kidnay and Myers' method agree well with experimental values and can be used for engineering calculations.
T-1357
N O T A T I O N bath T atm mano VMolecular area, cm /molecule Second virial coefficient Constant equal to 3/40^E Molecular diameter, A° Characteristic energy Two dimensional pressure Boltzmann*s constant Henry*s constant Avagadro number
Pressure, mm of mercury Gas constant
Temperature of water bath Atmospheric temperature
Temperature surrounding manometer Volume, ml
T-1357
29
Greek letters
2
^ interaction constant, erg-cm
size constant, ^
'V molecular potential function
0 fraction of surface covered
number of molecules adsorbed per sq cm
6o maximum number of molecules adsorbed per sq cm
Subscript c refers to critical properties Superscript o refers to temperature of O^C
t
-1357
A P P E N D I X I
Two dimensional Van der Waals * equation
The derivation given here, is from de Boer (The
I
dynamical character of Adsorption, Clarendon Press, Oxford, Ch. 7 and 8 , 1953).
The two dimensional equation is
(F + - ^ ) (A - B ) = RT (1 )
* ?
At critical point — ^ = 0 will give
Ac = 3
Tcg = 8c</27ft^ Pg = <=X/27^^
The Gibb's adsorption isotherm equation is
JL P_ dP dA (2)
A " RT dA dP
Solve equations 1 and 2 and substitute
e = =1/^ , A = 1/^ and t/o
t-1357
31to obtain
^ ÏZF" " R T ^ ® ) (3)
or W = InP - Y-4-ë- - l ^ î T r = l^^b " (^) Equation 4 is used in the data reduction technique to obtain o< and K^.
The relationship between the two-dimensional and the three dimensional constants is
b = |-nNd3
and a = IT Nd^
2
which gives
^ (5)
The assumption involved in the above simplification
is that the molecules are spherical in shape. Similarly, assuming the molecules have symmetrical electrical field
„ _ 27rCN^ 3d3 and o< = CN^ 4d3 which gives - - Ü
2
where a = IF* Vc cT-1357
A P P E N D I X II
Development of two-dimensional Redlich-Kwong equation
An effort was made to develop a two-dimensional Redlich-Kwong equation of state in a manner parallel to that used by de Boer for the two-dimensional Van der Waals equation of state. The basic two-dimensional Redlich-Kwong equation is
(P
+
— —
) { A - g )
= RT
(1)
7t A(A+
P )
'
2
At the critical point = 0
dA
dA^
f . „ . . (2)
(A-p)
Jf A'^
fr (A+^)^
^ = 0 = + .2 (3)
dA'^
(A -f)3
JT A-)
,ff(A+/5)3T-1357
33
Simultaneous solution of equations 2 and 3 will give a cubic, equation
a3 _ 3^A^ - 3yS^A - = 0 ik)
Solution of the cubic equation will result in one positive and two conjugate imaginary roots. The positive root gives
“ 3*85 ^ ?c2 = # (
Pc = 1/34 (Ro^/ ;g3)l/3
The Gibbs adsorption isotherm equation is
1 _ ^ dA
A R T dA • dP
I
Simultaneous solution of equations 1 and 5 results in the equation
dP _ _ AdA ^ cX ^ ^ _ AdA j
^ A (A )2
(6)
Integration of equation 6 results inP = % jg- exp( fi/A-fi) . exp(-of/RT^*^(A+yff ) )
— cx
UTsr
X (A/A+fi ) RT'-^yS (7)
t
-1357
34I
.and K, = K,6o into equation 7 gives
p = exp(e/i-e).exp(-«e/RT^‘3^(i+e))
- (x/RTl-5g
X (1+e) (8)
Equation 8 is the adsorption isotherm equation obtained from two-dimensional Redlich-Kwong equation and the 6 ibb*s adsorption isotherm equation. Equation 8 can also be
written in the form
W = InP - 1 ® 0 - In "
— ^ ( r f - s + in(i+e))
I RT i T w
(9)
Equation 9 is useful for data reduction to obtain cx and
S '
A relationship was developed between the two and three dimensional constants.
The assumption of spherical molecules leads to b = 2 7rNd3/3 and
p
= F N d^ / 2 Therefore p = 3b/4d (10) where b = 0.086?RT^/P^t
-1357
35
leads to
Of = CN^/4d3
and a = 2 CN^/3d3
which therefore gives
cx = 3a/8d (11)
where
a = 0.4367rS ^ ' 3 / Pc
Equations 10 and 11 are the same as equations 5 and 6
in appendix I. Thus the Redlich-Kwong constants have the same physical meaning as the Van der Waals constants.
The reason is the approximation involved in the development of the relationships. The virial form of the Van der
Waals equation gives the 2nd virial coefficient as B = b - a/RT
or a = RT(b-B)
or a ft -BRT (12)
Similarly the Redlich-Kwong equation in virial form gives a 2nd virial coefficient as B = b - a/RT^*3 or a = RT^*3(b-B) s-b r t^'3 (13) and B = ^
J
(X - exp(-^/RT))2nrdr _ N y''J'27rrdr/RT (14)t-1357
36Substitution of equation 14 into equation 12 results in
a = STTN^C
The limit of integration is from d to 00 and the integration of equation gives
a = ^ (15)
3d-^
Also, substituting equation 14 into equation 13 results in
a = N^Jf Jck-nr^dr/r^
Integrating the above equation between the limits of d
and gives
^ ^ ajrcN^ fî/3d3 (16 )
Similarly, the two-dimensional Van der Waals constant is given as
.6
cv = ^ j 02 vr rdr/r* which upon integration^ = 7lCN^/4d^ (17)
and the two-dimensional Redlich-Kwong constant is given as
o< = jC2ffrdr/r'
2
which upon integration gives
= n c N ^ j r A d ^ (18)
Equation 15 and 17 gives equation 6 as in appendix I
t
-1357
A P P E N D I X III
TABLE 1
Total dead volume measurements
p atm mm of Hg T atm deg C ^initial ml ^final ml P system mm of Hg T manometer deg C 6l8 • 6 23.2 90.50 78.30 120.0 23.2 6l8 *6 23.2 78.30 62.50 263.0 23.2 6l8 • 6 23.2 62.50 49.90 377.5 23.2 618.6 23.2 49.90 41.20 457,0 23.2 6l8.6 23.2 41.20 31.10 548.5 23.2 6l8 • 6 23.2 31.10 23.50 611.5 23.2
37
T-1357
38
TABLE 2
Dead Volume measurements of the system that remains at ambient condition p atm mm of Hg T atm deg G ^initial ml ^final ml P system mm of Hg T manometer deg G 6l8 • 6 25.0 89.70 87.55 31.5 25.0 618.6 25.0 87.55 85.55 62.5 25.0 618.6 25.0 85.55 82.65 105.0 25.0 618.6 25.0 82.65 76.75 192.0 25.0 618.6 25.0 76.75 70.50 282.5 25.0
T-1357
39
TABLE 3
Pure Ethyl Chloride measurements
p atm mm of Hg T atm deg C ^initial ml V P final system ml mm of Hg ^bath deg C T manometer deg G 621.7 22.2 93.20 84.45 58.5 50.1 22.2 621.7 22.2 84.45 70.90 147.0 50.0 22.2 621.7 22.2 71.20 54.00 262.0 50.0 22.2 621.7 22.2 54.20 41.75 360.0 50.1 22.2 621,7 22.2 41.55 26.70 480.0 50.1 22.2 621.7 22.2 26.60 10.45 593.0 50.0 22.2
t
-1357
40
TABLE 4
Pure Preon-21 measurements
p atm mm of T atm Hg deg C ^initial ml Vfinal ml P system mm of Hg T bath deg G T manometer deg G 620.1 25.0 90.70 84.85 35.5 50.0 28.5 620.1 25.0 84.85 67.00 148.0 50.0 28.5 620.1 25.0 67.00 50.45 264.0 50.0 29.0 620.1 25.0 50.45 35.20 380.0 50.0 29.8 618.0 25.0 35.05 22.30 468 • 0 50.0 29.8 618.0 25.0 22.20 7.70 576.0 50.0 27.5
T-1357
A P P E N D I X IV
TABLE 1
Pure Component Calculations
Dead Volume of whole system Dead Volume of system at
ambient condition P
system Vol.,ml psystem Vol., ml
261.9 65.88 31.4 42.18 375.9 66.58 62.2 41.13 455.1 66.75 104.5 41.67 546.2 67.00 191.7 41.57 608.2 67.80 281.3 42.05
41
t
-1357
42
TABLE 2
Pure Ethyl Chloride Pure Freon-21
P
system Vol. ad(STP)/ gra Psystem Vol. ad(STP)/ gi
58.3 0.29 35.3 0.21 146.2 0.75 139.3 0.88 260.9 1.30 262.6 1.35 358.5 1.55 377.9 1.70 477.9 1.85 466.0 2.06 590.5 2.33 573.1 2.40
T-1357
43
Sample calculation for total de/id volume of the system Patm ~ 618.6 mm of Hg at 23,2 read from barometer.
The above pressure reading 1g corrected to O^G by taking manometeric corrections from the Handbook of chemistry by Lange,10th Edition,p. 1696-7.
For the above pressure reading ai, 23.2^0, the correction is 2.3 mm of Hg
Therefore P^^^ at 0°C = 616.3 rtirn of Hg
The system pressure is read from the manometer and is corrected for the temperature effect.
= 120.0 mm of Hg at 23.2 °C
■p a,t T
system manometer
T
ay
Since area of leg of manometer in same then the differential height read at T°C should be corrected to 0^0 as follows
at ,T°C X A X h., at T O = '_ P Hg at 0°G X A xh atO G Therefore h at 0 C = = Pgy,.tem = X at T°C *^llg at 0°C P ^ X f system ^'t fo
T-1357
44
Therefore
Volume of gas(STP) in the system
that remains in air =
= 1.70 ml and volume of gas (STP) in the
system that remains in bath =
= 0.94 Therefore,
Volume of Freon-21 adsorbed(STP) = Volume of gas introduced(STP) - Volume of gas present
- 4.31 - (1.79 + 0.94) = 1.62 ml
Therefore
Volume of Freon-21 adsorbed(STP) _ ________ 1.62 ml________
gm. of adsorbent 7.11 gm of adsorbent
= 0.23 ml/gm
t
-1357
where fL = density of mercury at T^C
45
T
From Lange*s handbook of chemistry (p.1199)
p = density of mercury at 0°C
at 23.2°C Py = 13.538 gm/ml
and at 0°C = 13.596 gm/ml
Therefore P^y^tem at 0°G = ^ 120.0 mm of Hg
= 119.5 mm of Hg
Now the volume of Helium introduced into the system is equal to 90.50 - 78.30 = 12.20 ml
The dead volume of the system is therefore
= dead volume = Ventre ^ ^ P°
system
__ 12.20 ml X 616.3 mm of Hg
~ 119.5 mm of Hg
= 62.95 ml
The same procedure is followed in the case of the dead volume of the system at ambient condition.
\
Sample Calculation for pure gas (Freon-21) Barometric pressure corrected to 0^0
Patm “ 620.1 mm of Hg at 25°C
Barometric correction is 2.5 mm of Hg Therefore P°^^ = 620.1 - 2.5
t
-1357
46
System pressure correction
'^system = 35-5 mm of Hg. T ^ ^ ^ = 28.5°C ^Hg V n o = Pt = 13.525
pjjg at 0°C = pQ = 13.596
^system 9 ^ - Pgy . - Pgygtem ^ (q
= 35.5 X 13.525
13.596 = 35.3 mm of Hg
Volume of gas introduced at atmospheric condition is corrected to 760 mm of Hg and 0°C (STP) using ideal gas equation.
Therefore
P
Volume introduced (STP)i = ^73.15 % _§tm— ^ V.
' ^atm 760.0
Therefore
Volume introduced (STP) = ^73.15 % 617.6 ^ 5.85 301.65 X 760.0
= 4.31 ml
A part of adsorption system remains in air and part of the system remains in the constant temperature water bath.
dead volume of system = dead volume of system + dead volume of
in the air • system in water
bath
65.55 ml = 41.55 ml + 24.00 ml
So for the system pressure of 35*3 mm of Hg 41.55 ml pure gas is at P°yg and T^^^^ and 24.00 ml pure gas is at P°yg
t
-1357
A P P E N D I X V
Binary Mixture Adsorption Data
Run 1 ?atm = 610.1 mm of Hg = 25.5°C T^ano = 23.3°C Mixture I Gas vol.,ml % Freon-21 29*55 + 6*75 = 36*30 67.0 Ethyl Chloride 47.40 - 29*55= 17*85 33*0 Total 54.15 100.0
Amount introduced in the system = 46.50 ml
Mixture II
Gas vol.,ml %
Freon-21 48.40 - 11.10= 37*30 6 7 .4
Ethyl Chloride 11.10 + 6.75= 17*85 32.4
Total 55*15 100.0
6.75 is volume of uncalibrated part of burette.
T-1357
48
Amount introduced in the system = 41.20 ml Chromatographic Analysis:
Helium flow at 10 psig Patm “ 610.0 mm of Hg
P g y g = 11101 Û f H g
Freon-21 peak height =
Ethyle chloride peak height=
Attenuation of 2 ^atm = 25 .5°C Tn,ano= 25.5°C V t h = 30 .1-c 33/64 in 14/64 in
t
-1357
49
Run 2 ^atm = 6 2 0 . 0 mm of Hg. T^^^ = 25°C T^^^^ = 25°C Mixture I Gas vol.,ml % Freon-21 17.40+6.75 = 24.15 46.7 Ethyl chloride 44.95-17.40= 27.55 53.3 Total 51.70 100.0Amount introduced in the system = 47.85 ml Mixture II
Gas vol,,ml %
Freon-21 46,00 - 21.00 = 25.00 4?.l
Ethyl chloride 21.00 + 6.75 f 27.75 52.9
Total ■ 52.75 100.0
Amount introduced in the system = 35.60 ml Chromatographic Analysis :
Helium flow at 10 psig Tg^tm ~ 25.0°C
Patm = 613.7 mm of Hg ?mano= 23.0°C
Psys = 613.0 mm of Hg ?bath= 60.1°C
Freon-21 peak height = 17/32 in
T-1357
50
Run 3 Patm = 613.7 mm of Hg Mixture I Gas Freon-21 Ethyl chloride Total ?atm = 2 5 .5"C volume, ml 4 5 .80-36.20 = 9.60 6 .75+ 36.20 = 42.95 52.55 Amount introduced in the system = 52.55 ml Mixture II Gas Freon-21 Ethyl chloride Total volume,ml 6.75+3.80 = 10.55 5 1 .90-3.80 = 48.10 58.65 Amount introduced in the system = 32.15 mlChromatographic Analysis: Helium flow at 10 psig Pgtm ~ 611'0 mm of Hg Tmano=24.5°C
%
18.3 81.7 100.0 ^atm = 2 5 .5-C W o = 23'4°C Pgyg = 611.5 mm of Hg ^bath= 50.0-C Freon - 21 Ethyl chloride peak height = 11/64 in peak height = 21/32 in%
18.0 82.0 100.0t
-1357
51
Run 4 Patm = 615.0 mm of Hg T^^^ = 25°C T^^^^ = 22.3°C Mixture I Gas vol, ml % Freon - 21 50.20 - 27.20 = 22.70 39.9 Ethyl chloride 6.75 + 27.50 = 34.25 60.1 Total 56.95 100.0Amount introduced in the system = 56.95 ml Mixture II
Gas vol,ml %
Freon-21 6.75 + 12.00 = 18.75 38.9
Ethyl chloride 4l.?0 - 12.00 = 29.70 61.3
Total = 48.45 100.0
Amount introduced in the system = 26.80 ml Chromatographic Analysis :
Helium flow a t 10 psig T^^m ~ 24^C
P a t m = 612.4 m m of Hg ^ 0=
Psys = 6 1 8 . 0 mm of Hg ?bath= 30.0°C
Freon-21 peak height =13/64 in
t
-1357
52
Run 5 Patm = 610.0 mm of Hg , T^^^ = 25°C T^ano = 23°C Mixture I Gas vol,ml % Freon-21 40.25- 4.60 = 35.65 75.9 Ethyl chloride 4.60 + 6.75 = 11,35 24.1 Total 47.00 100.0Amount introduced in the system = 47.00 ml
Mixture II
Gas vol,ml %
Freon-21 40.70 - 4.60 = 36.10 76.1
Ethyl chloride 6.75 + 4.60 = 11.35 23.9
Total = 47.45 100.0
Amount introduced in the system = 39.15 ml Chromatographic Analysis:
Helium flow at 10 psig Patm ~ 608.6 mm of Hg Pgyg = 615.5 mm of Hg
Freon-21 peak height = 31/64 in
Ethyl chloride peak height = 9/64 in
^atm 24.8°C
T = 22.5°C
mano
t
-1357
A P P E N D I X VI
Binary Mixture Sample Calculation for Run No.l
The following steps are involved in the calculation 1) Calculate the exact composition of feed and the
volume of each gas introduced at STP
2) Calculate the equilibrium composition of the gaseous mixture in the system
3) Calculate the volume of each gas adsorbed at STP
Step 1
In the calculation of the feed composition, the volume of the uncalibrated part of gas-burette is needed and was
determined as follows.
T-1357
54
p atm mm of Hg T atm deg C ^initial ml Vfinal ml p system mm of Hg dead vol. of system, ml 620.0 24.0 16.10 0.0 215.0 65.55 620.0 24.0 12.10 0.0 172.5 65.55 620.0 24.0 8.20 0.0 142.0 65.55 Patm X vol. = ^sys ^ Vol. of system vol = 215.0 620. 0X
22.73 ml
Vol.- of uncalibrated part = 22.73 - 16.10
= 6.63 ml The average of above three readings = 6.75 ml For mixture 1
Freon-21 volume = 36*30 ml
Ethyl chloride volume = 17.85 ml Total gas volume = 54.15 ml Therefore
% Freon-21 in the mixture = 3.6..3.0. j--P.P.
= 67.0 #
Similarly ethyl chloride % _ 17.85% 100
54.15
T-1357
25
Amount introduced = 46.50 ml
Similarly for mixture II
% Freon-21 = 67*6
and % Ethyl chloride = 32.4
Amount introduced = 41.20 ml
Therefore
Total mixture introduced at 610.1 mm of Hg and
23.5°C = 46.50 ml + 41.20 ml
= 87.70 ml
and average % of freon-21 i
in the system = 6Z».6.
= 6 7 . 3
%
and average % of ethyl
chloride in the system = 3 2 ..7- % Barometer reading correction to 0°C
Patm = 610.1 mm of Hg T&tm = 23.5°C Correction = 2.4 mm of Hg
Therefore = 610.1 - 2.4
= 607.7 mm of Hg So total vol. introduced at STP
= 87 .70 X 2 7 3 .15. X 602.7 296.65 X 760.0 = 64.li ml
t-1357
56Therefore
volume of Preon-21 introduced (fjTP) = 64.11 x0.6?3 = 43.20 ml and volume of ethyl chloride introduced
(STP) = 20.91 ml
Step 2
Calculation of equilibrium composition of gases
Since there was very little sepnration of peaks and it was difficult to obtain calibration curves for the pure gases due to leak in sample valve on the chromatograph, a peak ratio was the means used to get the composition. This approximation is valid since there is not much difference in thermal conductivity of both the gases.
Freon peak height = 33/64 in
Ethyl chloride height = l/(/64 in
Therefore
% of Freon-21 = % 100
(33*14/64) = 7 0 ,% # and percent of ethyl chloride = 29,0 %
Step 3
t
-1357
57
system and since it is not leakproof, the sample loop was first filled with helium at atmospheric pressure, and so that much helium is mixed with the feed. The volume of that loop is 5.05 ml determined as folios:
1/8" OD Cu-tubing, 37.64 in long with volume = 2.03 ml 1/4" OD Cu-tubing, 6 .50 in long with volume = 3.02 ml Therefore
Total volume = 5.05 ml
. Also due to a mixing problem in the system, part of the system will be at the feed composition. This volume is
left leg of manometer, 38*25 iu long with 0.3 cm ID
volume = 6.83 ml
Burette’s top valve to tee near circulation pump
3.50 in Cu-tubing, with 0.4 cm ID,,volv = 1.12 ml
I.75 in Cu-tubing, with 1.00 cm ID,vol. = 3*40 ml 9.00 in Cu-tubing, with O.O65 in ID,vol. = 0.49 ml Therefore
Total volume at feed composition =11.93 ml
Thus we have for the system
II.93 ml at feed composition, and T ^ ^ ^
34.67 ml at equilibrium composition, Pgyg and T^^^^ and 24.00 ml at equilibrium composition, Pgyg and T^^^^
t
-1357
58
The effective system pressure will be the system pressure less the partial pressure of the helium which is mixed with the gases.
Therefore
Pgyg(effective) = - P^y vol^ helium
= 626.5 mm of Hg - 626.5 mm of Hg x— = 626.5 - 626.5 X 0.086 = 572.6 mm of Hg " (effective) = 572.6 mm of Hg x Hg ^ mano ' Hg at 0 C = 5 7 2 . 6 mm oj’ Hg X 13 )5 9 5 5 = 569.7 mm of Hg
The volume of gas mixture present at STP will be 11.93 X 569.7 X 273.15
760.0 X 296.55
= 8.23 ml at feed composition 34.67 X 569.7 X 273.15760.0 X 296.55
= 23.92 ml at equilibrium composition 24.00 X 569.7 x 273.15 760.0 X 323.15 = 15.21 ml at equilibrium compositiont
-1357
59
Volume of Mixture Preon-21 Ethyl chloride
present, ml (STP) % Volume present % Volume present
8.23 67.3 5.54 32,7 2.69
23.92 70.2 16.79 29.8 7.13
15.21 70.2 10.68 29.8 4.53
Total 33.01 14.35
Gas Volume into (STP) Vol. present(STP)
ml ml Volume adsorbed per gram Preon-21 43.14 : 33.01 1.43 Ethyl ^ Chloride 20.91 14.35 0.93
t
-1357
A P P E N D I X VII
Data reduction for pure component isotherms by the two-dimensional Van der W a a l ’s equation of states
The two-dimensional Van der Waals is
""b ï V «XP ( ï z V - r î f " ) It can be written as W = InP - In K = In - I*® 1-9 1- e b R T p where p = 3b/4d = Vc/4d Vc = critical volume d = molecular diameter
and n^ = moles adsorbed at full monolayer coverage
n ^ p = total surface area per unit mass of adsorbent
2
= 11.5 meter
t-1357
61for both the gases was then used to calculate 0 where
9 Amount adsorbed per unit mass
Amount adsorbed at full monolayer coverage per unit mass
Next calculate W and plot it against 0. The intercept is InK^ and slope is - 2 W / R T , from which g( is
calculated. Gas d,A° n^xl03 gm mole per gm -o^xlO^ exptl.g erg-cm -o<xlo6 calculated erg-cnr Freon-21 6.2 13.20 0.113 566.8 54.01 60.5 Ethyl Chloride 4.9 16.86 0.145 804.3 83.55 79.6
Similarly two-dimensional Redlich-Kwong equation was used for data reduction. The equation is
w = inp - i n ^ V e - ï - T ë =
W i + e ) )
The intercept is InK^ and the slope is -o^/RT^*^p from which o< is calculated.
oc is also related to the a and b of the three-dimensional Redlich-Kwong equation by
c/ = a p / 2b where
t
-135762
b = 0 .086? RTg/Pg
Gas %b -oc xlO erg cm6 2
exptl. -<xxlO^ erg cm' calculated Preon-21 13.20 985 2050 2665 Ethyl chloride 16.86 1450 3720 3506
t
-1357
A P P E N D I X VIII
Prediction of mixture isotherm
The procedure for calculating mixture adsorption from the pure component isotherms is as follows:
1. Select the value of P°y(on pure gas isotherms), 561 mm of Hg.
2. Select a value n^ lying between %i(Pgy) and ngtP^y), where subscript 1 refers to Preon-21 and 2 refers to ethyl chloride
3 . From the pure gas isotherms obtain PgyiCn^) and
4. calculate x^ using
pO — pO y + pO y
^sy ^syl'*l ^syZ'Xg
Xg =
T-1357
64
5. Calculate using pO y y. = ^syl-Xj ^sy yg = 1 - ?!6. Calculate volume (STP) adsorbed/gm of adsorbent using
n^ = x^.nt
n^ = (1 - x^).n^
+ ng
y^ and y^ = Gas-phase equilibrium composition for component 1 and 2
and Xg = adsorbed - phase composition for component 1 and'
t
-1357
65
P°y = 5 6 1 mm of Hg = 2.35 ml a2(?:y) = 2.20 ml ^ s y d ^ t > ^sy2^” t^ %1 %2 ?1 72 "l *2 2.20 510 562 0.00 1.00 0.00 1.00 0.00 2.20 2.24 524 577 0.28 0.72 0.26 0.74 0.63 1.61 2.28 538 592 0.56 0.44 0.54 0.46 1.28 1.00 2.30 545 601 0.70 0.30 0.68 0.32 1.61 0.69 2.32 551 60S 0.81 0.19 0.79 0.21 1.88 0.44 2.34 559 618 0.95 0.05 0.94 0.06 2.22 0.12 2.35 562 620 1.00 0.00 1.00 0.00 2.35 0.00t
-1357
R E F E R E N C E S
1. Myers,A.L., and Prausnitz,J.M,, Thermodynamics
of mixed gas adsorption: Am. Inst. Chem. Eng. Jour., V .11,no.l, p. 121-127/1965).
2. Hoory,S.E., and Prausnitz,J.M., Monolayer adsorption
of gas mixtures on homogeneous and heterogeneous
solids: Chem. Eng. Prog. Symp., v.6 3 ,no.74, p.3-9,(1967).
3 . Kidnay,A.J., and Myers,A.L., A simplified method
for the prediction of multicomponent adsorption equilibria from single gas isotherms: Am. Inst. Chem. Eng. Jour., v.l2, no.5, p. 981-986,(1966).
4. Ross,S., and Oliver,J.P., On physical adsorption:
New York, Interscience Publishers, J.Wiley and 3ons, Inc. Ch. 1, (1964).
5 . Szepesy,L., and Illes, V., Adsorption of gases and
gas mixtures. I: Acta.Chim.Hung., v.3 5 , p.37-51,(1963).
6. , Adsorption of gases and gas mixtures
III: Acta.Chim.Hung, v.35, p.245-253$ (1963).
7 . Lewis,W.K., Gilliland,E.R., Chertow,B., and Codogan,
W.P., Adsorption equilibria, hydrocarbon gas mixtures: Ind. and Eng. Chem., v.42, no.7, p.1319-1326/1950). 8. Tompkins,F.C., and Young,D.M., The adsorption of gas
mixtures: Trans. Far. Soc., v.47, p.88-9 6 ,(1951)*