This is the published version of a paper published in The Lancet.
Citation for the original published paper (version of record):
Kyu, H H., Abate, D., Abate, K H., Abay, S., Abbafati, C. et al. (2018)
Global, regional, and national disability-adjusted life-years (DALYs) for 359 diseases
and injuries and healthy life expectancy (HALE) for 195 countries and territories,
1990-2017: a systematic analysis for the Global Burden of Disease Study 2017
The Lancet, 392(10159): 1859-1922
https://doi.org/10.1016/S0140-6736(18)32335-3
Access to the published version may require subscription.
N.B. When citing this work, cite the original published paper.
Permanent link to this version:
Global, regional, and national disability-adjusted life-years
(DALYs) for 359 diseases and injuries and healthy life
expectancy (HALE) for 195 countries and territories,
1990–2017: a systematic analysis for the Global Burden of
Disease Study 2017
GBD 2017 DALYs and HALE Collaborators*
Summary
Background
How long one lives, how many years of life are spent in good and poor health, and how the population’s
state of health and leading causes of disability change over time all have implications for policy, planning, and provision
of services. We comparatively assessed the patterns and trends of healthy life expectancy (HALE), which quantifies the
number of years of life expected to be lived in good health, and the complementary measure of disability-adjusted
life-years (DALYs), a composite measure of disease burden capturing both premature mortality and prevalence and severity
of ill health, for 359 diseases and injuries
for 195 countries and territories over the past 28 years.
Methods
We used data for age-specific mortality rates, years of life lost (YLLs) due to premature mortality, and years
lived with disability (YLDs) from the Global Burden of Diseases, Injuries, and Risk Factors Study (GBD) 2017 to
calculate HALE and DALYs from 1990 to 2017. We calculated HALE using age-specific mortality rates and YLDs per
capita for each location, age, sex, and year. We calculated DALYs for 359 causes as the sum of YLLs and YLDs. We
assessed how observed HALE and DALYs differed by country and sex from expected trends based on
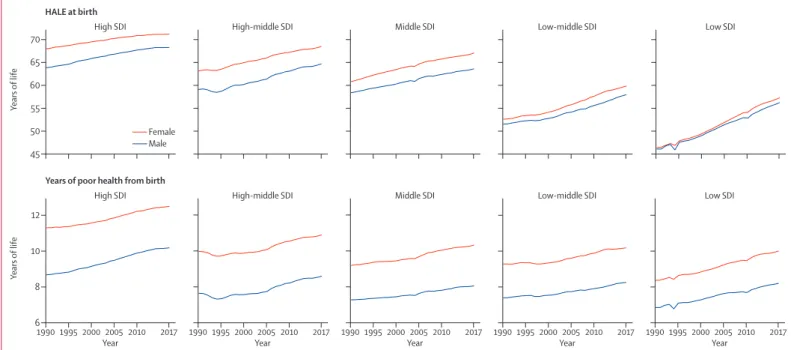
Socio-demographic Index (SDI). We also analysed HALE by decomposing years of life gained into years spent in good
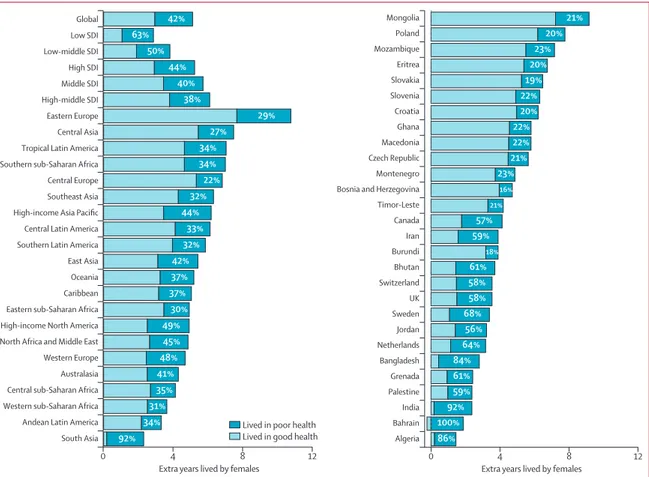
health and in poor health, between 1990 and 2017, and extra years lived by females compared with males.
Findings
Globally, from 1990 to 2017, life expectancy at birth increased by 7·4 years (95% uncertainty interval 7·1–7·8),
from 65·6 years (65·3–65·8) in 1990 to 73·0 years (72·7–73·3) in 2017. The increase in years of life varied from 5·1 years
(5·0–5·3) in high SDI countries to 12·0 years (11·3–12·8) in low SDI countries. Of the additional years of life expected
at birth, 26·3% (20·1–33·1) were expected to be spent in poor health in high SDI countries compared with 11·7%
(8·8–15·1) in low-middle SDI countries. HALE at birth increased by 6·3 years (5·9–6·7), from 57·0 years (54·6–59·1)
in 1990 to 63·3 years (60·5–65·7) in 2017. The increase varied from 3·8 years (3·4–4·1) in high SDI countries to
10·5 years (9·8–11·2) in low SDI countries. Even larger variations in HALE than these
were observed between countries,
ranging from 1·0 year (0·4–1·7) in Saint Vincent and the Grenadines (62·4 years [59·9–64·7] in 1990 to 63·5 years
[60·9–65·8] in 2017) to 23·7 years (21·9–25·6) in Eritrea (30·7 years [28·9–32·2] in 1990 to 54·4 years [51·5–57·1]
in 2017). In most countries, the increase in HALE was smaller than the increase in overall life expectancy, indicating
more years lived in poor health. In 180 of 195 countries and territories, females were expected to live longer than males
in 2017, with extra years lived varying from 1·4 years (0·6–2·3) in Algeria to 11·9 years (10·9–12·9) in Ukraine. Of the
extra years gained, the proportion spent in poor health varied largely across countries, with less than 20% of additional
years spent in poor health in Bosnia and Herzegovina, Burundi, and Slovakia, whereas in Bahrain all the extra years were
spent in poor health. In 2017, the highest estimate of HALE at birth was in Singapore for both females (75·8 years
[72·4–78·7]) and males (72·6 years [69·8–75·0]) and the lowest estimates were in Central African Republic (47·0 years
[43·7–50·2] for females and 42·8 years [40·1–45·6] for males). Globally, in 2017, the five leading causes of DALYs were
neonatal disorders, ischaemic heart disease, stroke, lower respiratory infections, and chronic obstructive pulmonary
disease. Between 1990 and 2017, age-standardised DALY rates decreased by 41·3% (38·8–43·5) for communicable
diseases and by 49·8% (47·9–51·6) for neonatal disorders
.
For non-communicable diseases, global DALYs increased by
40·1% (36·8–43·0), although age-standardised DALY rates decreased by 18·1% (16·0–20·2).
Interpretation
With increasing life expectancy in most countries, the question of whether the additional years of life
gained are spent in good health or poor health has been increasingly relevant because of the potential policy
implications, such as health-care provisions and extending retirement ages. In some locations, a large proportion of
those additional years are spent in poor health. Large inequalities in HALE and disease burden exist across countries
in different SDI quintiles and between sexes. The burden of disabling conditions has serious implications for health
system planning and health-related expenditures. Despite the progress made in reducing the burden of communicable
diseases and neonatal disorders in low SDI countries, the speed of this progress could be increased by scaling up
Lancet 2018; 392: 1859–922
*Collaborators listed at the end of the paper
Correspondence to: Prof Christopher J L Murray, Institute for Health Metrics and Evaluation, Seattle, WA 98121, USA
Introduction
Understanding global trends in the health status of
populations and changes in the leading causes of
disease burden over time is crucial to tracking progress
towards the Sustainable Development Goal to ensure
healthy lives and promote wellbeing for all at all ages.
1Robust assessment of these trends requires objective
and comparable measures of population health that can
help countries identify priorities and address challenges
to achieving this goal. The Global Burden of Diseases,
Injuries, and Risk Factors Study (GBD) 2017, the third
annual update in the series, uses all available up-to-date
epidemiological data and improved standardised
methods to provide a com parative assessment of health
loss across 359 diseases and injuries and 73 age and sex
groups for 195 countries and territories. The availability
of GBD 2017 data for years of life lost (YLLs) because of
premature mortality and years lived with disability
(YLDs) provides an opportunity to assess trends in
population health over the past 28 years by analysing
two complementary summary measures: healthy life
expectancy (HALE), which quantifies the number of
proven interventions. The global trends among non-communicable diseases indicate that more effort is needed to
maximise HALE, such as risk prevention and attention to upstream determinants of health.
Funding
Bill & Melinda Gates Foundation.
Copyright
© 2018 The Author(s). Published by Elsevier Ltd. This is an Open Access article under the CC BY 4.0 license.
Research in context
Evidence before this study
The Global Burden of Diseases, Injuries, and Risk Factors Study
2016 (GBD 2016) estimated 333 causes of disability-adjusted
life-years (DALYs) for 195 countries and territories from
1990 to 2016. GBD 2016 also provided estimates for life
expectancy and healthy life expectancy (HALE) at birth and at
age 65 years, by sex, for each location over time. GBD 2016
included analysis of the epidemiological transition as a function
of the Socio-demographic Index. The WHO Global Health
Estimates has also published estimates of HALE and DALYs,
although these estimates largely relied on GBD 2016 results.
Added value of this study
In GBD 2017, we expanded the scope of the study compared
with previous iterations to include subnational estimates for
five more countries (Ethiopia, Iran, New Zealand, Norway,
and Russia) and 19 additional causes. The new causes estimated
are invasive non-typhoidal salmonella disease; liver cancer due
to non-alcoholic steatohepatitis; cirrhosis due to non-alcoholic
steatohepatitis; myelodysplastic, myeloproliferative, and other
haemopoietic neoplasms; benign and in-situ intestinal
neoplasms; benign and in-situ cervical and uterine neoplasms;
other benign and in-situ neoplasms; subarachnoid
haemorrhage; non-rheumatic valvular heart disease;
non-rheumatic calcific aortic valve disease; non-rheumatic
degenerative mitral valve disease; other non-rheumatic valve
diseases; gastro-oesophageal reflux disease; type 1 diabetes;
type 2 diabetes; chronic kidney disease due to type 1 diabetes;
chronic kidney disease due to type 2 diabetes; poisoning by
carbon monoxide; and poisoning by other means. In addition to
broadening our estimation by cause, location, and time,
a substantial amount of new data were added for GBD 2017.
For cause-specific non-fatal estimations, we added new data
from epidemiological surveillance, disease registries, scientific
literature sources, and survey sources. Similarly, for
cause-specific fatal estimation, we added new data from verbal
autopsy studies, vital registration, and cancer registries. For
age-specific all-cause mortality estimations, we added vital
registration data, complete birth history sources, summary birth
history sources, and sibling history surveys. These improvements
are reflected in the summary measures of population health,
DALYs and HALE, reported in this paper. We also provided a
more detailed assessment for HALE than in previous GBD papers
by examining the following: distinguishing the years of life
gained over the past 28 years into years spent in good health
and in poor health, by sex, for each location; determining which
extra years lived were spent in good health and in poor health
for females compared with males for each location; and
assessing the male–female difference in HALE and years lived in
poor health for the period 1990–2017 across
Socio-demographic Index (SDI) quintiles. With increasing
longevity, such information has relevance for policy
development, health systems planning, and resource allocation.
Implications of all the available evidence
Over the past 28 years, the world has had tremendous gains in
life expectancy; however, in many locations simply gaining
years of life has not meant living those years in good health.
In some locations, a large proportion of those years are spent in
poor health. By distinguishing where, among whom, and how
many of these additional years of life gained are spent in good
health versus poor health, we have more insight to inform
policy, planning, and resource prioritisation for improving
health and reducing disparities. Our results showed large
disparities in health and disease burden by SDI and sex,
suggesting that much could be done to narrow these gaps, such
as targeted approaches to reduce risk factors and scale up
proven cost-effective interventions to decrease the burden of
disease and make additional improvements to HALE more
equitable. Our results not only provide the most up-to-date
evidence, but also serve as a baseline for evaluating the
effectiveness of interventions and programmes over time.
years expected to be lived in good health, and
disability-adjusted life-years (DALYs), which quantifies the health
loss due to specific diseases and injuries. HALE provides
a snapshot of overall population health and DALYs are
useful for quantifying and ranking disease burden due
to specific causes. DALYs can be utilised to help decision
makers and the public understand the leading causes of
health burden and whether improvement occurs over
time.
The continuing trend of increasing life expectancy
and decreasing mortality because of improvements in
living conditions, income per capita, education, and
medical practices is well known and understood.
2–5Previous GBD papers have reported that increases in
HALE have been slower than increases in life
expectancy, resulting in more years of poor health, and
suggesting an absolute expansion of morbidity.
6–9However, details of how many of the additional years of
life gained are spent in good health versus poor health
across countries and socio demographic groups have not
been well characterised. As people live longer, such
information becomes increasingly relevant for policy
development, health systems planning, and resource
allocation, the effects of which cannot be understated
for population health. The estimates herein provide
insight into the importance of access to services and
appropriate health care, and the potential societal
burden of caregiving and excess health-care expenditure
for years lived in poor health.
10In this study, we present GBD 2017 results for HALE
and DALYs by age and sex from 1990 to 2017 for
195 countries and territories. GBD 2017 includes new
morbidity and mortality data (epidemiological
sur-veillance data, disease registry data, scientific literature
sources, survey sources, verbal autopsy studies, vital
registration systems,
cancer registries, complete birth
history sources, summary birth history sources, and
sibling history surveys); refined methods; and new
estimations at the subnational level for Ethiopia, Iran,
Norway, and Russia, and stratified by ethnicity for
New Zealand. Also, the disaggregation of larger cause
categories (eg, diabetes) has allowed separate estimation
for several additional diseases (eg, type 1 and type 2
diabetes). GBD 2017 provides a complete reanalysis of all
available data by country from 1990 to 2017, and thus
supersedes all previously published GBD estimations of
HALE and DALYs.
Methods
Overview
The GBD study comprehensively and systematically
quantifies the comparative magnitude of health loss due
to diseases and injuries by age, sex, and location
over
time. We estimated all-cause and cause-specific mortality
using the following key principles: identification of all
data sources that are available, assessment of the quality
of the data and correction for known bias, application of
highly standardised analytical procedures, and
assess-ment of model performance using cross-validation
analysis. We used similar principles to identify, enhance
comparability, and analyse data to estimate the incidence,
prevalence, and YLDs of diseases and injuries.
7Using the
GBD 2017 results for YLLs and YLDs, we calculated
DALYs for 359 diseases and injuries.
11,12We used
age-specific mortality and YLDs per person to calculate
HALE, defined as the average number of years that a
person at a given age can expect to live in good health,
taking into account mortality and loss of functional
health.
13Additional details for computing HALE can be
found in appendix 1. We calculated years lived in poor
health (ie, years lived with functional health loss) as life
expectancy minus HALE. Estimations for GBD 2017
cover the period 1990 to 2017 for 195 countries and
territories. We did analyses using Python versions 2.7.12
and 2.7.3, Stata version 13.1, and R version 3.2.2.
For this study, we followed the Guidelines for Accurate
and Transparent Health Estimates Reporting
(GATHER),
14which include recommendations on
docu-mentation of data sources, estimation methods, and
statistical analysis (appendix 1). Interactive online tools
are available to explore GBD 2017 data sources in detail
using our online sourcing tool, the Global Health Data
Exchange. Data before and after adjustments and the fit
of the model to the data for causes of death and
non-fatal outcomes can be explored with the available data
visualisation tool.
Cause and location hierarchies
In GBD 2017, as in previous GBDs, causes of mortality
and morbidity are structured using a four-level
classification hierarchy to produce results that are
mutually exclusive and collectively exhaustive. GBD 2017
estimates 359 causes of DALYs, 77 of which are a source
of disability but not a cause of death (eg, attention-deficit
hyperactivity disorder, headache disorders, low back
pain, and neck pain), and five of which are causes
of death but not sources of morbidity (sudden infant
death syndrome, aortic aneurysm, late maternal deaths,
indirect maternal deaths, and maternal deaths aggravated
by HIV/AIDS). In the GBD hierarchy, the number of
mutually exclusive and collectively exhaustive fatal and
non-fatal causes in each level for which GBD estimates is
three at Level 1, 22 at Level 2, 169 at Level 3, and 293 at
Level 4. The full GBD cause hierarchy, including
corresponding International Classification of Diseases
(ICD)-9 and ICD-10 codes and detailed cause-specific
methods, is in GBD 2017 publications on cause-specific
mortality
11and non-fatal health outcomes
12in the
corresponding appendices.
GBD 2017 includes 195 countries and territories that
are grouped into 21 regions on the basis of epidemiological
similarities and geographical proximity.
15For the
purposes of statistical analyses, we further grouped
regions into seven super-regions (central Europe, eastern
See Online for appendix 1
For the online data
visualisation tool see
https://vizhub.healthdata.org For the Global Health Data
Exchange see http://ghdx.
Europe, and central Asia; high income; Latin America
and Caribbean; north Africa and Middle East; south Asia;
southeast Asia, east Asia and Oceania; and sub-Saharan
Africa). Each year, GBD includes subnational analyses
for a few new countries and continues to provide
subnational estimates for countries that were added in
previous cycles. Subnational estimation in GBD 2017
includes five new countries (Ethiopia, Iran, New Zealand,
Norway, and Russia) and countries previously estimated
at subnational levels (GBD 2013: China, Mexico, and the
UK [regional level]; GBD 2015: Brazil, India, Japan,
Kenya, South Africa, Sweden, and the USA; and GBD
2016: Indonesia and the UK [local government authority
level]). All analyses are at the first level of administrative
organisation within each country except for New Zealand
(by Māori ethnicity), Sweden (by Stockholm and
non-Stockholm), and the UK (by local government authorites).
All subnational estimates for these countries were
incorporated into model development and evaluation as
part of GBD 2017. To meet data use requirements, we
present all subnational estimates excluding those
pending publication (Brazil, India, Japan, Kenya, Mexico,
Sweden, the UK, and the USA); these results are
presented in appendix tables and figures (appendix 2).
Subnational estimates for countries with populations
larger than 200 million people (as measured according to
our most recent year of published estimates) that have
not yet been published elsewhere are presented wherever
estimates are illustrated with maps but are not included
in data tables.
Estimation of mortality and non-fatal health loss
We estimated age-specific mortality using data from
vital registration systems, sample registration systems,
household surveys, censuses, and demographic
sur-veillance sites.
13We estimated cause-specific mortality
and YLLs using the GBD cause of death database,
composed of vital registration and verbal autopsy data,
survey and census data for injuries and maternal
mortality, surveillance data for maternal and child
mortality, cancer registries, and police records for
interpersonal violence and road injuries.
11The quality
and comparability of the cause of death data were
evaluated and improved through several steps, including
adjustment of data from vital registration
systems
for incompleteness, conversion of causes found in
the original data to the GBD 2017 cause list, and
redistribution of deaths assigned to ICD codes that
cannot be underlying causes of death. Detailed methods
for each step are available in the appendix of the GBD
2017 causes of death paper.
11We estimated cause-specific
mortality using standardised modelling processes, most
commonly the Cause of Death Ensemble model
(CODEm), which uses a covariate selection algorithm to
generate several plausible combinations of covariates
that are then run through four model classes—namely,
mixed effects linear models and spatiotemporal
Gaussian process regression models for cause fractions
and death rates. For a given cause, we categorised
covariates into three groups on the basis of the following
criteria: evidence of proximal or causal association
(Level 1), strong evidence for an association but without
adequate evidence of a causal link (Level 2), and
covariates that are distal in the causal pathway and
therefore might be mediated by other factors in Levels 1
or 2 (Level 3).
16The programme then selects an
ensemble of models that performs best on
out-of-sample predictive validity tests for each cause of death.
Ensemble models have been shown to produce smaller
errors in estimated cause-specific mortality and more
accurate trends than single-component models.
16Additional detail, including model specifications and
data availability for each cause-specific model, can be
found in the appendices of the GBD 2017 causes of
death
11and mortality
13publications. We calculated YLLs
from the sum of each death multiplied by the standard
life expectancy at each age. The standard life expectancy
was taken from the lowest observed risk of death for
each 5-year age group in all populations greater than
5 million people. For consistency across all fatal and
non-fatal estimates in GBD 2017, we calculated our own
population and fertility estimates.
17We then used the
GBD world population age standard to calculate
age-standardised rates for cause-specific deaths and YLLs.
The GBD world population age standard and the
standard life expectancies are available in the appendix
of the GBD 2017 mortality publication.
13Changes we have implemented since GBD 2016 for
cause-specific mortality include the addition of important
sources of new mortality data (detailed at the beginning
of this section) and the expansion of the GBD location
hierarchy, refinements in the calculation of
Socio-demographic Index (SDI), and disaggregation of specific
causes into sub groupings to provide additional detail. We
estimated the following specific causes separately for the
first time: invasive non-typhoidal salmonella disease;
liver cancer due to non-alcoholic steatohepatitis (NASH);
cirrhosis due to non-alcoholic steatohepatitis;
myelo-dysplastic, myelo proliferative, and other haemopoietic
neoplasms; benign and in-situ intestinal neoplasms;
benign and in-situ cervical and uterine neoplasms;
other benign and in-situ neoplasms; subarachnoid
haemorrhage; non-rheumatic valvular heart disease;
rheumatic calcific aortic valve disease;
rheumatic degenerative mitral valve disease; other
non-rheumatic valve diseases; gastro-oesophageal reflux
disease; type 1 diabetes; type 2 diabetes; chronic kidney
disease due to type 1 diabetes; chronic kidney disease due
to type 2 diabetes; poisoning by carbon monoxide; and
poisoning by other means. Specific data sources are
available in the appendices of the GBD 2017 non-fatal
diseases and injuries
12and causes of death
11publications.
Additional information on data sources used can be
found in our online source tool.
For estimation of non-fatal health loss, we most
commonly used the Bayesian meta-regression tool
DisMod-MR 2.1, which synthesises variable data sources
to produce internally consistent estimates of incidence,
prevalence, remission, and excess mortality.
18If
DisMod-MR 2.1 did not capture the complexity of the disease, or if
incidence and prevalence needed to be calculated from
other data, we used custom models; detailed methods for
each cause are in the appendices of the GBD 2017
non-fatal diseases and injuries publication.
12We estimated each non-fatal sequela separately and
assessed the occurrence of comorbidity for each age
group, sex, location, and year separately using a
micro-simulation framework.
12Disability estimated for
co-morbid conditions was distributed to each contributing
cause during the comorbidity estimation process.
Although the distribution of sequelae and the severity
and cumulative disability per case of a condition might
be different by age, sex, location, and year, previous
studies have found that disability weights do not
substantially vary between locations, income per capita,
or levels of educational attainment.
19,20Additional details,
including model specifications, data availability, data
adjustments to enhance comparability for each
cause-specific model, and the development of disability weights
by cause and their use in the estimation of non-fatal
health loss, are available in the appendices of the GBD
2017 non-fatal diseases and injuries publication.
12Estimation of DALYs, HALE, and corresponding
uncertainty
To calculate HALE, we used the following inputs from
GBD 2017: age-specific mortality rates; estimates of the
prevalence of sequelae by age, sex, location, and year; and
disability weights for all unique health states. We used
the method originally developed by Sullivan
21to estimate
HALE (appendix 1). We calculated DALYs as the sum of
YLLs
11and YLDs
12for each location, year, age group, and
cause, by sex.
We calculated 95% uncertainty intervals (UIs) on the
basis of 1000 draws from the posterior distribution of
each step in the estimation process using the 2·5th and
97·5th percentiles of the ordered 1000 values. We
attributed the uncertainty associated with estimation of
mortality and YLLs to multiple sources, including sample
size variability in data sources, adjustment and
standard-isation methods applied to data, and model specifications.
We attributed the uncertainty associated with estimation
of YLDs to sampling error of data inputs, adjustment and
standardisation methods applied to data, the uncertainty
in coefficients from model fit, and the uncertainty of
severity distributions and disability weights.
Estimation of SDI and expected DALYs and HALE on the
basis of SDI
The SDI is the geometric mean of three rescaled
components: total fertility rate under age 25 years (ie, the
number of births expected per woman aged 10–24 years),
lag-distributed income per capita, and average
edu-cational attainment
in populations aged 15 years or
older. The methods we used to calculate the SDI are in
appendix 1. SDI scores were scaled from 0 (lowest
income, fewest years of schooling, and highest fertility)
to 1 (highest income, most years of schooling, and lowest
fertility). We estimated the association between SDI and
cause-specific mortality using a generalised additive
model with a Loess smoother on SDI; we then used this
association to calculate expected YLLs. Expected YLDs
were calculated on the basis of the relationship between
SDI and YLD rates. We then calculated expected DALYs
as the sum of expected YLLs and YLDs, and expected
HALE using expected YLDs and expected life tables. All
results are available both in appendix 2 and through our
online visualisation tool.
Role of the funding source
The funder of the study had no role in study design, data
collection, data analysis, data interpretation, or writing of
the report. All authors had full access to all the data in the
study and had final responsibility for the decision to
submit for publication.
Results
Levels and trends in life expectancy and HALE at birth
Globally, life expectancy at birth for both sexes combined
increased by 7·4 years (95% UI 7·1–7·8), rising from
65·6 years (65·3–65·8) in 1990 to 73·0 years (72·7–73·3)
in 2017
(appendix 2). The increase in life expectancy at
Life expectancy at birth HALE at birth
Females Males Females Males
1990 2017 1990 2017 1990 2017 1990 2017 Global 68·0 (67·8–68·3) 75·6 (75·3–75·9) 63·2 (62·9–63·4) 70·5 (70·1–70·8) 58·4 (55·7–60·8) 64·8 (61·7–67·4) 55·6 (53·5–57·5) 61·8 (59·4–64·0) Low SDI 54·8 (54·3–55·4) 67·3 (66·7–67·9) 53·0 (52·4–53·6) 64·5 (63·8–65·1) 46·4 (44·0–48·5) 57·3 (54·5–59·8) 46·1 (44·1–47·9) 56·2 (53·9–58·4) Low-middle SDI 61·9 (61·5–62·3) 70·1 (69·5–70·7) 59·0 (58·5–59·4) 66·3 (65·7–66·9) 52·6 (50·0–55·0) 59·8 (56·9–62·4) 51·5 (49·3–53·5) 58·0 (55·6–60·1) Middle SDI 70·0 (69·7–70·3) 77·4 (77·1–77·7) 65·7 (65·3–66·1) 71·7 (71·4–72·1) 60·8 (58·2–63·1) 67·0 (64·1–69·5) 58·4 (56·3–60·2) 63·6 (61·2–65·6) High-middle SDI 73·1 (72·9–73·4) 79·4 (79·1–79·7) 66·8 (66·5–67·0) 73·3 (73·0–73·7) 63·1 (60·4–65·5) 68·5 (65·4–71·1) 59·0 (56·9–61·0) 64·7 (62·2–66·8) High SDI 79·3 (79·3–79·3) 83·7 (83·5–83·9) 72·6 (72·5–72·6) 78·5 (78·3–78·6) 67·9 (64·6–70·7) 71·1 (67·6–74·2) 63·8 (61·3–66·0) 68·2 (65·4–70·8) (Table 1 continues on next page)
Life expectancy at birth HALE at birth
Females Males Females Males
1990 2017 1990 2017 1990 2017 1990 2017
(Continued from previous page)
Central Europe, eastern
Europe, and central Asia 73·9 (73·8–74·0) 77·6 (77·4–77·7) 64·8 (64·7–64·9) 68·5 (68·3–68·7) 63·3 (60·3–65·9) 66·3 (63·2–69·1) 56·5 (54·2–58·6) 59·7 (57·2–62·0)
Central Asia 71·8 (71·5–72·0) 74·8 (74·3–75·4) 64·1 (63·7–64·4) 67·4 (66·8–67·9) 61·9 (59·0–64·5) 64·8 (61·9–67·4) 56·3 (54·0–58·3) 59·4 (57·0–61·5) Armenia 73·3 (72·8–73·8) 78·7 (78·2–79·1) 66·7 (66·2–67·2) 72·4 (72·0–72·8) 63·5 (60·7–66·0) 68·1 (65·0–70·7) 58·3 (55·9–60·5) 63·4 (60·7–65·7) Azerbaijan 71·2 (70·4–71·9) 74·7 (73·7–75·7) 63·4 (62·6–64·3) 67·2 (66·2–68·2) 61·7 (59·0–64·1) 64·9 (61·9–67·6) 56·0 (53·7–58·1) 59·5 (57·2–61·6) Georgia 73·9 (73·4–74·4) 77·3 (76·9–77·7) 65·9 (65·2–66·6) 68·4 (68·0–68·8) 64·6 (61·8–67·0) 67·2 (64·3–69·7) 58·4 (56·2–60·4) 60·4 (58·1–62·4) Kazakhstan 73·3 (73·0–73·5) 76·4 (75·8–77·1) 63·4 (63·1–63·7) 67·5 (66·8–68·2) 62·9 (60·0–65·5) 66·1 (63·2–68·6) 55·5 (53·2–57·5) 59·3 (56·9–61·4) Kyrgyzstan 70·5 (69·7–71·1) 76·3 (75·9–76·6) 62·0 (61·2–62·8) 69·1 (68·7–69·4) 60·8 (57·8–63·3) 66·0 (63·0–68·5) 54·3 (51·9–56·3) 60·9 (58·5–63·0) Mongolia 64·0 (63·3–64·7) 73·7 (72·5–74·8) 58·6 (57·9–59·4) 64·5 (63·2–65·9) 55·8 (53·4–58·0) 64·0 (61·0–66·7) 51·7 (49·7–53·7) 56·7 (54·3–59·0) Tajikistan 69·5 (68·9–70·1) 73·3 (72·1–74·5) 64·5 (63·8–65·1) 67·7 (66·3–68·9) 59·9 (57·2–62·4) 63·5 (60·6–66·1) 56·4 (54·0–58·5) 59·4 (56·8–61·8) Turkmenistan 69·3 (68·8–69·9) 73·9 (72·7–74·9) 62·6 (62·0–63·1) 66·5 (65·4–67·7) 60·4 (57·8–62·7) 64·5 (61·7–67·1) 55·3 (53·2–57·3) 59·0 (56·6–61·2) Uzbekistan 72·6 (72·2–72·9) 73·7 (72·2–75·3) 66·0 (65·6–66·4) 67·1 (65·5–68·6) 62·3 (59·3–64·9) 63·9 (60·9–66·8) 57·9 (55·4–60·0) 59·4 (56·8–61·8) Central Europe 74·9 (74·9–75·0) 80·4 (80·2–80·7) 67·2 (67·1–67·2) 73·6 (73·3–73·9) 64·2 (61·1–66·9) 68·8 (65·5–71·7) 58·3 (55·8–60·5) 63·5 (60·6–66·0) Albania 77·4 (77·0–77·7) 82·1 (79·9–84·3) 69·8 (69·5–70·2) 74·9 (72·8–77·1) 66·3 (63·0–69·1) 70·5 (67·0–73·9) 60·7 (58·0–63·1) 65·0 (61·8–68·2) Bosnia and Herzegovina 76·6 (76·4–76·8) 79·1 (78·4–79·7) 70·5 (70·4–70·7) 74·3 (73·6–75·0) 65·6 (62·5–68·3) 67·7 (64·5–70·5) 61·1 (58·5–63·4) 63·7 (60·7–66·4) Bulgaria 75·5 (75·4–75·7) 78·6 (77·9–79·2) 68·2 (68·1–68·3) 71·3 (70·6–72·1) 65·2 (62·2–67·8) 67·7 (64·7–70·5) 59·4 (56·9–61·6) 62·2 (59·5–64·5) Croatia 76·3 (76·1–76·4) 81·6 (80·9–82·3) 68·7 (68·6–68·9) 75·4 (74·7–76·1) 65·7 (62·8–68·4) 69·9 (66·6–72·8) 59·9 (57·3–62·1) 64·9 (62·0–67·4) Czech Republic 75·5 (75·4–75·6) 82·0 (81·3–82·6) 67·6 (67·5–67·6) 76·3 (75·6–77·0) 64·7 (61·6–67·4) 69·6 (66·0–72·7) 58·9 (56·3–61·1) 65·1 (61·9–68·0) Hungary 73·9 (73·8–74·0) 80·2 (79·5–80·9) 65·3 (65·2–65·4) 73·2 (72·4–73·9) 62·9 (59·8–65·7) 68·3 (65·1–71·3) 56·6 (54·2–58·7) 63·1 (60·3–65·6) Macedonia 74·5 (74·2–74·7) 79·7 (79·2–80·3) 69·6 (69·4–69·8) 73·9 (73·2–74·6) 64·1 (61·2–66·7) 68·4 (65·2–71·3) 60·5 (57·9–62·7) 63·9 (61·1–66·3) Montenegro 77·5 (77·2–77·8) 78·9 (78·1–79·7) 71·1 (70·8–71·5) 74·1 (72·9–75·2) 66·7 (63·6–69·5) 67·9 (64·7–70·7) 61·8 (59·1–64·2) 64·1 (61·1–66·6) Poland 75·8 (75·7–75·8) 81·8 (81·2–82·4) 66·8 (66·8–66·9) 74·1 (73·3–74·8) 65·0 (61·9–67·7) 69·9 (66·6–72·9) 58·1 (55·6–60·2) 63·7 (60·7–66·4) Romania 73·2 (73·1–73·3) 79·0 (78·3–79·6) 66·7 (66·6–66·8) 71·5 (70·8–72·3) 62·6 (59·5–65·2) 67·6 (64·3–70·4) 57·4 (54·8–59·7) 61·9 (59·2–64·4) Serbia 74·5 (74·3–74·6) 77·9 (77·2–78·5) 67·6 (67·4–67·7) 73·6 (72·9–74·2) 64·0 (60·9–66·5) 66·9 (63·8–69·6) 58·8 (56·4–61·0) 63·7 (60·8–66·2) Slovakia 75·5 (75·3–75·6) 80·6 (79·9–81·3) 66·7 (66·6–66·8) 74·1 (73·4–74·8) 64·9 (61·8–67·5) 68·9 (65·7–71·8) 57·9 (55·4–60·1) 63·7 (60·7–66·3) Slovenia 77·8 (77·6–78·0) 84·2 (83·5–85·0) 69·7 (69·6–69·9) 77·9 (77·2–78·7) 66·4 (63·3–69·3) 71·2 (67·5–74·4) 60·1 (57·4–62·5) 66·3 (63·0–69·2) Eastern Europe 74·6 (74·6–74·7) 77·2 (77·1–77·4) 64·5 (64·5–64·6) 66·5 (66·3–66·7) 63·7 (60·7–66·4) 65·9 (62·7–68·6) 56·3 (54·0–58·4) 58·2 (55·8–60·3) Belarus 75·7 (75·5–75·9) 78·8 (78·1–79·4) 66·1 (65·8–66·3) 69·0 (68·2–69·7) 64·7 (61·7–67·4) 67·3 (64·1–70·2) 57·7 (55·3–59·9) 60·3 (57·7–62·6) Estonia 75·0 (74·7–75·2) 82·1 (80·7–83·5) 64·7 (64·5–64·9) 73·6 (72·0–75·3) 64·3 (61·2–66·9) 70·0 (66·5–73·4) 56·5 (54·1–58·7) 63·8 (60·8–66·6) Latvia 74·7 (74·5–74·9) 79·8 (78·4–81·3) 64·6 (64·4–64·8) 70·1 (68·6–71·7) 63·9 (60·9–66·6) 68·0 (64·6–71·0) 56·3 (53·9–58·5) 60·9 (58·2–63·6) Lithuania 76·2 (76·0–76·3) 80·2 (79·4–81·0) 66·4 (66·2–66·5) 69·6 (68·7–70·5) 65·2 (62·1–67·8) 68·1 (64·8–71·2) 57·8 (55·4–60·0) 60·4 (57·7–62·8) Moldova 71·4 (71·2–71·7) 77·4 (77·0–77·9) 64·5 (64·2–64·7) 68·2 (67·8–68·7) 61·1 (58·1–63·6) 66·2 (63·1–69·0) 56·1 (53·6–58·2) 59·6 (57·2–61·8) Russia 74·6 (74·6–74·6) 77·2 (77·1–77·4) 64·0 (64·0–64·0) 66·8 (66·6–66·9) 63·7 (60·6–66·4) 65·8 (62·6–68·6) 55·9 (53·6–58·0) 58·4 (56·0–60·5) Ukraine 74·7 (74·5–74·9) 76·5 (75·8–77·2) 65·5 (65·3–65·7) 64·7 (63·9–65·4) 63·7 (60·6–66·4) 65·4 (62·1–68·1) 57·2 (54·8–59·3) 56·7 (54·4–58·8) High income 79·4 (79·4–79·4) 83·6 (83·4–83·7) 72·8 (72·7–72·8) 78·4 (78·2–78·6) 68·0 (64·7–70·8) 71·0 (67·5–74·0) 64·0 (61·4–66·1) 68·2 (65·3–70·7) Australasia 79·7 (79·6–79·8) 84·4 (83·4–85·4) 73·6 (73·5–73·6) 80·1 (79·1–81·2) 68·0 (64·7–70·9) 71·4 (67·7–74·6) 64·1 (61·4–66·4) 68·9 (65·7–71·8) Australia 80·0 (79·9–80·1) 84·6 (83·4–85·7) 73·8 (73·7–73·9) 80·2 (78·9–81·5) 68·4 (65·1–71·3) 71·7 (68·0–74·9) 64·3 (61·6–66·7) 69·1 (65·8–72·0) New Zealand 78·1 (77·9–78·3) 83·6 (83·0–84·2) 72·6 (72·4–72·8) 79·7 (79·0–80·3) 66·3 (62·9–69·3) 70·1 (66·1–73·3) 63·1 (60·2–65·4) 68·0 (64·6–71·0) High-income Asia Pacific 81·0 (81·0–81·1) 86·9 (86·7–87·2) 74·4 (74·4–74·5) 80·8 (80·5–81·0) 70·1 (67·0–72·8) 74·5 (71·0–77·6) 66·3 (63·9–68·3) 71·1 (68·2–73·4)
Brunei 72·1 (71·5–72·8) 77·5 (76·6–78·4) 69·1 (68·5–69·8) 73·3 (72·3–74·4) 62·9 (60·2–65·3) 67·5 (64·5–70·0) 61·4 (59·2–63·4) 65·0 (62·4–67·3) Japan 82·2 (82·2–82·2) 87·2 (87·0–87·4) 76·2 (76·2–76·2) 81·1 (80·8–81·3) 71·2 (68·0–73·9) 74·6 (71·1–77·8) 68·0 (65·6–70·0) 71·4 (68·6–73·8) Singapore 78·8 (78·6–79·0) 87·6 (86·9–88·1) 73·5 (73·3–73·7) 81·9 (81·2–82·6) 68·5 (65·5–71·0) 75·8 (72·4–78·7) 65·6 (63·3–67·6) 72·6 (69·8–75·0) South Korea 76·4 (76·3–76·5) 85·5 (84·9–86·1) 68·0 (67·9–68·1) 79·5 (78·7–80·3) 66·0 (62·9–68·7) 73·5 (70·0–76·5) 60·3 (58·1–62·2) 69·7 (67·0–72·1) High-income North America 79·1 (79·1–79·2) 81·4 (81·1–81·7) 72·3 (72·3–72·3) 76·5 (76·2–76·8) 67·0 (63·6–69·9) 68·2 (64·7–71·3) 62·9 (60·2–65·1) 65·7 (62·7–68·3) Canada 80·6 (80·5–80·6) 84·0 (83·4–84·6) 74·1 (74·0–74·2) 79·9 (79·2–80·5) 69·0 (65·6–71·8) 71·4 (67·7–74·5) 65·3 (62·7–67·5) 69·6 (66·6–72·3) Greenland 69·0 (68·4–69·6) 77·2 (76·2–78·0) 62·1 (61·6–62·6) 70·8 (70·3–71·4) 58·5 (55·7–61·1) 65·3 (62·2–68·3) 54·4 (52·2–56·3) 62·2 (59·7–64·3) USA 79·0 (79·0–79·0) 81·1 (80·8–81·4) 72·1 (72·1–72·1) 76·1 (75·8–76·4) 66·8 (63·4–69·7) 67·9 (64·3–71·0) 62·6 (59·9–64·9) 65·3 (62·3–67·9) (Table 1 continues on next page)
Life expectancy at birth HALE at birth
Females Males Females Males
1990 2017 1990 2017 1990 2017 1990 2017
(Continued from previous page)
Southern Latin America 76·2 (76·1–76·2) 80·4 (79·3–81·3) 69·2 (69·1–69·2) 74·5 (73·3–75·5) 65·9 (62·9–68·5) 69·3 (66·2–72·1) 61·1 (58·8–63·2) 65·3 (62·5–67·9) Argentina 75·9 (75·8–76·0) 79·7 (78·3–81·0) 68·9 (68·9–69·0) 73·6 (72·0–75·0) 65·9 (62·9–68·4) 68·9 (65·7–71·8) 61·0 (58·7–63·0) 64·7 (61·8–67·4) Chile 76·4 (76·3–76·5) 82·1 (80·8–83·4) 69·9 (69·8–70·0) 77·2 (75·7–78·7) 65·7 (62·6–68·4) 70·2 (66·6–73·3) 61·5 (59·0–63·6) 67·1 (64·1–70·0) Uruguay 76·8 (76·6–77·0) 80·4 (79·0–81·9) 69·4 (69·2–69·5) 73·5 (72·1–75·0) 66·6 (63·7–69·2) 69·5 (66·4–72·4) 61·5 (59·2–63·5) 64·8 (62·2–67·4) Western Europe 79·5 (79·5–79·5) 84·2 (83·9–84·5) 73·0 (73·0–73·0) 79·5 (79·2–79·8) 68·2 (65·0–71·0) 71·8 (68·3–74·8) 64·3 (61·8–66·5) 69·4 (66·5–71·9) Andorra 82·6 (80·8–84·6) 85·1 (83·6–86·7) 76·1 (74·7–77·3) 80·5 (79·4–81·7) 70·6 (67·0–74·1) 72·4 (68·6–75·8) 66·8 (63·9–69·5) 70·1 (67·1–72·8) Austria 78·9 (78·8–79·0) 84·0 (83·4–84·6) 72·4 (72·3–72·5) 79·4 (78·8–80·1) 67·9 (64·7–70·6) 71·7 (68·2–74·8) 63·9 (61·4–66·0) 69·1 (66·2–71·8) Belgium 79·3 (79·2–79·4) 83·8 (83·1–84·5) 72·7 (72·6–72·8) 78·9 (78·2–79·5) 67·8 (64·5–70·6) 70·9 (67·3–74·1) 63·9 (61·4–66·1) 68·3 (65·2–71·0) Cyprus 78·3 (78·1–78·5) 85·2 (84·3–86·0) 73·6 (73·4–73·8) 78·5 (77·4–79·5) 67·2 (64·1–70·0) 72·8 (69·1–76·0) 64·9 (62·5–67·1) 68·8 (65·9–71·4) Denmark 77·8 (77·6–77·9) 82·7 (81·9–83·4) 72·2 (72·1–72·4) 78·8 (78·1–79·5) 66·9 (63·7–69·5) 70·6 (67·2–73·6) 63·7 (61·2–65·8) 68·6 (65·6–71·3) Finland 79·1 (78·9–79·3) 84·3 (83·6–84·9) 71·0 (70·9–71·2) 78·5 (77·8–79·2) 67·6 (64·2–70·5) 71·5 (67·9–74·8) 62·2 (59·6–64·4) 68·0 (64·9–70·7) France 81·1 (81·0–81·1) 85·7 (85·1–86·3) 73·0 (72·9–73·0) 79·8 (79·2–80·4) 69·8 (66·5–72·6) 73·4 (69·9–76·5) 64·7 (62·2–66·8) 70·0 (67·2–72·5) Germany 78·6 (78·5–78·6) 83·0 (81·8–84·2) 72·1 (72·1–72·2) 78·2 (76·9–79·5) 67·4 (64·2–70·2) 70·8 (67·2–74·1) 63·5 (61·0–65·7) 68·3 (65·2–70·9) Greece 80·4 (80·3–80·5) 83·6 (83·0–84·2) 74·7 (74·6–74·8) 78·4 (77·8–79·1) 68·9 (65·6–71·8) 71·3 (67·8–74·4) 65·8 (63·3–68·0) 68·6 (65·8–71·1) Iceland 80·2 (79·8–80·5) 85·9 (85·5–86·4) 75·6 (75·2–75·9) 79·8 (79·4–80·2) 68·5 (65·2–71·4) 73·1 (69·5–76·2) 66·3 (63·7–68·5) 69·6 (66·5–72·2) Ireland 77·6 (77·4–77·8) 83·7 (82·9–84·4) 72·2 (72·1–72·4) 80·0 (79·3–80·7) 66·7 (63·6–69·5) 71·3 (67·7–74·4) 63·7 (61·2–65·9) 69·4 (66·3–72·0) Israel 78·9 (78·8–79·1) 84·6 (83·9–85·2) 75·8 (75·6–76·0) 81·3 (80·6–81·9) 67·6 (64·4–70·4) 72·1 (68·6–75·2) 66·4 (63·7–68·7) 70·6 (67·6–73·4) Italy 80·3 (80·2–80·4) 85·3 (84·7–85·9) 73·7 (73·7–73·8) 80·8 (80·2–81·4) 68·8 (65·6–71·7) 73·0 (69·5–76·1) 65·0 (62·5–67·2) 70·6 (67·7–73·3) Luxembourg 78·9 (78·6–79·2) 83·3 (82·3–84·2) 71·8 (71·6–72·1) 80·0 (78·9–81·2) 67·0 (63·6–69·9) 70·4 (66·8–73·7) 62·7 (60·1–64·9) 69·0 (65·6–71·9) Malta 78·8 (78·5–79·0) 83·0 (82·4–83·6) 74·2 (73·9–74·4) 78·9 (78·4–79·5) 67·7 (64·6–70·5) 70·9 (67·4–73·9) 65·3 (62·7–67·5) 68·7 (65·6–71·3) Netherlands 80·1 (80·0–80·2) 83·1 (82·4–83·7) 73·8 (73·7–73·9) 79·9 (79·2–80·5) 68·4 (65·1–71·3) 70·7 (67·2–73·9) 64·9 (62·4–67·1) 69·6 (66·6–72·2) Norway 80·0 (79·9–80·1) 84·2 (84·0–84·4) 73·4 (73·3–73·5) 80·5 (80·2–80·7) 68·1 (64·7–71·0) 71·1 (67·4–74·3) 64·0 (61·3–66·4) 69·3 (66·2–72·0) Portugal 77·6 (77·5–77·7) 84·2 (83·6–84·8) 70·7 (70·5–70·8) 78·5 (77·9–79·2) 66·2 (62·9–69·0) 71·6 (68·0–74·7) 62·1 (59·6–64·2) 68·6 (65·6–71·2) Spain 80·5 (80·4–80·6) 85·8 (85·3–86·3) 73·5 (73·4–73·5) 80·2 (79·7–80·8) 69·4 (66·3–72·1) 73·6 (70·0–76·7) 65·0 (62·5–67·1) 70·5 (67·7–72·9) Sweden 80·5 (80·4–80·6) 84·2 (83·7–84·7) 74·9 (74·8–75·1) 80·8 (80·2–81·4) 68·8 (65·4–71·6) 71·4 (67·8–74·6) 66·0 (63·4–68·3) 70·4 (67·4–73·1) Switzerland 81·1 (81·0–81·3) 85·7 (85·1–86·3) 74·4 (74·3–74·5) 82·1 (81·5–82·8) 69·0 (65·6–72·0) 72·7 (69·0–75·9) 65·1 (62·4–67·4) 71·2 (68·1–74·0) UK 78·5 (78·4–78·5) 82·7 (82·6–82·8) 72·9 (72·9–73·0) 79·2 (79·0–79·3) 67·3 (64·0–70·0) 70·0 (66·5–73·1) 64·1 (61·6–66·3) 68·5 (65·5–71·1) England 78·7 (78·7–78·7) 82·9 (82·8–83·0) 73·2 (73·1–73·2) 79·5 (79·4–79·6) 67·4 (64·2–70·2) 70·1 (66·5–73·2) 64·4 (61·8–66·5) 68·7 (65·6–71·3) Northern Ireland 77·3 (77·0–77·6) 82·5 (81·5–83·4) 71·5 (71·3–71·7) 78·7 (77·7–79·8) 66·4 (63·3–69·0) 70·3 (67·0–73·5) 63·1 (60·6–65·2) 68·5 (65·5–71·3) Scotland 76·8 (76·7–77·0) 81·2 (80·3–82·1) 71·2 (71·0–71·3) 76·9 (76·0–78·0) 65·8 (62·7–68·5) 69·3 (66·0–72·2) 62·5 (60·0–64·6) 66·8 (64·0–69·5) Wales 78·6 (78·4–78·7) 82·5 (81·7–83·2) 72·9 (72·8–73·1) 78·3 (77·5–79·1) 67·3 (64·1–70·1) 70·4 (66·9–73·6) 64·1 (61·5–66·3) 68·1 (65·1–70·7)
Latin America and
Caribbean 72·5 (72·3–72·6) 78·9 (78·6–79·2) 66·2 (66·0–66·4) 72·8 (72·4–73·2) 62·6 (59·8–65·0) 68·3 (65·2–70·8) 58·6 (56·3–60·5) 64·2 (61·7–66·3)
Andean Latin America 70·6 (70·0–71·2) 79·5 (78·4–80·6) 66·7 (66·1–67·3) 76·2 (74·9–77·4) 61·4 (58·8–63·8) 69·2 (66·1–72·0) 58·9 (56·5–60·9) 67·0 (64·3–69·6) Bolivia 62·1 (60·8–63·3) 74·2 (72·1–76·6) 59·7 (58·5–61·0) 71·3 (68·8–73·9) 54·0 (51·5–56·3) 64·4 (61·2–67·7) 52·6 (50·2–54·6) 62·8 (59·8–65·8) Ecuador 74·4 (74·1–74·6) 78·7 (77·5–79·9) 69·7 (69·5–70·0) 74·8 (73·3–76·1) 64·8 (62·0–67·3) 68·7 (65·6–71·4) 61·5 (59·0–63·5) 65·8 (63·0–68·2) Peru 72·2 (71·3–73·2) 81·9 (80·1–83·7) 67·9 (66·9–68·9) 78·7 (76·8–80·8) 62·7 (59·8–65·3) 71·3 (68·1–74·5) 60·0 (57·6–62·2) 69·3 (66·2–72·4) Caribbean 70·4 (69·9–70·8) 75·4 (74·4–76·4) 66·4 (65·9–66·8) 70·3 (69·3–71·4) 61·2 (58·5–63·6) 65·3 (62·5–67·9) 58·9 (56·7–60·9) 62·2 (59·7–64·5) Antigua and Barbuda 77·9 (77·2–78·7) 78·7 (78·1–79·4) 70·8 (70·1–71·4) 75·3 (74·4–76·2) 67·3 (64·1–70·2) 68·1 (65·0–70·8) 62·6 (60·1–64·8) 66·4 (63·7–68·7) The Bahamas 74·7 (74·3–75·1) 76·6 (75·4–77·9) 67·6 (67·2–68·0) 70·8 (69·6–72·1) 65·4 (62·7–67·7) 66·9 (63·9–69·5) 60·5 (58·5–62·3) 63·2 (60·7–65·5) Barbados 76·1 (75·7–76·5) 78·6 (77·7–79·6) 71·2 (70·8–71·5) 75·5 (74·4–76·6) 66·7 (63·9–69·0) 68·6 (65·5–71·2) 63·8 (61·6–65·7) 67·2 (64·5–69·5) Belize 73·8 (73·1–74·4) 77·4 (76·9–77·9) 70·3 (69·5–71·0) 71·2 (70·7–71·8) 64·0 (61·0–66·5) 67·0 (64·0–69·5) 62·4 (60·0–64·6) 63·1 (60·6–65·3) Bermuda 78·3 (77·9–78·6) 85·7 (84·8–86·5) 69·7 (69·3–70·2) 77·1 (76·4–77·6) 68·5 (65·7–70·9) 74·3 (71·0–77·3) 62·5 (60·5–64·4) 68·5 (66·0–70·7) Cuba 76·8 (76·6–76·9) 80·7 (79·3–82·1) 73·0 (72·9–73·1) 76·2 (74·6–77·7) 66·8 (63·9–69·4) 70·4 (67·4–73·2) 65·3 (63·0–67·2) 67·9 (65·4–70·5) Dominica 75·3 (74·7–75·7) 75·4 (74·3–76·4) 70·4 (70·0–70·8) 70·4 (69·4–71·4) 65·6 (62·7–68·0) 65·8 (62·9–68·3) 62·7 (60·5–64·8) 62·6 (60·2–64·7) Dominican Republic 74·4 (73·4–75·4) 76·8 (75·2–78·5) 69·6 (68·4–70·7) 69·8 (67·8–71·9) 64·6 (61·6–67·2) 66·8 (63·6–69·5) 61·5 (59·0–63·8) 62·0 (59·3–64·7) Grenada 71·6 (71·0–72·1) 75·4 (74·7–76·2) 67·1 (66·6–67·6) 73·0 (72·3–73·6) 62·5 (59·8–64·9) 65·8 (62·9–68·3) 60·0 (57·9–61·9) 64·8 (62·2–66·9) Guyana 69·0 (68·7–69·4) 72·2 (70·5–73·9) 62·4 (62·0–62·8) 66·4 (64·6–68·2) 59·6 (56·9–62·0) 62·4 (59·3–65·3) 54·9 (52·7–56·9) 58·6 (56·0–60·9) (Table 1 continues on next page)
Life expectancy at birth HALE at birth
Females Males Females Males
1990 2017 1990 2017 1990 2017 1990 2017
(Continued from previous page)
Haiti 55·0 (53·6–56·5) 66·0 (63·3–68·8) 53·9 (52·3–55·5) 63·8 (61·4–66·4) 47·4 (44·9–49·8) 56·8 (53·6–59·9) 47·3 (44·9–49·5) 55·8 (52·7–58·6) Jamaica 76·4 (75·7–77·1) 77·5 (75·4–79·4) 73·6 (73·0–74·3) 72·0 (69·8–74·1) 66·6 (63·5–69·0) 67·4 (64·2–70·3) 65·4 (62·9–67·5) 63·9 (61·0–66·6) Puerto Rico 78·4 (78·2–78·6) 81·6 (80·9–82·3) 70·0 (69·8–70·1) 74·5 (73·7–75·4) 68·6 (65·8–71·1) 70·8 (67·7–73·6) 62·3 (60·0–64·1) 65·8 (63·1–68·1) Saint Lucia 73·2 (72·8–73·6) 78·1 (77·2–78·9) 67·8 (67·4–68·2) 73·1 (72·2–74·0) 63·7 (61·1–66·2) 67·9 (64·9–70·6) 60·4 (58·3–62·3) 64·9 (62·5–67·0) Saint Vincent and the
Grenadines 72·9 (72·4–73·5) 75·4 (74·6–76·3) 69·1 (68·5–69·6) 69·6 (68·9–70·4) 63·5 (60·5–65·9) 65·5 (62·6–68·1) 61·4 (59·2–63·4) 61·7 (59·5–63·9) Suriname 71·3 (70·5–72·2) 75·3 (74·0–76·6) 66·4 (65·4–67·4) 68·9 (67·2–70·7) 62·1 (59·4–64·5) 65·2 (62·2–68·0) 59·2 (56·9–61·3) 61·2 (58·7–63·7) Trinidad and Tobago 72·5 (72·1–72·8) 77·6 (74·8–80·3) 67·5 (67·2–67·8) 71·1 (68·4–74·0) 63·0 (60·3–65·4) 67·2 (63·6–70·6) 60·1 (57·9–62·0) 63·0 (59·9–66·0) Virgin Islands 76·2 (75·1–77·0) 78·8 (77·2–80·1) 69·0 (68·2–69·7) 69·5 (67·9–71·8) 66·9 (64·1–69·4) 69·0 (65·9–71·7) 61·9 (59·7–63·7) 62·2 (59·7–64·9) Central Latin America 74·0 (73·9–74·2) 79·4 (79·0–79·8) 68·1 (67·9–68·3) 73·3 (72·8–73·8) 64·4 (61·8–66·8) 69·1 (66·1–71·6) 60·6 (58·4–62·4) 65·0 (62·5–67·1) Colombia 74·8 (74·6–75·0) 82·7 (81·4–83·9) 68·1 (67·9–68·4) 77·4 (75·9–79·0) 65·1 (62·4–67·6) 72·1 (68·9–75·0) 60·7 (58·6–62·5) 68·7 (66·1–71·4) Costa Rica 78·7 (78·5–79·0) 82·7 (81·9–83·4) 74·4 (74·2–74·6) 76·3 (75·5–77·1) 68·4 (65·4–71·0) 71·9 (68·8–74·4) 66·4 (64·1–68·3) 67·9 (65·2–70·0) El Salvador 73·6 (73·2–73·9) 78·3 (76·0–80·4) 64·9 (64·5–65·2) 69·3 (66·7–72·0) 64·0 (61·4–66·5) 68·3 (65·0–71·3) 57·2 (55·0–59·2) 61·5 (58·4–64·3) Guatemala 65·7 (65·3–66·2) 76·0 (74·5–77·4) 60·4 (59·9–60·9) 69·1 (67·4–70·8) 57·1 (54·5–59·3) 66·1 (63·1–69·0) 53·5 (51·4–55·3) 61·2 (58·7–63·7) Honduras 71·2 (69·6–72·8) 75·0 (72·4–78·2) 66·6 (64·8–68·6) 72·9 (70·2–75·6) 61·7 (58·7–64·3) 65·3 (61·8–68·7) 59·0 (56·4–61·7) 64·6 (61·4–67·7) Mexico 74·3 (74–74·6·0) 78·5 (78·2–78·8) 68·6 (68·2–68·9) 72·6 (72·3–72·9) 64·7 (62·1–67·0) 68·2 (65·3–70·7) 61·0 (58·9–62·9) 64·2 (61·8–66·3) Nicaragua 74·1 (73·2–74·9) 80·6 (79·4–82·0) 69·7 (68·6–70·7) 76·9 (75·3–78·4) 63·5 (60·5–66·2) 69·8 (66·6–72·7) 61·2 (58·6–63·4) 67·8 (65·1–70·5) Panama 78·1 (77·7–78·4) 81·7 (80·9–82·5) 73·8 (73·4–74·1) 77·0 (76·2–77·9) 67·8 (64·8–70·4) 70·9 (67·8–73·6) 65·7 (63·2–67·7) 68·1 (65·4–70·5) Venezuela 75·1 (75·0–75·2) 79·6 (77·7–81·5) 69·2 (69·1–69·3) 71·2 (68·9–73·7) 65·5 (62·9–67·9) 69·3 (66·0–72·3) 61·8 (59·6–63·6) 63·4 (60·5–66·1) Tropical Latin America 71·7 (71·4–72·0) 79·1 (78·8–79·3) 64·0 (63·7–64·4) 72·0 (71·8–72·3) 61·2 (58·2–63·8) 67·8 (64·6–70·5) 56·3 (54·0–58·3) 63·1 (60·5–65·3) Brazil 71·6 (71·2–71·9) 79·1 (78·8–79·3) 63·8 (63·4–64·2) 72·0 (71·7–72·2) 61·1 (58·1–63·7) 67·7 (64·6–70·5) 56·1 (53·9–58·1) 63·1 (60·5–65·3) Paraguay 76·4 (75·6–77·2) 78·9 (76·8–81·2) 72·3 (71·4–73·0) 73·4 (71·0–76·0) 65·5 (62·3–68·4) 67·9 (64·4–71·0) 63·3 (60·7–65·7) 64·4 (61·1–67·4)
North Africa and Middle
East 68·2 (67·9–68·6) 76·8 (76·4–77·3) 64·5 (64·1–64·9) 72·0 (71·5–72·5) 57·5 (54·5–60·2) 64·8 (61·4–67·7) 55·9 (53·5–58·1) 62·1 (59·4–64·5) Afghanistan 52·0 (49·9–54·3) 63·2 (60·6–65·8) 53·1 (51·0–55·2) 63·6 (61·3–65·9) 42·9 (40·0–45·9) 52·5 (49·2–56·2) 44·1 (41·1–46·8) 53·6 (50·4–56·5) Algeria 73·2 (72·3–74·1) 78·5 (77·9–79·1) 70·3 (69·4–71·2) 77·0 (76·4–77·6) 61·9 (58·6–64·9) 66·6 (63·1–69·6) 60·9 (58·2–63·4) 66·4 (63·4–69·0) Bahrain 71·9 (71·4–72·4) 80·4 (79·5–81·4) 69·4 (69·0–70·0) 78·8 (77·8–79·8) 60·9 (57·8–63·6) 67·6 (64·0–70·9) 60·5 (58·0–62·7) 67·8 (64·7–70·8) Egypt 66·6 (66·1–67·1) 74·3 (72·9–75·8) 62·6 (62·1–63·0) 68·0 (66·6–69·3) 56·3 (53·3–58·9) 63·0 (59·8–66·0) 54·5 (52·1–56·6) 59·3 (56·7–61·7) Iran 70·8 (70·1–71·4) 79·4 (79·3–79·5) 65·7 (65·0–66·3) 75·5 (75·4–75·6) 59·6 (56·4–62·4) 66·5 (63·0–69·7) 56·9 (54·5–59·3) 65·0 (62·1–67·5) Iraq 67·6 (65·8–69·3) 78·8 (78·1–79·6) 64·4 (62·5–66·4) 74·8 (73·9–75·6) 56·6 (53·4–59·7) 65·7 (61·9–69·0) 54·8 (51·9–57·7) 63·3 (60·1–66·2) Jordan 71·7 (70·3–73·0) 81·1 (79·8–82·3) 70·5 (69·0–71·9) 77·8 (76·3–79·2) 60·9 (57·8–63·7) 68·5 (65·0–71·7) 61·1 (58·3–63·8) 67·1 (63·8–70·0) Kuwait 77·1 (76·9–77·4) 87·2 (86·7–87·7) 73·3 (73·1–73·6) 80·7 (80·0–81·3) 65·3 (62·0–68·2) 73·1 (69·1–76·6) 63·7 (61·0–66·1) 69·4 (66·1–72·2) Lebanon 73·4 (72·2–75·0) 80·0 (79·4–80·7) 67·3 (66·1–68·8) 75·8 (75·1–76·4) 62·1 (58·9–65·2) 67·4 (63·9–70·5) 58·3 (55·8–60·7) 65·0 (62·0–67·7) Libya 73·5 (71·7–75·2) 75·0 (73·3–76·9) 70·8 (69·0–72·6) 71·1 (69·4–73·2) 62·3 (59·0–65·4) 63·5 (60·0–66·7) 61·2 (58·1–63·9) 60·9 (58·1–64·1) Morocco 66·2 (65·3–67·2) 74·7 (72·7–76·8) 67·1 (66·1–68·1) 73·2 (71·0–75·5) 56·0 (53·1–58·6) 63·3 (59·9–66·7) 57·8 (55·0–60·1) 63·0 (59·7–66·2) Oman 71·4 (69·2–73·7) 79·4 (78·2–81·2) 66·9 (64·4–69·4) 75·5 (73·3–77·9) 59·6 (55·8–63·1) 66·9 (63·1–70·3) 57·8 (54·7–61·0) 65·0 (61·7–68·5) Palestine 72·6 (70·7–74·5) 78·0 (77·3–78·9) 68·5 (66·7–70·7) 75·6 (74·7–76·4) 61·1 (57·6–64·3) 65·6 (62·1–68·7) 59·1 (56·0–62·1) 64·6 (61·6–67·4) Qatar 72·8 (71·2–74·3) 81·7 (79·8–83·5) 70·7 (69·1–72·4) 79·6 (77·7–81·6) 61·7 (58·7–64·6) 68·7 (65·0–72·1) 61·0 (58·0–63·8) 68·1 (64·7–71·5) Saudi Arabia 73·6 (71·6–75·8) 79·4 (78·0–80·2) 70·3 (68·0–72·5) 75·3 (73·9–76·6) 62·2 (58·8–65·5) 67·8 (64·4–70·7) 61·1 (57·9–64·2) 65·4 (62·7–68·2) Sudan 59·9 (58·0–61·7) 72·0 (69·5–74·7) 57·4 (55·6–59·1) 68·8 (66·4–71·5) 50·5 (47·3–53·4) 60·9 (57·4–64·3) 49·6 (47·0–52·1) 59·4 (56·2–62·6) Syria 72·3 (71·2–73·4) 75·0 (74·0–76·3) 67·7 (66·3–69·0) 65·5 (63·8–67·2) 61·2 (58·1–64·0) 63·5 (60·2–66·5) 59·1 (56·4–61·5) 56·7 (54·0–59·3) Tunisia 74·5 (73·9–75·0) 80·7 (78·5–83·0) 70·8 (70·3–71·5) 76·1 (73·7–78·6) 63·5 (60·4–66·2) 69·0 (65·3–72·2) 61·4 (58·8–63·7) 65·8 (62·5–69·1) Turkey 72·1 (71·3–72·8) 83·0 (82·0–84·0) 65·6 (64·8–66·3) 75·2 (74·1–76·3) 60·8 (57·5–63·6) 70·3 (66·8–73·6) 57·3 (55·0–59·4) 65·7 (62·9–68·2) United Arab Emirates 73·0 (71·2–75·0) 76·9 (74·7–79·2) 70·2 (68·2–72·4) 71·7 (69·3–74·0) 62·1 (58·7–65·3) 65·6 (62·2–69·0) 60·8 (57·9–63·7) 62·0 (58·8–65·0) Yemen 59·8 (57·3–62·6) 70·3 (67·6–72·7) 57·5 (55·0–60·1) 66·0 (63·6–68·3) 48·6 (45·0–52·3) 57·8 (54·1–61·7) 48·5 (45·3–51·7) 55·8 (52·6–59·1)
South Asia 60·3 (59·7–61·0) 70·2 (69·7–70·7) 59·0 (58·4–59·5) 67·9 (67·4–68·4) 50·9 (48·2–53·3) 59·6 (56·7–62·1) 51·5 (49·3–53·4) 59·4 (57·1–61·5)
Bangladesh 59·5 (58·5–60·6) 74·6 (73·1–76·0) 57·3 (56·4–58·3) 71·8 (70·3–73·3) 50·5 (47·9–52·9) 63·3 (60·1–66·3) 50·4 (48·3–52·3) 62·9 (60·2–65·2) Bhutan 59·9 (57·8–62·1) 76·0 (73·9–78·1) 60·0 (57·9–62·3) 72·3 (69·8–74·8) 50·6 (47·6–53·7) 64·9 (61·6–68·2) 52·4 (49·6–55·0) 63·5 (60·4–66·4) India 60·4 (59·6–61·1) 70·2 (69·5–70·8) 58·9 (58·3–59·6) 67·8 (67·2–68·3) 50·8 (48·1–53·2) 59·5 (56·5–62·1) 51·4 (49·2–53·4) 59·3 (56·9–61·4) (Table 1 continues on next page)
Life expectancy at birth HALE at birth
Females Males Females Males
1990 2017 1990 2017 1990 2017 1990 2017
(Continued from previous page)
Nepal 59·0 (57·3–60·9) 73·3 (71·5–75·1) 57·7 (56·0–59·5) 68·7 (67·2–70·6) 49·7 (47·0–52·4) 62·3 (59·3–65·2) 50·0 (47·3–52·4) 60·1 (57·4–62·6) Pakistan 61·6 (60·8–62·4) 67·4 (65·1–70·1) 61·7 (60·9–62·6) 66·3 (63·8–69·1) 52·5 (50·0–55·0) 57·8 (54·6–60·9) 54·1 (51·8–56·2) 58·2 (55·3–61·1)
Southeast Asia,
east Asia, and Oceania 69·9 (69·5–70·3) 78·6 (78·2–78·9) 65·8 (65·3–66·2) 72·9 (72·5–73·3) 61·1 (58·7–63·2) 68·4 (65·6–70·9) 58·8 (56·9–60·5) 65·0 (62·7–66·9)
East Asia 70·8 (70·3–71·3) 79·9 (79·4–80·3) 67·0 (66·4–67·6) 74·5 (74·0–74·9) 62·0 (59·6–64·1) 69·7 (66·9–72·1) 60·1 (58·2–61·9) 66·6 (64·4–68·5) China 70·7 (70·1–71·2) 79·9 (79·4–80·4) 66·9 (66·3–67·5) 74·5 (74·1–75·0) 61·9 (59·5–63·9) 69·7 (66·9–72·1) 60·0 (58·1–61·8) 66·6 (64·4–68·6) North Korea 74·3 (72·1–76·5) 75·0 (72·9–77·2) 68·5 (66·7–70·7) 68·6 (67·1–70·2) 64·7 (61·8–67·6) 65·2 (62·3–68·0) 61·8 (59·2–64·3) 61·6 (59·2–64·0) Taiwan (province of China) 77·3 (77·2–77·4) 83·3 (82·6–83·9) 72·1 (72·1–72·2) 76·8 (76·1–77·5) 67·5 (64·9–69·9) 71·8 (68·7–74·5) 64·9 (62·8–66·7) 68·2 (65·8–70·3) Oceania 60·7 (58·8–62·6) 63·4 (61·1–65·5) 55·3 (53·5–57·3) 58·2 (55·9–60·6) 52·4 (49·7–54·9) 54·4 (51·4–57·0) 48·9 (46·5–51·2) 51·1 (48·3–53·8) American Samoa 74·9 (74·2–75·8) 73·8 (72·9–74·8) 67·6 (66·9–68·4) 70·0 (68·5–71·7) 64·4 (61·5–67·0) 63·2 (60·1–66) 59·5 (57·0–61·6) 61·2 (58·5–63·8) Federated States of Micronesia 65·5 (63·4–67·7) 69·6 (67·2–71·7) 61·7 (59·2–64·2) 65·0 (62·8–67·2) 56·8 (53·6–59·7) 59·7 (56·2–62·7) 54·4 (51·5–57·3) 56·9 (54·0–59·5) Fiji 70·1 (68·7–71·7) 70·4 (68·4–72·5) 65·6 (64·0–67·0) 65·9 (64·2–67·7) 60·7 (57·8–63·3) 60·5 (57·3–63·6) 57·5 (54·9–59·9) 57·9 (55·2–60·3) Guam 77·0 (76·4–77·5) 76·4 (75·3–77·5) 70·8 (70·3–71·3) 70·2 (69·2–71·3) 66·8 (63·9–69·4) 65·8 (62·6–68·6) 63·1 (60·8–65·1) 61·8 (59·2–64·1) Kiribati 61·4 (60·0–62·6) 66·3 (63·9–68·9) 55·7 (54·5–57·0) 58·6 (56·2–61·0) 53·0 (50·3–55·4) 56·7 (53·6–59·8) 49·3 (47·2–51·3) 51·4 (48·7–54·1) Marshall Islands 66·4 (65·7–67·0) 66·8 (64·5–69) 59·9 (59·2–60·6) 62·6 (60·6–64·6) 57·6 (55·0–59·9) 57·7 (54·7–60·7) 53·3 (51·4–55·1) 55·3 (52·7–57·9) Northern Mariana Islands 76·0 (74·3–78·0) 79·2 (78·0–80·2) 72·9 (70·7–74·6) 73·6 (72·3–75·0) 66·0 (63·0–68·9) 68·0 (64·7–71·0) 64·6 (61·8–67·1) 64·6 (61·8–66·9) Papua New Guinea 57·3 (55·0–59·9) 61·2 (58·6–63·9) 52·0 (49·7–54·5) 56·2 (53·6–59·2) 49·5 (46·7–52·2) 52·6 (49·5–55·3) 46·0 (43·3–48·6) 49·4 (46·4–52·4) Samoa 73·8 (71·8–75·9) 74·5 (72·9–76·7) 68·1 (66·0–70·2) 71·3 (70·0–72·7) 64·0 (60·7–66·8) 64·0 (61·0–67·0) 60·1 (57·4–62·8) 62·5 (59·8–65·0) Solomon Islands 63·5 (61·0–65·8) 67·5 (65·4–69·4) 59·9 (57·2–62·5) 64·1 (62·0–66·3) 55·1 (52·1–58·0) 58·0 (54·8–60·9) 53·1 (50·2–55·9) 56·5 (53·7–59·1) Tonga 72·1 (71·2–73·1) 75·1 (73·3–77·2) 68·3 (67·6–69·1) 68·6 (66·7–70·1) 62·1 (59·2–64·7) 64·3 (61·0–67·5) 60·5 (58·0–62·6) 60·5 (57·7–62·8) Vanuatu 65·8 (63·1–68·3) 67·8 (65·0–70·2) 59·7 (57·0–62·6) 62·1 (59·2–65·0) 56·5 (53·1–59·7) 57·9 (54·6–60·9) 52·9 (49·8–56·0) 54·9 (51·9–57·8) Southeast Asia 67·8 (67·4–68·3) 75·8 (75·2–76·3) 62·6 (62·0–63·0) 69·4 (68·9–70·0) 58·9 (56·3–61·1) 65·8 (63·0–68·3) 55·2 (53·1–57·2) 61·5 (59·1–63·5) Cambodia 59·8 (58·6–61·1) 72·7 (70·6–74·2) 55·3 (54·0–56·6) 66·8 (65·3–68·3) 51·4 (48·7–53·8) 62·6 (59·6–65·5) 48·4 (46·2–50·5) 58·7 (56·1–61·1) Indonesia 65·4 (64·8–66·0) 73·9 (73·0–74·7) 62·4 (61·8–63·0) 69·2 (68·4–70·1) 56·8 (54·3–58·9) 64·0 (61·2–66·4) 55·0 (52·9–57·0) 61·4 (59·0–63·6) Laos 54·3 (52·4–56·5) 70·3 (68·3–72·3) 49·6 (47·4–51·7) 65·0 (63·0–67·1) 47·4 (44·6–49·9) 61·3 (58·3–64·2) 44·3 (42·0–46·6) 57·8 (55·2–60·4) Malaysia 73·7 (73·6–73·8) 77·3 (76·4–78·4) 69·2 (69·1–69·2) 72·4 (71·3–73·5) 64·5 (61·9–66·8) 67·7 (65·0–70·2) 61·6 (59·4–63·5) 64·4 (61·9–66·7) Maldives 64·6 (64·1–65·0) 83·4 (82·6–84·1) 65·5 (64·9–66·1) 79·9 (79·2–80·6) 55·5 (52·9–57·8) 72·0 (68·7–74·9) 57·6 (55·3–59·7) 70·4 (67·7–72·9) Mauritius 74·2 (73·9–74·5) 78·1 (77·2–79·0) 66·3 (66·1–66·5) 71·5 (70·6–72·5) 64·3 (61·4–66·8) 67·2 (63·9–70·0) 58·5 (56·2–60·5) 62·5 (59·9–64·8) Myanmar 58·4 (56·1–60·8) 72·2 (70·3–74·2) 52·5 (50·0–54·9) 64·9 (63·2–66·7) 50·4 (47·7–53·4) 62·4 (59·4–65·4) 46·2 (43·5–48·8) 57·4 (55·1–59·8) Philippines 71·4 (70·7–72·2) 73·1 (71·2–75·0) 64·6 (63·7–65·6) 66·6 (64·7–68·6) 61·7 (58·9–64·1) 63·5 (60·5–66·2) 56·5 (54·1–58·6) 58·7 (56·1–61·4) Sri Lanka 74·8 (74·5–75·2) 81·1 (79·6–83·3) 65·6 (65·3–65·9) 73·8 (71·7–76·0) 64·8 (61·8–67·3) 70·6 (67·1–73·9) 58·2 (56·0–60·1) 65·2 (62·2–68·0) Seychelles 75·6 (75·1–76·1) 77·7 (77·0–78·4) 66·1 (65·7–66·5) 70·1 (69·5–70·7) 66·3 (63·5–68·6) 67·9 (65·1–70·4) 59·3 (57·3–61·1) 62·4 (60·1–64·4) Thailand 74·3 (73·8–74·8) 82·0 (80·9–83·1) 67·4 (66·7–68·1) 74·3 (72·9–75·9) 64·9 (62·1–67·2) 71·3 (68·2–74·1) 59·6 (57·4–61·7) 65·7 (63·0–68·3) Timor-Leste 60·7 (58·8–62·9) 73·0 (71·3–74·8) 59·7 (58·0–61·4) 68·8 (67·3–70·7) 52·1 (49·2–55·0) 63·0 (59·8–65·9) 51·3 (48·6–54·0) 59·7 (56·8–62·5) Vietnam 72·7 (71·4–74·3) 79·2 (77·8–80·9) 64·9 (63·5–66·5) 70·0 (68·3–71·2) 63·1 (60·2–66·0) 69·2 (66·2–72·3) 57·8 (55·2–60·2) 62·4 (60·0–64·6) Sub-Saharan Africa 55·7 (55·0–56·3) 66·2 (65·4–67·0) 51·6 (51·0–52·3) 61·7 (60·8–62·4) 47·6 (45·2–49·7) 56·8 (54·1–59·3) 44·8 (42·8–46·7) 53·7 (51·3–55·9) Central sub-Saharan Africa 54·6 (53·4–56·1) 64·4 (62·7–66·0) 50·1 (48·8–51·4) 60·3 (58·7–62·0) 46·0 (43·3–48·3) 54·7 (51·9–57·4) 43·1 (40·7–45·3) 52·1 (49·2–54·7) Angola 50·6 (48·5–52·9) 66·7 (64·5–68·9) 45·5 (43·3–47·6) 61·7 (59·7–64·0) 43·0 (40·1–45·7) 56·8 (53·5–59·8) 39·4 (37·0–41·8) 53·3 (50·3–56·3) Central African Republic 50·1 (48·4–51·8) 54·9 (52·0–58·0) 44·6 (42·9–46·3) 49·1 (46·5–51·7) 42·5 (39·9–44·7) 47·0 (43·7–50·2) 38·5 (36·3–40·8) 42·8 (40·1–45·6) Congo (Brazzaville) 56·2 (54·2–58·1) 62·7 (60·2–65·6) 51·5 (49·4–53·5) 62·6 (60·4–64·8) 48·0 (45·2–50·7) 53·8 (50·7–56·9) 44·6 (42·2–47·2) 54·3 (51·5–57·3) Democratic Republic of the Congo 56·0 (54·1–58·0) 64·3 (62·0–66·7) 51·8 (50·0–53·7) 60·4 (58·2–62·7) 46·9 (43·8–49·7) 54·6 (51·4–57·6) 44·4 (41·8–47·1) 52·0 (48·9–55·2) Equatorial Guinea 50·8 (48·3–53·5) 66·4 (62·6–70·5) 45·6 (43·0–48·3) 64·3 (61·3–67·1) 43·2 (40·3–46·0) 56·9 (53·1–60·8) 39·5 (36·8–42·1) 55·6 (52·3–58·9) Gabon 64·0 (62·3–65·7) 72·1 (69·8–74·4) 56·4 (54·8–58·0) 65·1 (63·3–66·7) 54·3 (51·3–57·2) 61·2 (57·7–64·4) 49·0 (46·5–51·4) 56·6 (53·8–59·1) Eastern sub-Saharan Africa 52·8 (52·3–53·4) 67·4 (66·8–68·1) 48·8 (48·0–49·5) 62·5 (61·7–63·3) 45·7 (43·5–47·5) 58·3 (55·6–60·7) 42·6 (40·8–44·4) 54·9 (52·6–57·0) (Table 1 continues on next page)