The neuroanatomical
expression profile of novel
membrane proteins.
The effect of macronutrients on gene expression.
Author: Jennie Malmberg
Mandator: Uppsala University, Department of Neuroscience, Division of
Pharmacology
Supervisor: Dr. Pawel Olszewski
Examiner at Mälardalen´s University: Sven Hamp
2008-09-29
Abstract:
Worldwide obesity is an increasing problem. Apart from the fact that obesity greatly impairs the health, quality and length of life for the affected individuals, it is also has the potential to become a major socioeconomic problem in a near future. However preventive actions require an understanding of the cause. Before the psychological influence on eating can be evaluated a profound understanding of the biological regulatory system and how this interacts with the food consumed is required. On the assumption that food consumption is regulated by interplay between food and genes, the food itself may influence the genes that regulate consumption, hence change the expression levels of the genes regulating food intake.
To evaluate the interplay between food and gene expression, the project contained several parts, reflecting different aspects of the area of research. The feeding studies had in common that they were initial trials in a larger project. The results of these will be evaluated and used in combination with further studies.
The mice typed for food preference illustrate the complexity of the feeding regulatory system by pointing out the differences between individuals even in a relatively small group of animals. Mice in general like food high in fat and here the animals that showed a preference for sugar also showed a significant increase in their intake of chow. Since chow consists mainly of carbohydrates the results might indicate a preference not for sucrose in particular but for carbohydrates in general. The effect this may have on other studies is still unclear as further studies are needed to determine whether the difference may be the result of an innate genetic difference.
Leucine has been previously shown to reduce the total caloric intake. When given in combination with palatable food the addition of Leucine primarily reduced the intake of chow. From a dietary perspective this would translate to a preference to sweets and fast food at the expense of food with more nutritious content.
The RT-PCR analysis’s gives clues to how the energy regulatory circuitry responds to the intake of selected macronutrients. When it comes to gene expression there is a significant effect of macronutrients on the gene expression levels. The common theme for many of the genes tested seems to be down regulation of satiety signals, as if to support over feeding on palatable diets and in many cases sucrose in particular.
The intake of macronutrients such as sugar or fat has been showed to have an effect on the feeding regulatory circuitry, demonstrated by the change in gene expression levels. The response to said macronutrients is site specific which is clearly shown both by RT-PCR analysis of samples from different parts of the brain, such as the brainstem or hypothalamus, and by immunohistochemistry of selected areas. The
immunohistochemistry also confirms that the novel Oxytocin receptor-antagonist, who is injected IP, actually passes over the blood-brain barrier and has an actual affect on the regions of interest. The areas affected by the antagonist can be visualized and identified through the staining of active sites.
INTRODUCTION ... 1
Background ... 1
Project outline ... 2
Neuronal peptides ... 3
Real Time Polymerase chain reaction ... 4
MATERIAL AND METHODS ... 6
MATERIAL ... 6 Chemicals ... 6 Equipment ... 6 Instruments ... 7 Software ... 7 METHODS ... 8
Experimental and calculations ... 8
Determination of food preference ... 8
The effect of Leucine on the intake of palatable food ... 8
RT-PCR analysis of gene expression in Hypothalamus from Mice ... 8
Extraction of RNA from tissue ... 8
PCR of isolated RNA ... 9 Gel electrophoresis... 10 RNA concentration ... 11 Synthesis of cDNA ... 11 PCR of synthesized cDNA... 12 RT-PCR... 12
RT-PCR analysis of gene expression in arcuate nucleus from rat ... 14
RT-PCR analysis of gene expression in brainstem from rat ... 14
Extraction of RNA from tissue ... 14
Oxytocin activity in the Paraventricular nucleus ... 14
Double staining by immunochemistry ... 14
The effect of an Oxytocin-receptor antagonist ... 15
Immunochemistry ... 15
Behavioural studies ... 16
Determination of food preference ... 16
The effect of Leucine on the intake of palatable food ... 18
Gene expression studies ... 20
RT-PCR analysis of gene expression in HT from Mice ... 20
RT-PCR analysis of gene expression in ARC from rat ... 23
RT-PCR analysis of gene expression in brainstem from rats. ... 24
Activity of Oxytocin ... 27
Oxytocin activity in the PVN ... 27
The effect of an Oxytocin-receptor antagonist ... 28
REFERENCES ... 30
1
INTRODUCTION
Along with basic needs like breathing, sleeping and drinking, the body also needs to maintain its energy homeostasis. This is done by feeding and though the process is governed by a number of complex regulatory systems, our eating behaviour is highly influenced by a multitude of social and psychological patterns. Eating disorders are a growing problem and whether the problem is eating too much or too little, the issue needs to be addressed. The increasing problem of obesity that is spreading across the world has severe consequences including high blood pressure, heart disease, type 2 diabetes, hyperinsulinemia, stroke, reproductive problems and complications of pregnancy.1 If not dealt with this growing health problem will also become a major socioeconomic problem in a near future. Preventive actions require an understanding of the cause and, before the psychological influence on eating can be evaluated a profound understanding of the biological regulatory system and how this interacts with the food consumed is required.
Background
The current view on how the hypothalamus and various peptides collaborate in the neural regulation of food intake is still a work in progress. The lesion studies performed by Heatherington and Ranson showed bilateral electrolytic lesions in the ventromedial hypothalamus of rats to cause hyperphagia and clearly identified the hypothalamus as a part of the system that regulates energy homeostasis. Subsequent studies, where electrical and chemical stimulation of the lateral and ventromedial areas of hypothalamus were preformed, further characterized the regulatory properties of the hypothalamus. Stimulation of the lateral area dramatically increased food intake and conversely, ventromedial hypothalamic stimulation abruptly inhibited food motivated behaviour.2 The role of peptides as satiety factors became apparent following a study where
administration of cholecytstokinin (CCK) to rats before feeding caused a dose-dependent decrease in meal size.3 More recent studies indicate that genes do not only control what we eat but conversely, that what we eat affects the expression of our genes. Woods et al showed that consumption of a diet high in fat alter the homeostatic regulation of energy balance.4 Mercer and Holder showed how sweet foods can cause a release of
β-endorphins in the hypothalamus hence activating the opioid system.5 β-endorphin is a cleavage product of pro-opiomelanocortin (POMC) and has a high affinity for the µ-subtype of opioid receptors, which are the same type of receptors favoured by morphine.6 The overlap between the systems regulating feeding and reward motivated behaviour have been showed by Cota et al and the connection between addiction to drugs and feeding was further explored by Yeomans and Wright. 7, 8 Their study showed an opioid receptor antagonist caused a reduction in consumption of foods preferred by the subjects.
On the assumption that food consumption is regulated by interplay between food and genes, the palatable food in itself may have an influence on the genes that regulate consumption and food high in fat or sugar hence will change the expression levels of genes regulating food intake. As indicated by Welch and Levine the palatability of food seem to have an effect, where the food is high in sucrose or fat. 9 Increased levels of
2 hypothalamic Dynorphin and proDynorphin mRNA levels suggest a palatable induced over consumption of calories.
Project outline
The outline of the project was to study the effects of macronutrients on gene expression. To explore the different aspects of the area of research studies of eating behaviour were performed in combination with studies of gene expression and of Oxytocin activity. The studies are aimed at the effects of palatable diets in general and of the effect on satiety related genes in particular.
The feeding studies were designed to examine the effect of Leucine on the intake of palatable foods and to test food preferences within a group of animals. Studies, on rodents, performed by Cota et al have showed central administration of Leucine to decrease food intake and hence bodyweight.10 This feeding study was the first of several planed to evaluate the effect of Leucine on the intake of palatable foods. The verification of food preferences within the group was a first step toward deciding to which extent food preferences affects consumption and whether the differences in food preference are due to variation in innate gene expression.
Many neuronal peptides, whether related to the regulation of energy homeostasis or not, are produced in response to stress. When the need for the peptide disappears the amount of peptide is down regulated to its previous level. On the other hand when the stressor persists and the concentration of peptide in the system remains at a constantly elevated level this will instead lead to a decrease in the number of receptors associated with the peptide. This since the higher concentration will make the peptide more easily detected and thereby lessen the need for as many receptors. Mice fed palatable diets ad libitum consume a larger amount of food both in terms of volume and calories and with this in mind it would be logical to expect peptides related to satiety to be up regulated in the animals feed the palatable diets.
To explore the effect of macronutrients on gene expression, rodents (rats and mice) were subjected to feeding studies where they were offered either normal laboratory chow or more palatable alternatives (diets high in fat or sugar). The ensuing responses (up or down regulation) in the anorexigenic set of genes tested (appendix 1) were then compared by detecting mRNA levels in hypothalamus and brainstem. Since the taste preferences of different animals vary, as in humans, a feeding study was conducted to divide animals into groups based on preference for fat or sugar and to see whether this preference corresponds to a difference in the total caloric intake.
The rodents were treated with different combinations of chow, intralipid, saccharin or sucrose solution and at the end of each study the animals were sacrificed by decapitation and dissected. The tissue of the hypothalamus (whole or subdivided) and the brainstem were subsequently treated to extract RNA. The detection of gene expression levels were made by Real Time Polymerase Chain Reaction (RT-PCR) on complementary DNA (cDNA) synthesized from the extracted RNA.
3 Areas of the brain affected by a selected peptide can be detected and visualized by
immuno- or in situ treatment of sections. As Oxytocin was one of the satiety related peptides studied further analysis was made in regards to its activity in the paraventricular nucleus (PVN). The activity of Oxytocin in the PVN at the initiation and termination of food intake was detected by double staining. The effect of a novel Oxytocin-receptor antagonist on the feeding related circuitry in the PVN was confirmed by
immunohistochemistry.
Neuronal peptides
The melanocortin system plays a major part in the neuronal control of energy homeostasis by integrating long-term adipostatic signals from leptin and insulin,
primarily received by the hypothalamus, with acute signals regulating hunger and satiety primarily received by the brainstem. The system is also unique from a regulatory point of view in that it is components express both agonists and antagonists of melanocortin receptors. 11
The melanocortin receptor (MC4R) is inhibited by endogenous antagonist agouti
signalling protein and activated by endogenous agonist melanocyte-stimulating hormone (α- and β- MSH). Since the receptor is activated by the α- and β- MSH, which regulate energy homeostasis by reducing food intake and increasing energy expenditure, an up regulation of the expression levels would be expected when the animals were fed an energy dense diet ad libitum. The up regulation of the receptor of the MSH could also be a sign that the expression of the peptide is being suppressed. Suppression of the MSH expression would lower the available concentration of peptide hence creating a need for a higher receptor density.
Cocaine-Amphetamine regulated transcript (CART) is expressed at the same neurons as Proopiomelanocortin (POMC) and results in a strong anorectic effect when stimulated. POMC is a precursor to the melanocyte-stimulating hormones (α- and MSH) and β-endorphin. Since the two peptides have an antagonistic effect, where one (α-and β-MSH) inhibits and the other (β-endorphin) stimulates food intake, the expression levels when fed ad libitum for this short duration of time should show no significant difference as there is no negative energy state nor weight gain to compensate for.
In addition to the two forms of MSH, POMC is also the precursor to adrenocorticotropic hormone (ACTH).12 The release of ACTH is stimulated by the corticotropin releasing hormone (CRH) which is produced in the paraventricular nucleus of the hypothalamus.13 Some studies show Oxytocin to have a dampening effect on the development of tolerance to various addictive drugs (opiates, cocaine and alcohol) and to reduce the withdrawal symptoms.14 Oxytocin also plays a part in the interaction (bonding, love, sexual arousal) between mates.15 Some learning and memory functions are impaired by centrally
administered Oxytocin. More importantly Oxytocin has a role in the control of homeostasis and has satiety related effects by limiting over feeding on agents that are harmful or toxic, as with salt and sugar that can disrupt the body homeostasis in high enough blood concentrations. The release of oxytocin also occurs as a response to severe
4 distension of the stomach, which is important to keep in mind when animals are fed palatable diets ad libitum, hence are given the opportunity to feed unlimited on food with a taste appealing to them.
The obesity gene (FTO) is highly expressed in the feeding-related nuclei of the brainstem and hypothalamus. The expression levels of FTO are highly influenced by feeding and fasting. In addition to this, a strong negative correlation between the expression levels of FTO and an orexigenic galanin-like peptide have been observed by Fredriksson et al supporting the role of FTO as a participant in the regulation of energy homeostasis.16 As seen in the results of this study a significant up-regulation of the gene expression can be observed in the hypothalamus of rats and mice after a short period of food deprivation. Variations in the FTO have been strongly associated with changes in body mass index and obesity. Resent data shows that the gene codes for an enzyme that can act directly on DNA to modify it, which might indicate that FTO has a role in controlling the expression of other genes.17
The orphan sodium- and chloride-dependent neurotransmitter transporters (SLC6A15 and SLC6A17) are part of a subfamily of neurotransmitters responsible for the release, re-uptake and recycling of neurotransmitters at synapses. Many of the transporters derive energy from the co-transport of Na+ and Cl- to facilitate transport of neurotransmitters into the cell against their concentration gradient.18 However the specific function of many of these transporters are still unknown and hence their relation to the transport of hunger and/or satiety regulation peptides is still being explored.
CCK is a peptide hormone that acts as a hunger suppressant within the central nervous system and causes the release of pancreatic exocrine enzymes within the gastrointestinal system19. There has also been documented hunger reducing effects when CCK is
administrated to rats20.
Arginine vasopressin (AVP) is a peptide hormone that regulates the body’s retention of water. When the body is dehydrated AVP cause the kidneys to concentrate the urine ridding the body of salt but not water.12
Real Time Polymerase chain reaction
RT-PCR21 is used to amplify short DNA sequences (100-600 bases). It is highly sensitive and allows for detection of very small samples since it amplifies just the fragment of interest, in this case the messenger RNA (mRNA). As previously mentioned RNA is isolated from the tissue samples and since RNA is a very unstable molecule it could never withstand the high temperature of the PCR. To be able to measure gene expression reverse transcriptase is therefore used to convert mRNA into cDNA for further analysis. In RT-PCR measurements are made regularly during the PCR progress, rather than at the end. Reactions are therefore characterized by the point when amplification of a target is first detected rather than the amount of target accumulated after a fixed number of cycles. The higher the starting copy number of the nucleic acid target, the sooner a significant increase in fluorescence is observed.
5 As in ordinary PCR, RT-PCR entails the use of a pair of primers that are complementary to a defined sequence on each of the two strands. These primers are extended by a DNA polymerase so that a copy is made of the designated sequence. After making this copy, the same primers can be used again, not only to make another copy of the input DNA strand but also of the short copy made in the first round of synthesis which in every cycle leads to logarithmic amplification.
The detection of samples, in RT-PCR is made by integrating the fluorescent probe SYBR-Green22 to each new strain being built. The binding of SYBR-green to DNA is highly specific and results in emission of light of a known wavelength. The intensity of the light is proportional to the amount of DNA and is used to make an estimate of the quantity.
RT-PCR has the advantage of simultaneous measurement of gene expression in many different samples, high reproducibility and fast analysis. However the actual
concentration of mRNA in the isolated RNA samples can vary significantly. To counter effect this imbalance, a set of more stable housekeeping genes is used to calculate
6
MATERIAL AND METHODS
MATERIALChemicals
Agarose D-I Medium EFO, Laboratorios Conda, Cat#8022, Lot#101146
c-Fos (4)-G, Goat Polyclonal IgG, Santa Cruz Biotechnology, Sc-52-G, Lot#L1406 Chloroform, Merck KGaA, Cas#76-66-3
DNA polymerase, Biotools, Ref#10.047
DNase I recombinant RNase-free, Roche, Ref#04716728001, Lot#13413900 EDTA, WMR International, Batch#0503476, Prov#20 244.294
Ethanol 99.7%, Solveco Chemicals AB
Glycerol min. 99%, Sigma Aldrich chemie Gmbh, Cas:56-81-5, Batch#045K0116 Intralipid®Infusionsvätska, Fresenius Kabi, Batch#UM17066
Isopropanol, Solveco Chemicals AB, Batch#6084230
L-Leucine 98%, Sigma-Aldrich chemie Gmbh, Batch#067KI738 Primers (appendix 1)
QuantiFast SYBR®Green PCR Kit, Qiagen GmbH, Cat#204052, Lot#130157172 RevertAid™H Minus First Strand cDNA Synthesis Kit, Fermentas Life Sciences, Cat#K1631, Lot#00017991
RNAlater, Ambion, Cat#AM7021, Lot#0704006
RNeasy® Plus Microkit, Qiagen GmbH, Cat#74034, Lot#130161174 Sodium Chloride, Merck KGaA, Cat#106404.100, Lot#9-472EF34C
Saccharose C12H22O11, VMR International, Ref#27483.363, Lot#07l170050 Triton® X-100, Sigma Aldrich chemie Gmbh, Cas:9002-93-1, Lot#064K0070 Trizma® base, Sigma-Aldrich chemie Gmbh, Lot#69H5420
Trizma® Hydrochloride, Sigma-Aldrich chemie Gmbh, Lot#1305345 TRIzol®Reagent, Invitrogen, Cat#15596-018, Lot#50175114
Tween 1%, Invitrogen, Cat#1219580 Water, MilliQ and DEPC
Vectastrain® ABC Kit, Vectorlaboratories Inc.,
Biotinylated Antirabbit IgG (H+L) BA-1000, Affinity purified, Lot#T0730 Anti-Guinea Pig IgG (H+L) BA-7000, Lot#T0323
Anti-Goat IgG (H+L) BA-5000, Lot#T0530 Equipment
Pipettes
Biohit, 0.5-10, 10-100, 100-1000 µl Biohit Proline, 5-100 µl, SN 5075812 Tips for pipettes
Ordinary 10, 100, 1000 µl Filter 10, 100, 1000 µl Tubes with lid 1.5, 2 ml, Eppendorf PCR Tubes, Axygen Scientific
7 Instruments
Galaxy Mini Centrifuge, VMR International, SN 06101213 Biofuge Fresco, Herareus
MiniSpin, Eppendorf, SN 0036283 RT-PCR, Bio-Rad
PCR, VWR International, SN 1200-10894 Autoclave
Vortex Genie 2, G-560E, Scientific Industries, SN 2-67401 Vibratone Leica VT 1000S, Kat#047235613, SN 1812/10.2004 Nanodrop®ND-1000 spectrometer, NanoDrop Technologies
Software
Microsoft Windows XP Professional (version 5.1.2600) Microsoft Office 2003 (version 11)
Statistical software MINITAB by Minitab Inc. (release 14.20) MyiQ system software by Bio-Rad (version 1.0.410)
8
METHODS
Experimental and calculations
Determination of food preference
Mice were housed in a light:dark cycle of 12 hours (LD 12:12) in a temperature- and humidity-controlled environment (with lights on at 7:00). The mice had a five day period during which they were offered daily the sucrose- and intralipid solution for an hour in addition to their normal diet of chow and water. This was followed by two days of normal chow and water. During the study they were offered either the 10 % sucrose or 5 % intralipid solution, ad libitum, in addition to chow and water and the intake of sucrose, intralipid and chow was monitored on a daily basis.
The effect of Leucine on the intake of palatable food
Mice were housed in LD 12:12 (lights on at 7:00) in a temperature- and
humidity-controlled environment. During the study they were offered a 10% Sucrose solution with or without the addition of Leucine (1.5%) ad libitum for 24 h a day. In addition to the sucrose solution they had constant access to chow and water. They were non native to the sucrose solution and their intake of sucrose or chow was monitored on a daily basis.
RT-PCR analysis of gene expression in Hypothalamus from Mice
Mice were housed in LD 12:12 (lights on at 7:00) in a temperature- and humidity-controlled environment. They had constant access to water and chow pellets. 48 hours prior to decapitation, they were randomly divided into three groups (n=8) and offered ad libitum 10% sucrose or 5% Intralipid solution in addition to the regular diet and water; the control group’s diet was not enriched with sweet or fat tastants. Following the 2-day exposure to their special diets, the animals were sacrificed (11:00-13:00) by decapitation, their brains were excised and the hypothalamus and brainstem were placed in the
RNAlater solution at room temperature for 2 h and then at -20°C until further processing.
Extraction of RNA from tissue
Extraction of RNA from brainstem was made by using TRIzol®. Day 1
Eppendorf tubes were filled with of RNAlater (~500 µl) and weighed. Following
dissection the tubes were weighed again to determine the amount of tissue. The samples were then incubated at room temperature for 2 h and frozen at -80°C.
Day 2
The samples were defrosted and put on ice shortly before they were to be used again. As the samples defrosted new tubes were filled with TRIzol® (200 µl). The tissue was then transferred to the new tubes, without transferring any of the RNAlater, and gently pushed into the TRIzol® to make sure it was completely covered. The tubes were then placed on ice again. Homogenization was made by using an ultra sonic probe, and continuous sonification. Heating of the samples was avoided by restricting each sonification
9 treatment to a maximum of 30 seconds and keeping the samples on ice between
treatments to avoid cross contamination of the samples. The probe was washed with EtOH and water between samples. Following homogenization additional TRIzol® (300 µl) was added to the samples, which were incubated at room temperature for 5 min and frozen at -80°C.
Day 3
As before the samples were defrosted and put on ice shortly before they were to be used again. Chloroform (100 µl per 500 µl TRIzol®) was added to each of the tubes, which were then gently turned for 15 sec and incubated at room temperature for a total of 2-3 min. The samples were centrifuged at 4°C on 13000 rpm for 20 min to separate the homogenate into a solid and liquid phase. The liquid phase, containing the RNA, was then transferred to new tubes and Isopropanol (250 µl per 500 µl TRIzol®) was added to produce floccules of RNA. Again the samples were centrifuged at 4 °C on 13000 rpm for 20 min following which the liquid phases were removed from the samples. The RNA was washed twice. First by adding 70 % room tempered Ethanol (500 µl per 500 µl TRIzol®) to each tube centrifuging at 4°C, >13000 rpm in10 min, and then by repeating the same procedure but with 80 % ice cold Ethanol. The Ethanol was then removed from the tubes by using a fine pipette. The pellets were then set to dry by placing the tubes in the fume hood with the lids open for a maximum of 30 min. After which they were resuspended in 40 µl 1xDNase buffer each.
Day 4
To get rid of any remaining DNA or proteins 2 µl of DNase I was added to each sample. The samples were then incubated at 37°C for 2.5 h following which the enzyme was inactivated by heat treatment at 75°C for 15 min. The samples were then left on ice to cool off and any droplets from condensation was spun down with the tabletop centrifuge.
PCR of isolated RNA
The purity of the isolated RNA was confirmed by PCR amplification and gel electrophoresis.
The proper amount of master mix (recipe below) to make was calculated by adding the number of samples including positive- and negative control plus 2 extra samples. The ingredients, templates and tubes were placed and kept on ice all through the procedure. The ingredients were added to the mix in the order listed in the recipe, vortexed and spun down. 9.5 µl of master mix was dispensed into each PCR-tube and 0.5 µl of template was added to all except the negative control.
10 PCR Mastermix Number of wells 1 Total volume 10 µl MQ-water 6.75 µl 10xBuffert 1.00 µl MgCl (50mM) 0.30 µl Tween (W) 0.25 µl dNTP 0.10 µl Primer mix 1.00 µl Tag Pol 0.10 µl 5 ng/µl template 0.50 µl Gel electrophoresis
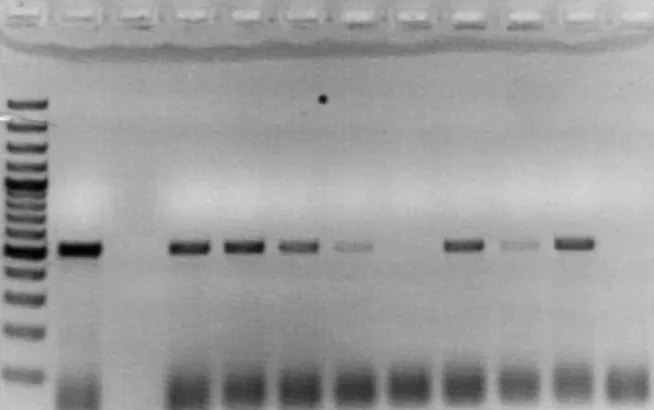
The parts used to cast the gel were washed in ethanol and left to dry while preparing the gel. For the 2% agarose solution dry agarose (4 g) was placed in a glass bottle, 200 ml 1 x TAE was added. The solution was brought to a boil and then carefully simmered until clear. When the gel solution was done Ethidium Bromide (4 µl) was added and the gel was casted. After 30 to 40 min the gel was ready for the samples to be added. Each well was loaded with sample (4 µl) and 6 x DNA dye (1 µl) except the 100 bp ladder which was complete with dye. The gel was then placed in the tray, covered with 1 x TAE and run at 130 V for 30 min. Following which the gel was placed on a UV lit light board and photographed.
Figure 1. Picture of electrophoresis gel showing the result of a successful DNase treatment in
which all the samples failed to produce bands. From left to right was the ladder, positive control, a blank, the eight samples and the negative control.
11 RNA concentration
When the purity of all RNA samples had been confirmed their concentrations was measured using the nanodrop. Concentrations of samples in ng/µg were used to calculate the amount needed to produce the diluted samples containing the amount of RNA (5 µg) needed for the cDNA synthesis.
Ex. Sample 1 had a concentration of 3507,7ng µl = 3,5
µg µl 5µg
3,5µgµl = 1,4 µl of sample and 10,6 µl of water to make 12 µl.
Synthesis of cDNA
8 µl of Master mix (recipe below) was added to each 5 µg/12 µl sample of RNA solution and they were incubated at 37°C for 1 h following which the enzyme was inactivated by heat treatment at 95°C for 15 min. The samples were then left on ice to cool off and any droplets from condensation were spun down with the tabletop centrifuge and the samples were subjected to PCR and electrophoresis (as described for RNA isolation).
cDNA Master mix
Total volume 8 µl 5 x FS Buffer 4,0 µl 0,1 M DDT 2,0 µl 20 mM dNTP 0,5 µl Random Hexamers (diluted 1/6,25 with MQ) 0,5 µl Reverse Transcriptase 1,0 µl
12 PCR of synthesized cDNA
The presence of cDNA in the samples was confirmed by PCR amplification and gel electrophoresis. The procedure for both PCR and electrophoresis was identical to that described for isolation of RNA.
Figure 2. Picture of electrophoresis gel showing the result of the cDNA synthesis. From left to
right was the ladder, the positive control, a blank, the eight samples and the negative control. The fifth sample produced no band indicating that the cDNA synthesis needs to be repeated for that sample. The rest of the samples showed clear visible bands corresponding to the positive control.
RT-PCR
Real Time PCR reactions were performed with a 20 µl reaction mix composed of 5µl cDNA solution and 15 µl Master mix containing a SYBR green probe for detection. The 5 ng/µl solution of cDNA was prepared by diluting appropriate amount of a 100 ng/µl stock solution of cDNA (prepared as described above). Diluted solution (template) is stored at -20C. Template is defrosted at room temperature, mixed properly, spun down carefully and kept on ice.
RT-PCR Mastermix Number of wells 1 Total volume 20 µl MQ-water 9.52 µl 10xBuffert 2.00 µl dNTP 0.20 µl MgCl 1.60 µl Primer up 0.05 µl Primer down 0.05 µl DMSO 1.00 µl SYBR green 0.50 µl Tag Pol 0.08 µl 5 ng/µl template 5.00 µl
13 5 µl of the template was added to each well and all samples were tested in duplicates with water (MQ) used as negative control (as shown in schematics below).
1 2 3 4 5 6 7 8 9 10 11 12
A 1a 1a 2a 2a 3a 3a 4a 4a 5a 5a 6a 6a
B 7a 7a 8a 8a 9a 9a 10a 10a 11a 11a 12a 12a
C 13a 13a 14a 14a 15a 15a 16a 16a 17a 17a 18a 18a D 19a 19a 20a 20a 21a 21a 22a 22a 23a 23a NEG E 1b 1b 2b 2b 3b 3b 4b 4b 5b 5b 6b 6b
F 7b 7b 8b 8b 9b 9b 10b 10b 11b 11b 12b 12b
G 13b 13b 14b 14b 15b 15b 16b 16b 17b 17b 18b 18b H 19b 19b 20b 20b 21b 21b 22b 22b 23b 23b NEG
Figure 3. Example of plate set up for RT-PCR with each sample represented by a number (1-23)
and two different primers named a and b. The plate has eight by twelve wells and depending on the number of samples several primers may be tested at once.
The panels were centrifuged at 400 rpm for about 30 sec before put in the RT-PCR machine.
Primer test
Before new primers were used to run RT-PCR on panels their optimum working
temperature must be determined. This was done by conducting a primer test which were preformed with a 20 µl reaction mix composed of 5µl genomic DNA (gDNA) solution and 15 µl Master Mix (same as for RT-PCR analysis above) containing a SYBR green probe for detection.
1 2 3 4 5 6 7 8 9 10 11 12
A Primer 1 neg Primer 2 neg Primer 3 neg Primer 4 neg B Primer 1 neg Primer 2 neg Primer 3 neg Primer 4 neg C Primer 1 neg Primer 2 neg Primer 3 neg Primer 4 neg D Primer 1 neg Primer 2 neg Primer 3 neg Primer 4 neg E Primer 1 neg Primer 2 neg Primer 3 neg Primer 4 neg F Primer 1 neg Primer 2 neg Primer 3 neg Primer 4 neg G Primer 1 neg Primer 2 neg Primer 3 neg Primer 4 neg H Primer 1 neg Primer 2 neg Primer 3 neg Primer 4 neg
Figure 4. Example of plate set up for primer test on RT-PCR. Each primer requires three by eight
wells and up to four primers can be tested at once.
The analysis was similar to the one for RT-PCR above but with the difference that each row on the plate is set to run at a different temperature. This allows for analysis of the CT-values and melting curves to determine the optimal working temperature for up to four primers at once.
14
RT-PCR analysis of gene expression in arcuate nucleus from rat
Rats were housed in LD 12:12 (lights on at 7:00) in a temperature- and humidity-controlled environment. Ten days prior to decapitation, individually housed rats were subjected to a scheduled feeding regimen: they received food only once per day for one hour (1100-1200). Water was available ad libitum. The animals were randomly divided into four groups and treated to different food paradigms. One group received only chow and the other ones chow in combination with a 10% Sucrose solution, a 5 % Intralipid solution or a 0.1% Saccharin solution. The rats were decapitated 2-4 hours after the end of the meal, their brains were excised, dissected and placed in RNAlater solution at room temperature for 2 h and then at -20°C until further processing.
The extraction of RNA from arcuate nucleus (ARC) was made with the RNeasy® Plus Micro Kit,24 in accordance with manual, following which the treatment of the material was identical to that of the brainstem treatment with TRIZOL® from day 4 and forward.
RT-PCR analysis of gene expression in brainstem from rat
Rats were housed in LD 12:12 (lights on at 7:00) in a temperature- and humidity-controlled environment. Ten days prior to decapitation, individually housed rats were subjected to a scheduled feeding regimen: they received food only once per day for one hour (11:00-12:00). Water was available ad libitum. The animals were randomly divided into two groups, one receiving regular chow, whereas the other chow and a 10% Sucrose solution. The rats were decapitated 2-4 hours after the end of the meal, their brains were excised and the hypothalamus and brainstem were placed in RNAlater solution at room temperature for 2 h and then at -20°C until further processing.
Extraction of RNA from tissue
Extraction of RNA from brainstem was made by using TRIzol® and from ARC by using a RNeasy® Plus Micro Kit in accordance with manual.
The extraction of RNA by the TRIzol® method was preformed as described earlier but with twice the amount (1000 µl) of TRIzol® in proportion to the size of these samples.
Oxytocin activity in the Paraventricular nucleus
Mice were housed in LD 12:12 (lights on at 7:00) in a temperature- and humidity-controlled environment. They had constant access to water. Following a 16 h period of food deprivation the control group was sacrificed (initiation). The rest of the animals were fed standard laboratory chow and after a 60-90 min waiting period they were sacrificed as well (termination).
Double staining by immunochemistry
The brains excised from the mice were placed in a RNAlater-solution and stored in the refrigerator. Using the Vibratone they were then cut into thin (60 µm) slices and portioned out into the wells of a 12-well plate with up to three slices per well.
15 Day 1
All steps, unless stated otherwise, were preformed in room temperature on a rocking table with approximately one ml of fluid per well. In the first step the sections were rinsed in Tris Buffered Saline (TBS) (4 x 10 min) after which they were incubated for 10 min in a mixture of 10% Methanol, 3-4% Hydrogen peroxide and TBS. After the incubation the sections were again rinsed in TBS (4 x 10 min) following which the primary antibody diluted in 1:400 Super mix was added. With the antibody added the sections were transferred to a 4°C incubator and kept over night.
Day 2
The sections were rinsed in TBS (4 x 10 min) after which they were incubated for 1h in the secondary antibody diluted 1:400 in Super mix. Following this the sections were again rinsed in TBS (4 x 10 min), incubated in the ABC solution (1:1:800 Super mix) for 1 h and rinsed again in TBS (4 x 10 min). After this the sections were incubated in DAB with ~20 µl H2O2 for 10 min and rinsed in TBS (4 x 10 min).
- Repeat day 2 but with additional antibody for double staining
The sections were mounted by placing them on glass slides, adding a drop of Glycerol and cover glass. The edges of the cover glass were sealed with translucent varnish and left to dry horizontally. After drying the sections were studied in microscope in which the active cells of affected areas were counted and photographed.
The effect of an Oxytocin-receptor antagonist
Mice were housed in LD 12:12 (lights on at 7:00) in a temperature- and humidity-controlled environment. They had constant access to water. The antagonist was given intraperitoneal (IP) at a dose known to reduce food intake.
Immunochemistry
Sections were treated as described for double staining (above).
TBS (1L)
Trizma HCl 6,06 g Trizma Base 1,39 g NaCl 8,76 g
Dissolve in DEPC water to 1 L.
Super mix
200 ml TBS 0,5 g gelatine 1 ml Triton X-100
Mix all the ingredients and heat to 50-60°C until the gelatine dissolves.
16
RESULTS AND DISCUSSION
There are several parts to the project, such as studies of behaviour, gene expression and oxytocin activity, all of them reflecting different aspects of the area of research.
Behavioural studies
All the feeding studies have in common that they are initial trials in a larger project that will be continued further.
Determination of food preference
The mice typed for food preference demonstrates the complexity of the feeding
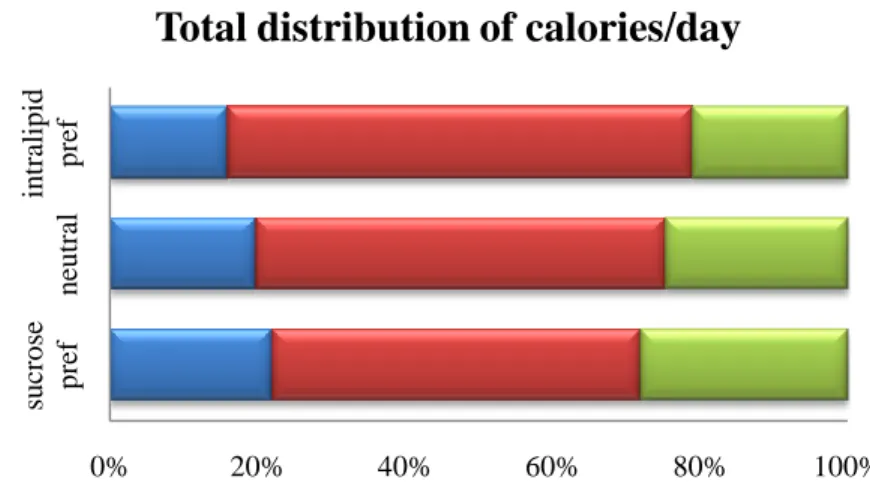
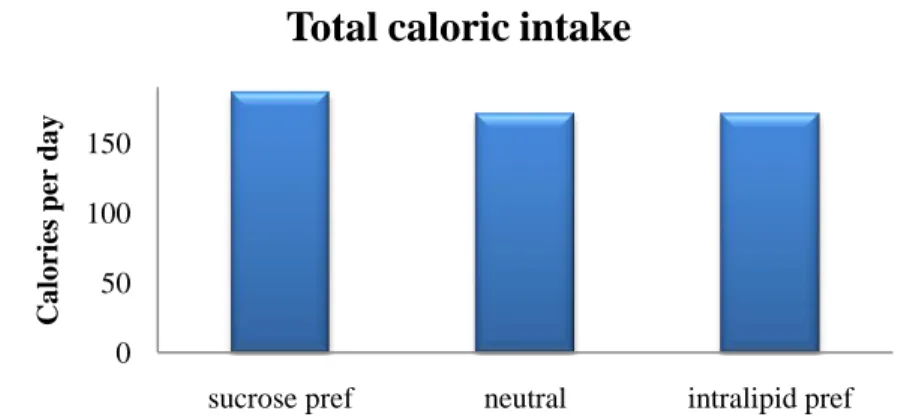
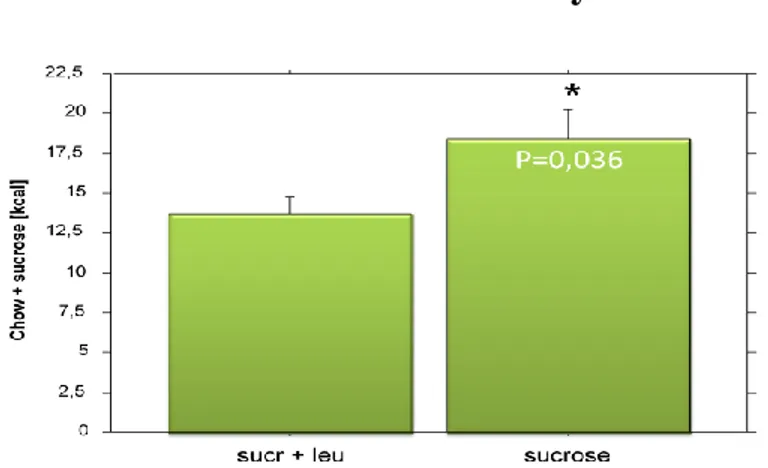
regulatory system by pointing out the difference between individuals even in a relatively small group of animals (Figure 5). Mice in general likes food high in fat which means that even the mice with a more pronounced fondness for sugar still consumed about half of their daily calories as fat (Figure 7). The total caloric intakes were more or less the same in all three groups and show that even in the presence of palatable choices there is no sign of over eating (Figure 6). However the animals that show a preference for sugar also shows a significant increase in their intake of chow (Figure 8). Since chow consists mainly of carbohydrates the results might indicate a preference not for sucrose in particular but for carbohydrates in general. The effect this may have on other studies is still unclear as these animals will be further studied to determine whether the difference is due to an innate genetic difference.
Figure 5. The total distribution of calories per day as Chow (blue), Intralipid (red) and sucrose
(green) shows their preference for fat in general but also the clear shift toward sucrose for the sucrose preferring group.
0% 20% 40% 60% 80% 100% su cr o se p ref n eu tr al in tr alip id p ref
17
Figure 6. The total caloric intake in the groups remains the same which rules out caloric intake
as a factor and confirms that the main factor behind the choice is taste.
Figure 7. A comparison of the calories of Sucrose versus Intralipid consumed within the different
groups.
Figure 8. The clear increase in calories from chow for the group preferring sucrose suggests a
preference not for sucrose in particular but for carbohydrate in general.
0 50 100 150
sucrose pref neutral intralipid pref
Ca lo ries per da y
Total caloric intake
-10% 0% 10% 20% 30% 40% 50% 60%
sucrose pref neutral intralipid pref
Su cr o se v s. Intr a lip id
Comparison of calories comsumed
0% 5% 10% 15% 20% 25%
sucrose pref intralipid pref control
P er ce nta g e o f to ta l ca lo ries/d a y
18 The effect of Leucine on the intake of palatable food
Leucine has been shown to reduce the total caloric intake. However prior studies have been performed with chow as the only choice of food and the food paradigm presented here was part of a larger set designed to evaluate the effect of Leucine on the caloric intake when presented with both chow and a more palatable choice, such as sugar. In this case the addition of Leucine did not have an effect on the intake of sugar as this was still the same in both groups (Figure 9). However the total caloric intake was significantly lower in the group fed Leucine as a supplement (Figure 10). This was accomplished by reducing the intake of chow (Figure 11). From a dietary perspective this would translate to a food supplement that would let you continue eating sweets and fast food while suppressing your taste for food with a more nutritious content. Hence you would lose the weight but most likely get quite malnourished in the process. This study will continue with the same basic layout but to evaluate the effect when the choice of palatable food is instead high in fat or when there is a larger choice of foods available.
Total intake of sucrose/day
Figure 9. The total intake of sucrose was the same in both the group receiving sucrose with
Leucine as for the group receiving only sucrose.
Total caloric intake/day
19
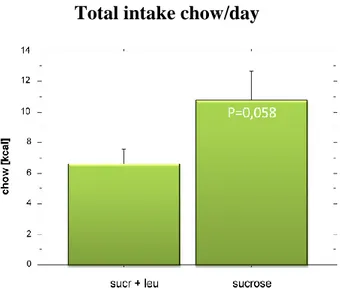
Total intake chow/day
Figure 11. The difference in the intake of chow is not significant but shows a definite decrease
20
Gene expression studies
The RT-PCR analysis’s gives clues to how the energy regulatory circuitry responds to the intake of selected macronutrients. When it comes to gene expression there is a visible effect of macronutrients on the gene expression levels. The common theme for many of the genes tested seems to be down regulation of satiety signals as if to support over feeding on palatable diets and in many cases sucrose in particular.
RT-PCR analysis of gene expression in HT from Mice
The two peptides CART and POMC are expressed at the same neurons but POMC is also the precursor to two antagonistic peptides. One of the peptides (α-and β-MSH) has an inhibiting effect while the other (β-endorphin) stimulate food intake. The expression levels when fed ad libitum for this short duration of time should thereby show no significant difference as there is no negative energy state nor weight gain to compensate for. This is demonstrated by the lack of significant differences between the Intralipid-, Sucrose- and control group for both CART and POMC (Figure 12).
A B
Figure 12. There is no significant difference in either CART (A) or POMC (B) which is to be
expected since there is neither negative energy state nor weight gain to compensate for.
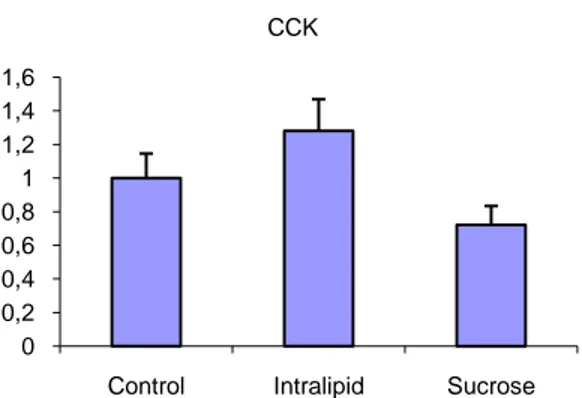
CCK is responsible for stimulating digestion of fat and as a neuropeptide mediates satiety. With its role in the digestion of fat the slight up regulation of the expression levels is not surprising neither significant compared to the group fed sucrose or to the control group (Figure 13).
0 0,5 1 1,5 2 2,5
Control Intralipid Sucrose CART 0 0,5 1 1,5 2
Control Intralipid Sucrose POMC
21
Figure 13. With its role in the digestion of fat the slight up regulation of the expression levels for
Cholecystokinin (CCK) is neither surprising nor significant compared to the group fed sucrose or to the control group.
With CRH the Intralipid solution actually seems to increase gene expression levels, as expected. As these animals are fed ad libitum the expression of CRH, which is a fast acting satiety peptide, should be up regulated since they are allowed to eat as much as they can. For the group fed a high sucrose diet this is not the case but here the expression of CRH is significantly down regulated (Figure 14).
Figure 14. Corticotropin releasing hormone (CRH) is a fast regulation satiety signal and up
regulation in response to feeding ad libitum is normal. The down regulation of the expression in the group fed sucrose could be an indication that sucrose suppresses satiety response.
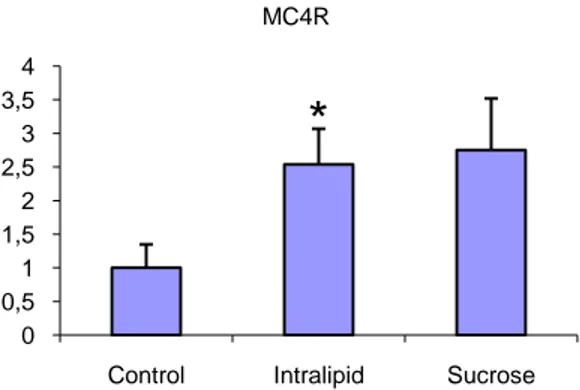
For Oxytocin the result of a high sucrose diet seem to be suppression of satiety signals, which shows as a significant down regulation of the gene expression vs. the control group (Figure 15). The trend continues with MC4R where the up regulation for both the treated groups indicate low levels of the peptide which in turn could be a sign of a suppression of the satiety signals when fed a palatable diet, again as if to support over eating (Figure 16).
0 0,2 0,4 0,6 0,8 1 1,2 1,4 1,6
Control Intralipid Sucrose CCK 0 0,5 1 1,5 2 2,5
Control Intralipid Sucrose CRH
22
Figure 15. In the case of Oxytocin a significant down regulation of the gene expression vs. the
control group can be observed, which could be an indication that a high sucrose diet suppress the satiety signals (as if to support over feeding on sucrose).
Figure 16. The up regulation of the Melanocortin receptor (MC4R) could indicate a lower
concentration of the peptide as if to suppress satiety and support over feeding on a palatable diet.
AVP is a peptide hormone that regulates the body’s retention of water. When the body is dehydrated AVP cause the kidneys to concentrate the urine ridding the body of salt but not water. Since all the animals had constant access to water dehydration would not be a factor and the expression level of AVP would be the same for all the groups, which is confirmed by the RT-PCR results (Figure 17).
Figure 17. Since all the animals had constant access to water dehydration would not be a factor
and the expression level of AVP would be the same for all the groups, which is confirmed by the RT-PCR results. 0 0,2 0,4 0,6 0,8 1 1,2 1,4 1,6
Control Intralipid Sucrose
Oxytocin
*
0 0,5 1 1,5 2 2,5 3 3,5 4Control Intralipid Sucrose MC4R
*
0 0,2 0,4 0,6 0,8 1 1,2 1,4 1,6Control Intralipid Sucrose AVP
23 RT-PCR analysis of gene expression in ARC from rat
As earlier the antagonistic effect of the two peptides derived from POMC is demonstrated by the lack of significant differences between intralipid-, sucrose-, saccharin- and control group (Figure 18).
Figure 18. The antagonistic effect of the two peptides derived from POMC is demonstrated by the
lack of significant differences between intralipid-, sucrose-, saccharin- and control group.
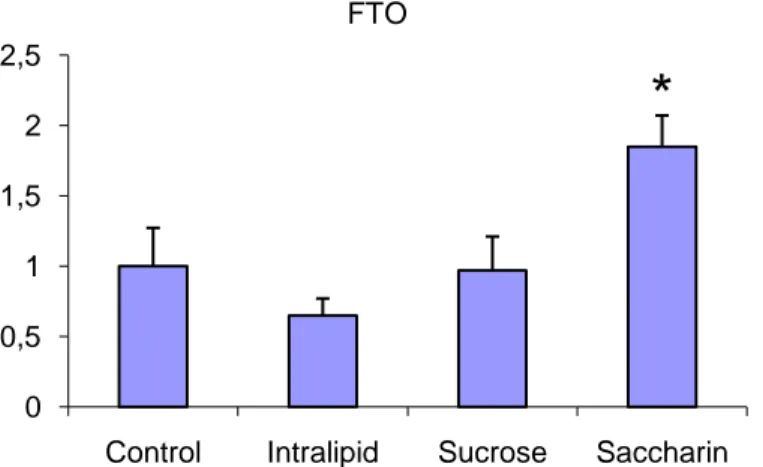
For the genes tested whose functions are more or less unknown, one that stands out is FTO. The fact that the expression of FTO changes when the subjects are treated to different food paradigms suggests a connection to the feeding regulatory circuitry. In this particular study though there is a significant up regulation in the group fed Saccharin (Figure 19). As Saccharin has no caloric or nutritional value this is interesting. Whether the observed up regulation is due to an antagonistic effect of Saccharin on satiety signals, or related to a difference in the taste of Saccharin compared to sucrose, requires further studies to determine.
Figure 19. A significant up regulation of the FTO can be seen for the group fed Saccharin. As
Saccharin 0 0,5 1 1,5 2
Control Intralipid Sucrose Saccharin
POMC 0 0,5 1 1,5 2 2,5
Control Intralipid Sucrose Saccharin
FTO
24 RT-PCR analysis of gene expression in brainstem from rats.
In line with previous results the expression levels of CART tend to be stable between the groups, regardless of food paradigm (Figure 20) and just as before there is no visible difference in the expression levels of CRH (Figure 21). For CRH there should be a difference as CRH is a satiety mediating peptide and the rats are fed ad libitum, hence should feel full. But as seen earlier it seems a diet high in sucrose seem to suppress the expression of CRH as if to support over feeding on sucrose.
Figure 20. As earlier there is no significant difference between the two groups of the study.
Figure 21. Corticotropin releasing hormone (CRH) is a fast regulation satiety signal and up
regulation in response to feeding ad libitum is normal. The down regulation of the expression in the group fed sucrose could be an indication that sucrose suppresses satiety response.
-0,1 0,1 0,3 0,5 0,7 0,9 1,1 1,3 1,5 Control Sucrose CART -0,1 0,1 0,3 0,5 0,7 0,9 1,1 1,3 1,5 Control Sucrose CRH
25
Figure 22. The indifference between the receptor levels in the two groups might indicate sucrose
to have a dampening effect on the satiety signals (as if to support over feeding on an energy dense, palatable diet).
Again a significant change can be seen in the group fed a more palatable diet. On the contrary to the satiety related peptides there is a significant down regulation in the group fed Sucrose (Figure 23). Considering the negative correlation between the expression levels of FTO and orexigenic peptides observed by Fredriksson et al.16 the significant down regulation of FTO in the group fed sucrose vs. the control could indicate a corresponding up regulation of orexigenic peptides (as if to support over feeding on sucrose). However the actual function and regulation of FTO remains uncharted.
Figure 23. A significant down regulation of FTO in the group fed sucrose vs. the control can be
observed and could indicate a corresponding up regulation of orexigenic peptides (as if to support over feeding on sucrose).
-0,1 0,1 0,3 0,5 0,7 0,9 1,1 1,3 1,5 Control Sucrose MC4R -0,1 0,1 0,3 0,5 0,7 0,9 1,1 1,3 1,5 Control Sucrose FTO
*
26
A B
Figure 24. SLC6A15 and SLC6A17 are amino acid transporters and the significant down
regulation of SLC6A17 of animals subjected to the high sucrose diet suggest that it might be entwined to the control of energy homeostasis.
0 0,5 1 1,5 Control Sucrose SLC6A15 0 0,5 1 1,5 Control Sucrose SLC6A17
*
27
Activity of Oxytocin
Oxytocin activity in the PVN
To show the activity of Oxytocin as a satiety mediating peptide double staining (c-FOS and Oxytocin) was performed. By staining sections taken from animals at the initiation and termination of the meal the location and difference in activity was made visible (Figure 25). The level of activity was 4,7 % (+/- 2.9) at the initiation compared to 12,3 % (+/- 4.5) at the end of the meal.
A B
Figure 25. Double staining of active cells shows the increase in Oxytocin levels from initiation of
meal (A) to termination of meal (B) as a response to feeding. Active cells are stained as brown (light arrows) and nuclei containing Oxytocin are stained black (dark arrows). Staining of the nuclei can be seen in the enlarged cut in (B).
28 The effect of an Oxytocin-receptor antagonist
The Oxytoxin-receptor antagonist used was a novel antagonist and the staining confirms that the antagonist, who is injected IP, actually passes over the blood-brain barrier and has an affect on the regions of interest (Figure 26). The areas affected by the novel antagonist can be visualized and identified through the staining of active sites (Figure 27).
Figure 26. Activity is induced by injection of Oxytocin receptor antagonist and as the active cells
are stained black the difference between the untreated animal (A) vs. treated (B) is visible and distinct.
29
Effect of OT-R antagonist IP injection
MPOA – medial preoptic area
PVN – paraventricular nucleus
SON – supraoptic nucleus
ARC – arcuate nucleus
CoA – central nucleus of the
amygdala
DMH – dorsomedial nucleus
VMH – ventromedial nucleus
NTS – nuclei of the solitary tract
AP – area postrema
DMNV – dorsal motor nucleus of
the vagus
Figure 27. The effect of the Oxytocin receptor antagonist at different sites is determined by how
many active nuclei can be detected. The effect on the treated animals (red) versus the untreated (blue) is apparent and in many cases significant.
To sum up the results it has been shown the intake of macronutrients such as sugar or fat has a significant effect on the feeding regulatory circuitry. This is evident from the change in gene expression levels detected by RT-PCR. To which extent however still needs further studies to determine.
One can also state that the response to said macronutrients is site specific. This is clearly shown both by the RT-PCR analysis of samples from different parts of the brain, and by the staining of sections from different areas.
It was confirmed that the novel Oxytocin-antagonist passes the blood-brain barrier and that it acts through the central circuitry. The areas affected were visualized and charted by staining sections from different parts of the brain.
30
REFERENCES
1. Lang, T. Obesity: a growing issue for European policy? Journal of European Social Policy 15, 301-327 (2005).
2. Hoebel, B.G. Hypothalamic Lesions by Electrocauterization:
Disinhibition of Feeding and Self-Stimulation. Science 149, 452-453 (1965).
3. Gibbs, J., Young, R.C. & Smith, G.P. Cholecystokinin decreases food intake in rats. J Comp Physiol Psychol 84, 488-495 (1973).
4. Woods, S.C. et al. Consumption of a high-fat diet alters the homeostatic regulation of energy balance. Physiol Behav 83, 573-578 (2004).
5. Mercer, M.E. & Holder, M.D. Food cravings, endogenous opioid peptides, and food intake: a review. Appetite 29, 325-352 (1997).
6. Corbett, A.D., Henderson, G., McKnight, A.T. & Paterson, S.J. 75 years of opioid research: the exciting but vain quest for the Holy Grail. Br J Pharmacol 147 Suppl 1, S153-162 (2006).
7. Cota, D. et al. Endogenous cannabinoid system as a modulator of food intake. Int J Obes Relat Metab Disord 27, 289-301 (2003).
8. Yeomans, M.R. & Wright, P. Lower pleasantness of palatable foods in nalmefene-treated human volunteers. Appetite 16, 249-259 (1991). 9. Welch, C.C., Kim, E.M., Grace, M.K., Billington, C.J. & Levine, A.S.
Palatability-induced hyperphagia increases hypothalamic Dynorphin peptide and mRNA levels. Brain Res 721, 126-131 (1996).
10. Cota, D. et al. Hypothalamic mTOR signaling regulates food intake. Science 312, 927-930 (2006).
11. Gao, Q. & Horvath, T.L. Neurobiology of feeding and energy expenditure. Annu Rev Neurosci 30, 367-398 (2007).
12. Kimball, J.W., Vol. 2008 (Harvard University, Cambridge; 2007). 13. Kimball, J.W., Vol. 2008 (Harvard University, Cambridge; 2007). 14. Kovacs, G.L., Sarnyai, Z. & Szabo, G. Oxytocin and addiction: a review.
Psychoneuroendocrinology 23, 945-962 (1998).
15. Kosfeld, M., Heinrichs, M., Zak, P.J., Fischbacher, U. & Fehr, E. Oxytocin increases trust in humans. Nature 435, 673-676 (2005).
16. Fredriksson, R. et al. The obesity gene, FTO, is of ancient origin, up-regulated during food deprivation and expressed in neurons of feeding-related nuclei of the brain. Endocrinology 149, 2062-2071 (2008). 17. Gerken, T. et al. The obesity-associated FTO gene encodes a
2-oxoglutarate-dependent nucleic acid demethylase. Science 318, 1469-1472 (2007).
18. Group, G.B., Vol. 2008 (Center for Biomolecular Science and Engineering, University of California Santa Cruz; 2008).
19. Medicine, U.N.L.o., Vol. 2008 (National Institutes of Health, Bethesda; 2008).
31 20. Fink, H., Rex, A., Voits, M. & Voigt, J.P. Major biological actions of CCK--a
critical evaluation of research findings. Exp Brain Res 123, 77-83 (1998).
21. Hunt, D.M., Vol. 2008 (University of South Carolina School of Medicine, Columbia; 2006).
22. AB, Q., Vol. 2008 Real Time PCR (QIAGEN AB, Solna; 2008).
23. Vandesompele, J. et al. Accurate normalization of real-time quantitative RT-PCR data by geometric averaging of multiple internal control genes. Genome Biol 3, RESEARCH0034 (2002).
32
Appendix 1 – Table of primers with forward and reverse sequences.
Primer Forward Reverse
AVP gctcaacactacgctctc cttgggcagttctggaag AVP tgctcaacactacgctctctg cctcctcttgggcagttctg
bAct HKG (mouse) ccttcttgggtatggaatcctgtg cagcactgtgttggcatagagg bAct HKG (rat) cactgccgcatcctcttcct aaccgctcattgccgatagtg bTUB HKG (rat) cggaaggaggcggagagc agggtgcccatgccagagc CART acgcattccgatctacgag ttcacaagcacttcaagagg CART tgcttgtgaaggggtgacagc ttaaagcggctccagggacaa
CCK cttggaggaggtggaatgag cgtgacagatttcacattggg CRH gttgagaaactgaagagaaaggg actgttgttctgcgaggtac CRH taccaagggaggagaagagag ggacgacagagccaccag Cyclo HKG (mouse) tttgggaaggtgaaagaagg acagaaggaatggtttgatgg Cyclo HKG (rat) gagcgttttgggtccaggaat aatgcccgcaagtcaaagaaa
FTO aacaccaggctcttcacc cacttcatcatcgcaggac FTO ggctgcttgtttcgggacg tacactgccacggctgacc FTO gatgtcagagcgtcagagag aaggtcatggagtgagtgc GAPDH HKG (mouse) gccttccgtgttcctacc gcctgcttcaccaccttc GAPDH HKG (rat) acatgccgcctggagaaacct gcccaggatgccctttagtgg
H3b HKG (mouse) ccttgtgggtctgtttga cagttggatgtccttggg H3b HKG (rat) attcgcaagctcccctttcag tggaagcgcaggtctgttttg MC4R tggcgaggcttcacattaaga caaggtaattgcgcccttca MC4R cgctccagtaccataacatc gaagaggacgcctgacac OXY acgctgcttcggaccaag gcgaaggcaggtagttctcc OXY cccatcttctatccttgtcctg gaatcgtctttattgccatttacc OXY cggtggatctcggactgaac tagcaggcggaggtcagag
POMC tgggtcacttccgctggg tcctccgcacgcctctg
POMC gaacgccatcatcaagaac ctaagaggctagaggtcatc RPL19 HKG (mouse) aatcgccaatgccaactc ggaatggacagtcacagg RPL19 HKG (rat) tcgccaatgccaactctcgtc agcccgggaatggacagtcac
SDCA HKG (rat) gggagtgccgtggtgtcattg ttcgcccatagcccccagtag SLC6A15 gcatcggaagaatttctgagc agcgacgaatgatgaacacc SLC6A15 tgcatggatcaaggagaaggc gcgacgaatgaaaacgactgg SLC6A17 ccttcatcaacttcttcacctc cgaccacacacttctcattc SLC6A17 tggagcagcagaagcc gcagcctctgaagatttattg