School of Innovation, Design and Engineering
Inventory Management from
an aftermarket perspective
Master thesis
30 credits, Advanced level
Product and Process DevelopmentProduction and Logistics
Carolina Cardona
III
A
BSTRACT
This master thesis has been written on behalf of ABB Operation Center SE in Västerås. It is the last step of the master program in engineering - Innovation, Production and Logistics, at Mälardalen University, Eskilstuna.
ABB is an industrial company and a global leader in power and automation technologies and the role of ABB Operation Center is to provide aftermarket products and services all over the world. They offer spare parts, reparations, upgrades and exchange units for a large part of the products that ABB have.
With an overall knowledge and experience they provide solutions with availability and speed as their catchwords. Together with other ABB units and customers they develop the future aftermarket concept for industries all over the world. This is not an easy task since they handle articles that have a large range and the demand for service is high but the volumes are small and uncertain.
The purpose of this thesis is to find a strategy, or several strategies, in order to improve an inventory management that handles aftermarket articles. These strategies are built on four research questions.
In this thesis the authors, that are master students at Mälardalen University, have come up with suggestions for inventory management through four steps; planning, theoretical framework, benchmarking and analysis.
The research questions, structured in the planning step, are followed up in each chapter of the report. The data was collected and analyzed and the most useful information is presented in the theory, which is the base of this thesis, with focus on inventory management and
aftermarket.
A benchmarking has also been done at four other companies that handle aftermarket. Here questions concerning the areas where ABB has issues were asked and answered. The
information from the benchmarking together with the theoretical framework has formed to a suggestion of how ABB Operation Center SE should structure their work in order to manage their inventory in better way.
V
A
CKNOWLEDGEMENT
This master thesis is the final part of the master program in engineering - Innovation, Production and Logistics, at Mälardalen University, Eskilstuna. It has been executed and written on behalf of ABB Operation Center SE in Västerås.
It has given us the knowledge and experience approaching inventory management issues and helped us understand the process, method and tools that can be applied when performing a scientific report.
We would like to thank Dennis Andersson at ABB Process Automation and Nils-Erik Jonsson at ABB Operation Center SE for the information and support. We would also like to thank Antti Salonen at Mälardalen University for all the support and encouragement and Stig- Arne Mattsson for the discussion and information.
Finally we would like to thank all involved in this master thesis, both the benchmarking companies and the employees at ABB Operation center who has given us their time and shared their information and knowledge with us.
Carolina Cardona and Lovisa Karlsson Västerås 2013
VII
D
ICTIONARY
ABB OC SE ABB Operation Center Sweden
BD Business Development
BI Business Items at Alfa Laval
CLT Customer lead time
CSN The warehouse for ABB OC SE that are handling the aftermarket articles
DC Distribution Center
EOQ Economic Order Quantity
ERP- system Enterprise Resource Planning- System
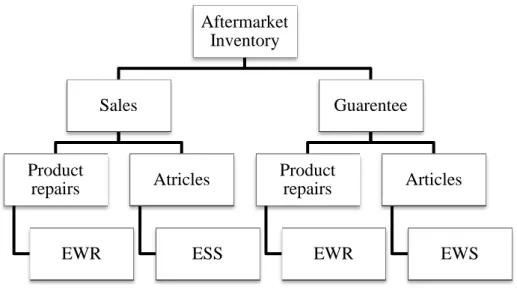
EWR Eldivision, Warranty and Repair
EWS Eldivision, Warranty and Spares
GDE Geotechnical Drilling Equipment
HF High Frequency
II Inventory Items
Kanban Produce to order, no inventory
LF Low Frequency
LLT Logistic lead time
LTC Least Total Cost
MF Medium Frequency
MRS Mining and Rock service
NI Non-stocked Item at Alfa Laval
OD Operational Development
OI Order bound Items
OTD On-time-delivery
R&D Research and Development
RI Requested Items at Alfa Laval
SAC1 Designation for inventory items at Atlas Copco SAC3 Designation for order bound items at Atlas Copco
VIII
SDE Surface Drilling Equipment
SI Stocked items at Alfa Laval
URE Underground Rock Excavation
IX
C
ONTENTS
Abstract ... III Acknowledgement ... V Dictionary ... VII 1. Introduction ... 1 1.1. Background ... 1 1.2. Problem Formulation ... 11.3. Aim And Research Questions ... 2
1.4. Project Limitations ... 2 2. Method ... 3 2.1. Methodology ... 3 2.2. Work process ... 4 2.3. Data collection ... 6 2.4. Analysis ... 8
2.5. Reliability and validity ... 9
3. Theory ... 11
3.1. Logistic ... 11
3.2. What is aftermarket? ... 12
3.3. Inventory Management ... 15
4. Empirics ... 39
4.1. Current State (Mapping of ABB) ... 39
4.2. Benchmarking ... 44
5. Analysis And Discussion ... 55
5.1. Methods to decide whether to have stocked- or order bound items ... 55
5.2. Order Point Systems ... 57
5.3. Methods to decide order quantity ... 60
5.4. Dimensioning safety stock ... 63
6. Result ... 66
6.1. Methods do decide whether to have stocked- or order bound items ... 66
6.2. Order point systems ... 67
6.3. Methods to decide order quantity ... 68
X 7. Conclusion ... 70 8. References ... 71 8.1. Books ... 71 8.2. Articles ... 72 8.3. Internet ... 73 8.4. Oral ... 74 9. Appendices ... 75 9.1. Interview questions ... 75
9.2. Complementing interview questions ... 77
9.3. Purchasing Strategy ABB OC SE, 2011 (Formerly Logistic Center) ... 78
9.4. Life Cycle (ABB- Document) ... 84
TABLE OF FIGURES
Figure 1 The developed method of the work process based on DMAIC ... 5Figure 2 (Lumsden, 2012) ... 12
Figure 3 (Lumsden, 2012) ... 22
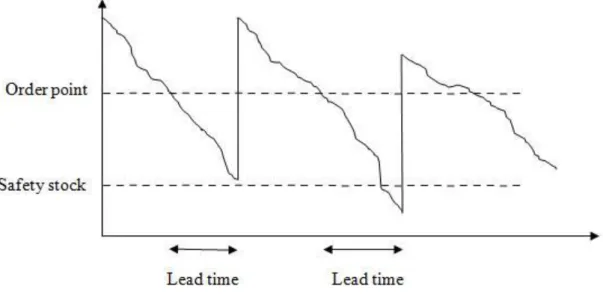
Figure 4 Basic principle of order point system (Mattsson and Jonsson, 2003) ... 23
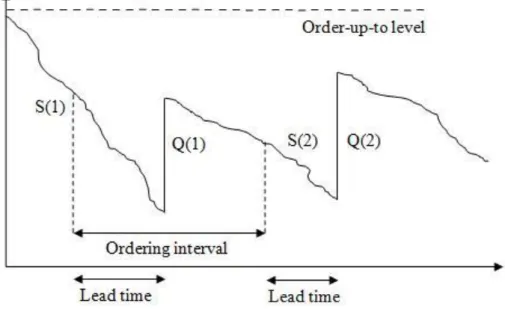
Figure 5 Basic principle of consumable replacement systems (Mattsson and Jonsson, 2003) 25 Figure 6 Two bin system (Mattsson. 2010d) ... 27
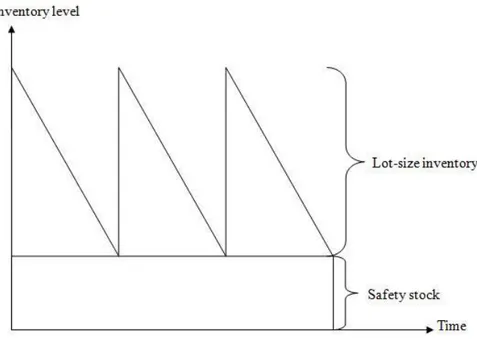
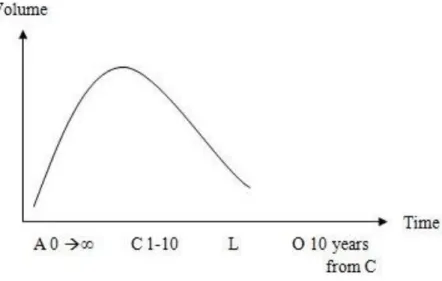
Figure 7 A principle appearance of a safety stock (Aronsson, Ekdahl and Oskarsson, 2004) 34 Figure 8 The articles lifecycle ... 42
1
1. I
NTRODUCTION
This report presents a master thesis performed in the academy of Innovation, Design and Technique at Mälardalen University in Eskilstuna on behalf of ABB Operation Center Sweden in Västerås. The master thesis is a part of an engineering degree within the program
Innovation, Production and Logistics.
1.1. B
ACKGROUNDLogistic is something that every person is in contact with almost every day and something that is a big part of almost all organizations worldwide. With logistic comes several sub-areas, for example transport, production and aftermarket, all in which inventory is a key factor.
It is important to know that although inventory is important to have it still costs a lot of money. Therefore it is necessary to keep the inventory in balance and to only have what is absolutely necessary. Since it costs a lot of money, the company does not want to have components or articles in stock that has a very little or no turnover at all. Still the company does not want to be without a component or article when it is needed all of a sudden. This could cost the company even more in some cases and result in long lead times. In order to get this right, keep the costs as low as possible and offer short lead times to the customers,
effective inventory management is the right area to work with. Models and methods to get the balance with inventory right are already available on the market and shows good results but the real problems occur when it comes to the aftermarket.
Companies want to decrease the cost of their inventory even for the aftermarket. The quality of products and components are increasing meaning that the product and components lifetime are getting longer. Due to this the guarantee-time will get longer and the company is forced to supply the costumers with spare parts for a much longer time. Because of this the pressure on the aftermarket will increase.
In order to manage the aftermarket there are several factors to take into account. There is a large product range and the demand on service is high but the volumes are very small and uncertain. Normally, in order to control the inventory, companies usually use a forecast based on history but when it comes to aftermarket this is difficult to do.
At ABB Operation Center, they manage the aftermarket for products which have the exact same properties; the components have a large range, the demand for service is high but the volumes are small and uncertain which means that they have difficulties when it comes to controlling their inventory.
1.2. P
ROBLEMF
ORMULATIONIn order to stay on top of their game and still be the leaders within power and automation technologies, ABB also has to be a leader when it comes to the aftermarket and all that this includes, both products and services. A problem that almost every company stands before when it comes to the aftermarket is the fact that the volumes are very uncertain. When a customer needs something from the company, they want to be able to give it to them as fast as possible in order to keep them satisfied and happy. At the same time it costs to have articles in stock. This is where the company needs to find the right balance.
ABB Operation Center are working with these kind of issues all the time but when the company does the same thing day in and day out it can be difficult to find improvements. Therefore they need help to find solutions on how they should manage their inventory of aftermarket components in order to minimize the costs and satisfy their customers.
2
How does a company organize their work when the components have a large range, the demand for service is high but the volumes are small and uncertain?
1.3. A
IMA
NDR
ESEARCHQ
UESTIONSThe aim of this thesis is to study and present proposals for solutions on how ABB Operation Center Sweden (ABB OC SE) can manage/control their inventory. The aim also includes to present strategies, so that ABB OC SE are able to reach a structured and standardized way of managing their aftermarket inventory. This is an important aspect when it comes to the aftermarket since the demand is very varied and it is hard to control the inventory in such a way that the company keep the costs down while meeting the customers demand, concerning lead times and on-time-delivery (OTD).
These are the research questions that concerns inventory management:
How does a company decide if the items should be stocked or order bound? What systems are there to decide the order point?
How does a company decide the order quantity? Dimension of safety stock
In order to manage and control the inventory completely there are two other aspects to examine; where should the warehouse be located and how does a company handle the scrapping process? The reason why these research questions are not included in this thesis is described in 1.4. Project Limitations.
1.4. P
ROJECTL
IMITATIONSThe project will mainly focus on the purchase aspect of the process but in some ways other departments will also be included, such as order and quote.
Since where the warehouse location cannot be affected and since it is not relevant, that question will not be handled in this report. Due to the time issue there is no time to handle every question and because of this the decision is to not include the scrapping.
If time remains a case study on one- or a few components will be done where management solutions for specific components will be shown.
3
2. M
ETHOD
There are several methods to use when performing a scientific research, in this case a master thesis. In this chapter the methods used in this specific thesis are described.
2.1. M
ETHODOLOGYA methodology works as a form of guideline in order to solve a problem. The methodology usually contains different steps such as phases, tasks, methods and techniques.
2.1.1. QUALITATIVE AND QUANTITATIVE METHOD
Qualitative and quantitative methods aim to the generation-, process- and analyze choices. Within the quantitative method the research includes measurements from data collections and statistics process- and analyzes methods. The qualitative method is about research form a data collection that focuses on the soft values, such as qualitative interviews and interpreted
analysis. [Patel and Davidson, 2011] 2.1.1.1. Qualitative Method The three phases
First comes the planning phase that has two important steps; the first one is to formulate a question. The second step is to formulate how the interview should be executed. After the planning phase the collection phase comes where the demand of expertise is needed when information should be found. The last phase is the analysis phase; this is where the collected information is analyzed and results with a theory chapter. [Hartman, 2004]
Ely (1993) describes five steps that should be performed in a qualitative method. Those steps are: the beginning (what is important in qualitative method), the implementation (how to use the tools in a qualitative way), the feeling (the individual aspect), the interpretation (the analysis) and reflect.
In the beginning it is important to find those questions that are interesting on a personal level and from this the research questions are formulated. That is a qualitative work, to base their research on something that is interesting on a personal level and then find the right research questions from that. One of the qualitative methods is that the research questions are
developed under the study´s time. In a qualitative method there should be questions to answer before the study starts, they are often broad. The acceptance of the questions variability is both a problem and a positive factor in qualitative research. [Ely, 1993]
When it is time for the implementation phase it is time to start observe. The easiest way to observe is to collect fact with the ears. One of the first things to reflect over when it is time to observe is what kind of observer role that are suitable for the area should be taken. Should it be an active-, privileged- or restricted observer? The active observer has a work to perform after the research. The privileged observer is a person that can be trusted and finds it easy to collect information and the restricted observer (the most used) asks questions and builds a trust during the studies time. Which role should be chosen depends on the opportunities that the context allows. [Ely, 1993]
The feeling step is about all feelings that can occur within a person when a qualitative
research is done. As a qualitative researcher the individual point of view is an important factor and this can be both positive and negative. It is common that the researcher experiences unexpected feelings, chaotic or disturbing. [Ely, 1993]
4
Interpretation or analyze is to find one or more ways to come up with the result. Before this step is reached some decisions about factual analysis have been done, many of the decisions are affected by the qualitative research that drives the study forward. Regardless which analyze method that is used it is important to clarify that a result should be reached through this study so that the reader will understand it early in the analyze part. [Ely, 1993]
The last step, the reflection step handles the experience that has occurred from the study. Help to analyze what new knowledge is found and what to bring to future studies. [Ely, 1993]
2.1.1.2. Quantitative Method
Quantitative methods are very helpful when a structure should be reached in the data that are collected. It is not only for an individual overview of what has happen but it is also helpful for the ones who will take part of the information. The information could be complex and the quantitative methods help to get the complex information understandable in an efficient way. To find a structure in the information and to analyze the connection between different
phenomena can be difficult and take a lot of time. The questions that are formulated from the beginning usually change under the works progress, they are rejected, modified and get further developed. If methods are used to describe phenomenon it will lead to a more simple comparison between other studies. Time and space will be saved and the availability for interested readers increases when obvious information need to be described so it can focus more on the special, current questions. [Eggeby and Söderberg, 1999]
According to Eggeby and Söderberg (1999) there are four steps to go through in order to achieve the best result. The first step is to look self, a first analyze. When the data is collected a first overview should be done. An overview in order to create an overview picture of the information, investigate if the information is symmetrical or imbalanced. It is about to create a perception about the information’s spread. The second step is to analyze with quantitative methods. When the material has been analyzed in the first step it is appropriate to analyze the information with a statistical process, in which way depends on several factors. How the questions is formulated is one of the factors, if the questions is how big or how many tables, measures of central tendency and dispersion measures can be an important aspect. If the research questions handle questions such as how do factor A affect factor B is a relationship analysis the right method. If a study is done where a comparison should be done of a work that was done in another place or time, it is appropriate to make the same calculation in order to reach the optimal comparison of the situation. The third step is to interpret the result. When the analyses are done, the overview and the quantitative, it is time to interpret the result. It is not the readers’ task to decide what is much or little. The interpretations should be reasonable and answer the research questions. It is important to compare the result with others and by that be able to discuss similarities and differences of the results. The fourth and last step is to report and present the result. They should be presented in a credible and fair way and it should look good.
2.2. W
ORK PROCESSA work process refers to the way that the work or study has been done. The work process can be different depending on what the study contains.
The goal is to, at the end of this project, present a number of proposal solutions that could help ABB OC SE in their management work and in order to do so the work will be in three steps:
5
How do other industrial companies work with these issues? How should ABB OC SE work?
2.2.1. PLANNING ACCORDING TO DMAIC
In order to get a result oriented framework DMAIC can be used which is a systematic and fact-based approach. DMAIC stand for define (identify, prioritizing and selection of project), measure (key processes, parameters and the performance), analyze (identify key causes and processes), improve (by chancing the process and improvement performance) and control (sustaining) and it refers to a lifecycle that has a Six Sigma approach, to improve the processes. [Sokovic, Pavletic and Pipan, 2010]
The process starts with defining what the problem is and why it should be solved. In order to do so; purpose, problem and questions are helpful tools. The problem statements are usually not determined to 100% when the work starts, when information are gathered some other problems can occur and the purpose will then change. A change of the problem statement can depend on limitations that occur during the information gathering process. [Ejvegård, 2003] If the process cannot be defined it is not possible to measure it. This means that if the process cannot be defined it would not be possible to use DMAIC in order to develop the process and improve it. The best result that is achieved from DMAIC is when the process is flexible and it is possible to eliminate the unnecessary steps. [Sokovic, Pavletic and Pipan, 2010]
2.2.2. VISUALIZED WORK PROCESS
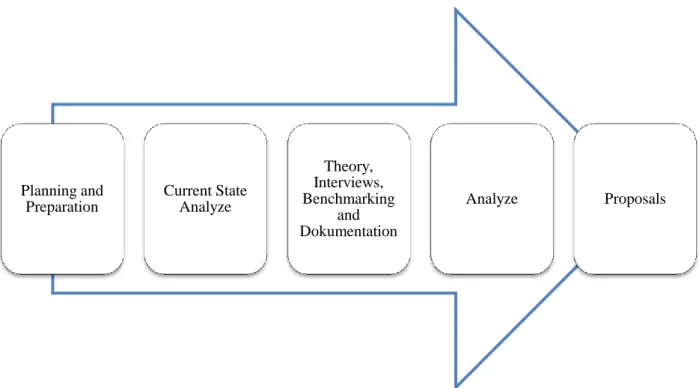
From the DMAIC method a new method has been developed in order to optimize this projects planning. The method is visually shown below in figure 1.
Figure 1 The developed method of the work process based on DMAIC
Define: Planning and Preparation and Current State Analyze falls below the defining. In the Planning and preparation phase a plan of the project is designed. Questions that should be answered are formulated and the need for benchmarking is realized and planned. Current State Analyze handles how it is today, what problems exist and what is there to improve. In this phase it is important to understand these questions in order to develop the research
Planning and Preparation Current State Analyze Theory, Interviews, Benchmarking and Dokumentation Analyze Proposals
6
questions from the previous step, Planning and Preparation, so they will agree with the problem.
Measure: In order to answer the research questions, information has been collected in four different ways. The first is Theory, what has already been written about the subject?
Interviews of the employees at ABB OC SE have been contributed to understand the situation, a deeper understanding than the Current State Analyze is reached. Sometimes the theory covers methods that are not used of companies, so in this stage it is also necessary to do a benchmarking in order to see which methods that companies use. The last factor in this step is the documentation, while the information gathering is done, it is recommended to make documentation in order to remember everything.
Analyze: In the DMAICs Analyze it is the Analyze step in the new process as well. Here is the theory compared to the benchmarking and a few Solution Proposals is developed. Improve: The proposals that have been developed are thoroughly checked and improved if needed.
Control: The final proposals are in the control-phase controlled an extra time.
2.3. D
ATA COLLECTIONPreparing and collecting information is called data collection. The data is collected in order to provide information regarding a specific topic.
2.3.1. LITERATURE STUDY
A scientific work should be factual, objective and balanced. Factual means that the
information is true, this means that the information should be checked to see if it is correct. One way to do this is to go to the primary source and control because it is likely that the secondary sources are incorrect. Reliable sources in addition to the primary sources are
scientific works, doctoral dissertations and other secondary sources where the author has been thoroughly with the control of their sources. Objectivity is something to strive for especially if the work is done of a scientist but it is not always easy. It is difficult to discover the prejudices and preconceptions that a company has. When it is time for information gathering, objectivity should be taken into account, this because of which information should be used and this can be decided from the factors prejudices and preconceptions. Both fact and objectivity are included in balance, which is the third factor in a scientific work. An analytic distance to the subject is a factor to strive for within the balance. [Ejvegård, 2003]
Literature study can also be called literature search, the literature handle in research way everything that have been printed, books, articles, reports and essays. A school library´s databases is one alternative to litterateur studies, in order to find the right information keywords are typed in. The persons writing the literature, no matter what kind of literature, needs to know what the keywords are in order to optimize the search. The keywords in the searching can be useful later when it is time to write keywords in the literature. [Ejvegård, 2003]
2.3.2. BENCHMARKING
A case study can be done more or less ambitious and detailed and because of this it is useful in most scientific work. The purpose of a case study is to describe a specific case and not a whole process but it is important to know that there is a downside with this method. The downside is; when an analysis of the case study are being made it can be difficult, this
7
because of the fact that the whole process is not described, which can lead to incorrect conclusions. [Ejvegård, 2003]
What is benchmarking?
The definition of benchmarking is somewhat varied. The pioneer of this technique’s application is Xerox Corporation, which would define it as: “The search for industry best
practices which lead to superior performance”. Benchmarking is used to mark up certain
parameters, products and strategies to create a perspective of the actual performance of the industry. This helps the company to compare their different strengths and weaknesses to the leaders of their industry and from there develop adjustment and improvement.
The measuring and improving are an ongoing process. “There are no limitations on the
search; the more creative the thinking the greater the potential reward”. To monitor the
in-house outputs thoroughly is the only way to create the possibility to recognize and filter the differences or innovations that are found in ‘best practice’ companies. [Codling, 1995] The benchmarking is divided in four different stages:
Planning Analysis Action Review
Each stage must be carried out with precision but to eliminate wasting time in the later stages more time should be spent on the planning process. In its own right the review is also a very necessary stage due to the interweaving through the planning-, analysis- and action phases. [Codling, 1995]
The phenomenon of benchmarking can be divided into three types or perspectives: Internal
External Best practice
To quickly describe them it can be said that internal refers to the partners within the company, or division. They may be based at the same, or at a different location. For example, if the company has identified a process that deals with customer complaints they could compare the practice of this process across different departments within the company. [Codling, 1995] The external benchmarking handles benchmarking among external partners within the group, for example in an international company. These may be totally different companies within different industries. The fact that they produce different products can be an advantage rather than a disadvantage, since it is possible to learn many new things. [Codling, 1995]
Benchmarking against best practice means that the company seeks out the leader in the
process that may be critical to the business success. The problem is not to find the best; it is to define what it means in terms of the process that being examined. [Codling, 1995]
2.3.3. INTERVIEWS
The most common in research is to do interviews, one at the time. Interviews take time both at the empirical and analyze step so it is important to choose which should be interviewed
carefully. An interview mostly occurs when a person asks questions to someone else. In order to be able to retell the interview notes should be taken, it is also possible to record the
8
interview. Unfortunate interviews that should be recorded can be inhibitory for the some people. In some case the person can say that they do not want to be recorded and that need to be respected. Studies have shown that even notes can be inhibitory but notes need to be taken. In order to let the person that is interview to feel as comfortable as possible keywords can be noted and right after the interview more detailed notes can be written. When the interview is done and the interviewer has written a first draft the person that were interviewed should be able to read through it and comment if something do not accordance to their answers. [Ejvegård, 2003]
A person is being interviewed because of the fact that someone wants to learn something that the interviewed person has the knowledge about, which leads to this person being able to answer the questions. In order to reach a quantitative interview it is important to have a standard approach and a structure. If the interview has a standard, everyone who gets interviewed has the same based conditions, which leads to a more easily analyzed
comparison. A structured interview controls how much restriction an answer has. [Hartman, 2004]
2.3.4. DOCUMENTATION
A documentation need to be done in a thesis work in order to pass, so that the examiner can follow all the steps that have been done. In the documentation it is important to give argument that the work have been done independently and creativity. [Nilsson, Olsson, Svensson and Lindgren- Sand, 2011]
In a documentation there should be several factors that are included, disposition, time plan, title, author indications, headlines, foreword, keywords, abstract, contents, introduction, theory, empiricism, analyze and closure. The two first factors (disposition and time plan) are only documented for the writers to this thesis own sake. Title, author indications, headlines, forewords, keywords, abstract and contents are the factors that helps describe the whole thesis work. The introduction gives a short introduction of the current state and why this thesis is done. Theory is based on what have already been written in the subject. In this theory part the writers have tried to use primary sources so they are validated. It was not possible in all cases so the secondary source have been used in those cases. Other companies than ABB have been interviewed and the author have taken for granted that the information provided by them is correct, no further evaluation of credibility of the information is made. The same is for the part about ABB. The companies’ websites have also been used in order to describe the companies. The analyze part is done of the theory and empiricism, the interpretation is done of the authors. The closure is the part where everything is tied together. [Ejvegård, 2003]
2.4. A
NALYSISThe analytic induction is characterized by three steps, which a company goes through in order to analyze the collected data to reach a valid theory. These steps could be described as
following:
First there is the planning step and this step contains two important operations. The first one is to formulate a question that the research should answer and the other operation is to design the research, decide how to answer the formulated question. When the question has been formulated and the knowledge of how the work should be executed exist in order to answer the question, the second step is initiated, the gathering of data. This is something that requires good judgment and knowledge in order to see what is important and valid and what is not. Finally there are the analyze step where the collected data is analyzed and a valid theory is emerging. [Hartman, 2004]
9
When it is time to analyze it means that a result has incurred but is not found yet. In order to find it, it is possible to take help from two useful steps. The first one is to describe the collected information in a way that makes it easier to analyze, one way to do this is to organize all the information. The second step is to analyze the questions of the problem solution and where these are presented. [Hartman, 2004]
A discussion around the result can in some cases be executed through the work but it usually happen when the theory and empiricism are finished. In the analysis the writer’s opinion are expressed. The analysis can sometimes end with suggestions to further research around the problem. [Ejvegård, 2003]
2.5. R
ELIABILITY AND VALIDITYIn order to control if the collected data is true and valid, certain methods are to be used.
2.5.1. RELIABILITY
The reliability indicates the accuracy within a tool. If a tool is accurate, the results should be the same every time something is measured. As an example, if a length should be measured and the measuring tape that is available is a rubber band. If it shows that it is difficult to get the same result on the measuring tape of rubber it shows that this measurement is not reliable. When a scientist takes measurements they often develop a tool themselves. If a person should make the same measurement as the scientist they need to be aware of the fact that the tool that has been used in the first place may be different from his own, which can lead different results. [Ejvegård, 2003]
In the evaluation of the problems it is recommended to use reliability, this in order to get a result that is correct. [Ejvegård, 2003] There are reliabilities measurements that decide how stable the tools are. These measurements are expressed in connections and are described in statistical books. When a measure cannot be obtained the reliability will ensure the accuracy of the survey in another way. If interviews or observations are used in the survey the
reliability depends on the interviewer’s ability to interpret the interview. The interviewer make assessment when they interpret the received answers, it is possible that error of the assessment happen. The condition for good reliability is that the interviewer is trained, if the interviewer is trained and the interview is structured the reliability will get higher. [Patel and Davidson, 2011]
2.5.2. VALIDITY
Accurate measurements and metrics are factors that are the base for a measuring without any problems. It is important that the right parameters are measured in order to get a result that is helpful when an analysis is done. It is also important to know what the measurement stands for and how they should be used. [Ejvegård, 2003]
If clear measurements and metrics are available there should be no problems. If a
measurement of the population in a country should be done, there are different ways to do so. For example, it is possible to count the people in the country, the people that are permanently living in the country or the number of citizens. These methods differ from each other but each method is valid since they measure what they purports to measure. [Ejvegård, 2003]
It is important to know what the measurement is used for and to then use it consistently. It cannot take statistics from different sources and use it without knowing how this statistic has been developed since it can differ a lot. Someone who has developed statistics for a country´s surface may have counted the surface without lakes and seas, while someone else has
10
included lakes and seas. It is then not valid to compare these statistics from different sources with each other. [Ejvegård, 2003]
11
3. T
HEORY
This chapter will include the theoretical parts that lie as a foundation for this thesis. The different methods used to manage the inventory from an aftermarket perspective will be presented.
Introduction Inventory Management
The inventory management is more in focus today, which depends on the competitiveness. A company needs to control their inventory in order to reduce their cost and satisfy the
customers. Managing the income and costs can be seen as an inventory difficulty. This can be solved through different methods. [Koumanakos, 2008]
Traditionally, the management in inventory is focusing on the production and procurement in order to solve the difficulty. Today there are more methods to choose from in order to manage the inventory, these methods are more focused on the management instead of the production. The inventory management is only one factor that affects the performance in a company, even so it is an important factor. [Koumanakos, 2008]
Minimizing the cost or maximize the profit is the two most common goals that an inventory management try to reach. It is necessary to find methods that make it possible to reach the goals and at the same time satisfy the customer’s demand. [Koumanakos, 2008]
3.1. L
OGISTICThe most important aspect in order to deliver products when they are needed and to an optimal price, is to control a company´s material flows in an effective way. Logistics is about controlling the material flows together with the activities and systems that are associated with this. [Lumsden, 2012]
Effective material flow is something that has always existed but the interest to work with it has changed over time and is depended on what the area of usage is. Looking at the industry, the context can be seen as a significance of effective material flow that has increased a lot since the Second World War. This is because of the fact that this resulted in an increased variation flora and complexity, resulting in problems for the management by for example high handling- and inventory costs and poor delivery service. [Lumsden, 2012]
The view on logistics has also changed over time. In the 80´s logistics was primarily directed toward capital, while it later was time that was the focus. In the most recent years the focus has changed even more and what is seen as the most important aspect now is to fulfill the customers’ needs and demands. These other aspects have come to the surface, such as quality and information, when the company realized how important it is in order to have an effective material flow. Even change-processes are something that is starting to be discussed, it is important to know WHAT a company needs to do but also HOW to do it. [Lumsden, 2012] Thus, it can be said that logistics is the study of effective material flows. The word includes both strategic and operational aspects, strategic in the sense of helping the company that by having a material oriented view reaches a higher external efficiency, doing the right things. The operational aspects means correspondingly that through a number of techniques to obtain a high internal efficiency, doing things right. [Lumsden, 2012]
The concept “logistics” is defined different in different parts of the world. Scandinavia sees logistics as a synonym to material administration. In the USA however logistics is associated with physical distribution, while the term “business logistics” is much more alike the
12
“The approach and principles according to which we strive to make our plans,
developments, coordinate, organize, steer and control the material flow from raw material supplier to final consumer” [Lumsden, 2012, p. 255]
or
“Logistic covers the activities that has to do with obtaining the right product or service at the right place, at the time and in the right quality to the optimal price” [Lumsden, 2012,
p.255]
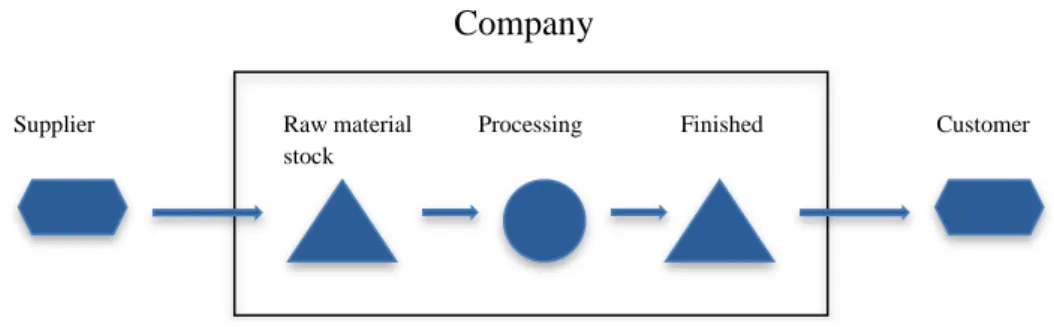
It is important to take the whole flow into account, not just the activities that take place inside the company or at only one department. The company needs to see the whole picture and include all activities and aspects between supplier, company and customer. [Lumsden, 2012] Figure 2 illustrates this in a simplified way:
3.2. W
HAT IS AFTERMARKET?
Before, the local distribution slowed the possibility to create an effective distribution of the aftermarket products. The reason for this was that the collaboration between the different service locations, which were small and scattered, did not exist. [Andersson, 1988]
Increased quality affects the aftermarket in different ways, one is that the demand of service and maintenance are decreased. Another reason is that if the quality is higher the product life will be longer, which leads to a longer time of repurchase and guaranty. [Andersson, 1988] Some companies are outsourcing the aftermarket. This because they think that aftermarket is something that is needed but not something that brings a lot value for them as a company. There are downsides with this action, one is to control that every outsourcing distributor has the right quality-aspects on their components in order to match the company’s products. [Andersson, 1988]
The competition on the aftermarket will grow in the coming years, this depends on the fact that other manufactures have reached this market. This comes from the rising awareness among other manufactures; they are new on the market and have another kind of
understanding for the importance of service and maintenance. The customer’s awareness of the importance of service, maintenance and the total economy are also increasing which leads to the fact that new manufactures, which takes these aspects into account, are competitive at the aftermarket. [Andersson, 1988]
In order to manage the inventory it is helpful to have good market knowledge, which is reachable if a close contact with the costumers exists. Then it is possible to know the demand of a component before they make an order and can regulate the amount of components in
Raw material stock Processing Finished goods Supplier Customer Company Figure 2 (Lumsden, 2012)
13
stock. With good relations with the customers it is possible to arrange prevention work. [Andersson, 1988]
Good relations with the customers are important but it is equally important to have a good relation with the suppliers. If the collaboration is positive the company can reach
advantageous contract with their suppliers and the flexibility will grow. [Andersson, 1988] Companies can be divided into four groups that depend on how they manage the aftermarket. These four groups are different interpretations that companies have that handle the
aftermarket:
As a necessary evil
Good but think of the aftermarket as a separate part from the other departments Same as the group above but in this case they have integrated the aftermarket in
the other departments As their primary market [Andersson, 1988]
3.2.1. PROBLEMS WITHIN AFTERMARKET
Both internal and external problems exist within the aftermarket part of organizations. Within the internal problems there is a trend that shows some lack of commitment from the
management when it comes to questions regarding the aftermarket. The only commitment there is stays with saying that “yes, the aftermarket is important for the company”. After this all the responsibility is transferred to strategic planning and the department that directly handles the aftermarket. In many companies there is a lack in representation from the aftermarket department in the company’s strategic discussions. This can lead to setbacks for both the service department and the management when they have to revise strategic plans due to unforeseen events on the aftermarket. [Andersson, 1988]
So it can be said that the service department is struggling with status problems within the company. This depends on the lack of internal marketing, which could lift the service department status. This lack of status leads to less recourses when it comes to competence development among employees and development for service routines. All the organizational changes are made due to primary sales instead of partly adapt it to the customers need of service and to the market of aftermarket handling. [Andersson, 1988]
Another common problem among organizations is the issue of how to organize, plan and conduct new product sales and service relative to each other; how to avoid overlaps and contradictions between these two. How can interaction be achieved? [Andersson, 1988] This can also be a problem if a company sees to the international perspective, when
establishment on new markets occurs, the aftermarket often gets forgotten or set aside. This could lead to difficulties that might take years to get rid of. Often the responsibility for aftermarket is put on each individual subsidiary or dealer without any collaboration with the main organization or other subsidiaries and dealers. Despite these deficiencies, the conditions for export companies to take advantage of the possibilities that the aftermarket has to offer are there. The knowledge and experiences are there, what is lacking is the insight that the
aftermarket, with large elements of services, may require a different approach and another company culture for export of products than traditional export. [Andersson, 1988]
14
If the aftermarket should get right attention they should get the possibility to get the recourses required in order to conduct their own business- and market development. At the export market, aftermarket is a relatively little exploited resource but it is the aftermarket that offers possibilities that could strengthen customer relations, both old and new ones. These unused resources exists both internally within the company as well as externally at customers and others. [Andersson, 1988]
Other problems are for example:
Distribution of aftermarket products and services Selecting staff
Strategies for pricing and market segmentation Knowledge development within the area
Development of information systems and routines
Many organizations have, despite these problems, discovered more short-term, revenue related profits that the aftermarket can stand for and the long-term competitive advantages that efforts on the aftermarket organization can cause. This shows that the interest for aftermarket has increased over the years and for many organizations it has become an important complement to primary sales and a starting point for business development. [Andersson, 1988]
Traditionally companies have been focusing and devoted substantial resources to product development in order to improve the quality and strengthen other selling properties of the product. What is important to know here is that quality is not only created due to a good product. Even a flawless product with a nice design could be wrong if it does not match the customers view on what the quality should include, or if a good after sales service is missing. An excellent customer service can rarely compensate for a bad product; while a bad customer service quickly can slander whichever advantages the business have to be able to deliver high-class products. [Andersson, 1988]
Many customers that buy a product see it as an investment and have expectations beyond the actual product. These expectations can vary, depending on the customers- and the
organizations market. Some customers may need help with installation, quick deliveries of spare parts, preventive maintenance or training for the users of the product. It is important for the manufacturing company to know what the expectations the customers have, even if they do not control the aftermarket themselves but leaves that part for other actors. [Andersson, 1988]
One of the greatest slogans nowadays is the part where long-term relations between seller and buyer are very important. It is good for every company to know that if they have a good working aftermarket they probably will have good relations with their customers. [Andersson, 1988]
3.2.2. SPARE PARTS MANAGEMENT
Large amounts of money bound in inventory: By using independent subdivisions the inventory is unnecessary high which lead to unwanted costs. If that is combined with a very low turnover the combination is not good. [Andersson, 1988]
New plans for the spare parts management: Liquidation of the main inventory (partly) and the independent subdivisions inventory will decrease the cost of spare parts. By doing this the action are decreased with one intermediary. [Andersson, 1988]
15
Other important questions: Standardizations of price and commission system within the spare parts distribution should be executed in order to reach a more effective result. [Andersson, 1988]
3.3. I
NVENTORYM
ANAGEMENTBoth inventory- and customers order production exists; this is about production but can be implemented on the aftermarket as well. Inventory production means that the production is based on a forecast of how many products expected to sale. The volume affects how many products that are produced and how long it will take. Inventory production can be used both on continuous- and series production. Customer orders production depends on the orders from the customers. The production starts when an order is decided. [Hågeryd, Björklund and Lenner, 2002]
In the 1980´s the Just- in- time philosophy were introduced in Sweden and since then the existence of inventory were discussed, some thought that inventory only were a load. If an inventory only is a burden why do mostly companies still have them. Toyota knows that the inventory is not a waste but they think that unnecessary inventory is waste. It is not possible to eliminate a whole inventory and it is not suitable. Inventory control is about receiving a balance between the inventory size and the utility value, not to reduce inventory. The
inventory is an asset to the company and creates value by decrease the costs and increases the revenues. [Mattsson, 2012]
The utility values that the inventory brings are, decreased transaction costs (the costs that are associated with a procurement process, purchased materials, costs of ordering, delivery control, transportation, receiving, quality and quantity control, placing in storage, processing of supplier invoices and payment of supplier invoices), increase delivery capacity (how short the delivery time can be, how safe the promised delivery time are and in which extent is possible to deliver direct from inventory ) and improve capacity utilization (how to use the existing resources). [Mattsson, 2012]
In order to clarify how these values affect the inventory it can be divided into three different types, current inventory, safety inventory and smoothing inventory. The current inventory is the first type and is based on the size of the order quantities and is necessary in order to receive the delivery capacity and satisfy the customer with a short delivery time. The size of the order quantities is also affecting a company’s delivery capacity, in regard of service. If the order quantities is halved the risk for a lack is doubled which leads to that the service level decreases if the safety inventory is not increased. The order quantity is also affecting the transaction costs, if the order quantity is halved (and the current inventory) the orders, goods receiving, quantity and quality controls, inlays in stock and more invoices to manage and payments to perform will be double. [Mattsson, 2012]
The second type is the safety inventory, one of the utility values is the impact on the delivery capacity. Due to the variation of demand and the fact that forecasts never can be expected to be accurate a safety inventory is crucial in order to keep the service level and the delivery time. Another type of value is to reduce disorders within transportation. If it does not exist a safety inventory with time- or quantities buffers a disorder will occur because of the
variations. The result of this is that the transportation resources get limited. Smoothing inventory is the third type that creates utility values. This inventory makes it possible to keep high capacity utilization even if the demand varies. [Mattsson, 2012]
An inventory consists of both necessary and unnecessary parts. The unnecessary inventory does not contribute to decrease the costs or increase the revenue so this should be reduced.
16
Cost will increase and the revenue decrease if the whole inventory is seen as an unnecessary inventory. [Mattsson, 2012]
How to solve the variation problem
Compared to a few years ago company’s ability to adapt to variations from customers- and market demand has increased. The requirement of a flexible material supply is increasing in order to reach a satisfied adaptability but there is a limit on how long it is possible to take the flexibility. There are a few different flexibility concepts that can be separated:
Product flexibility – the ability to develop and adapt products after the markets need Product mix flexibility – the ability to make changes in the product mix in the
production
Volume flexibility – the ability to produce and deliver as demand changes Delivery flexibility – the ability to change delivery time and products within the
delivery time [Mattsson, 2010b]
To have products in inventory leads to a higher capital and at the same time it is possible that it is wrong products that are in inventory, because of the uncertain prognosis. One way to solve this problem is to increase the predictability. It is know that if the variations in demand are known at the right time it is easier to predict and adapt the inventory. If the forecast accuracy is improved the predictability is increasing. [Mattsson, 2010b]
Another way to increase the predictability is to forward information of the real consumption in the retail trail down through the material flow chains. If that happen, the units that are material supported is able to build their plan on information that is real from a demand perspective. This can happen without any time delay. [Mattsson, 2010b]
The last solution to the problem is to make the variations in demand more predictable. To reach what a company should make the modern information technology is more efficient. If they do that, they will get a better opportunity to adapt variations that are coming. [Mattsson, 2010b]
3.3.1. METHODS TO DECIDE WHETHER TO HAVE INVENTORY- OR ORDER BOUND ITEMS
A company can either have articles in inventory or place their own order when they receive an order from the customer, order bound articles. In this section different methods to decide what articles should be in inventory or order bound are described.
3.3.1.1. ABC Analysis
An old way to calculate the workload and control parameters within the material management is to use volume values. With this method components are divided into groups and
classifications depending on the volume values, the components value times an annual consumption or if the volume value is expressed in another way that also is useful. Different strategies are affecting different groups. In most cases it is three groups that are developed, which are called A, B and C and those groups has given this method the name ABC analysis. The components that have a high volume value are placed in group A, the articles with medium volume value exist in group B and in group C are the articles with a low volume value. This method is based on the minatory law, which also can be called 80-20 rule. It is Vilfredo Pareto that has developed this principle and it goes:
17
“In every series of elements a small number of elements always corresponds to a large portion of the power” [Mattsson, 2003, p.1]
ABC analysis and other strategies for different groups of articles are a traditional approach to get knowledge around the components which then can lead to a more efficient way to control the flow of material and resources. This was especially important when the planning efforts were made manual. The usage of 80-20 rule decreased when the Enterprise Resources Planning- system (ERP- system) increased. The reason for it seemed to be that if a computer was used, the concerns of where to prioritize the resources were not required in the same scale as before. In one perspective this reasoning is correct but it is not only ERP- systems that have the ability to calculate effective material flow. Manual work is still necessary because when the results of the calculations are done and the decisions of what should be done have been taken it will be implemented in practice. ABC analysis and ERP- system do not replace each other. If ERP- system is used for the logistics it does not mean that ABC analysis should stop be used. [Mattsson, 2003]
As said previously the ABC analysis are often divided after the volume value but this is not always the most suitable, in some cases it is even wrong. This can depend on that Pareto´s minority law has been interpreted wrong. His principle is about sorting important components from less important and to divide the resources on those parts that are significant instead of those how in compare are less significant. If a component has a high volume value it does not mean that the component is important. In some cases the groups dividing of volume values are right but in some cases there are not. [Mattsson, 2003]
In order to use the ABC analysis to the fully it is necessary to divide the group after the right criteria, which not always is volume value. A recommendation is to choose a value that affects a company’s improvement projects. If a company would like to improve the company’s profitability through selective targeted sales efforts, they should probably base their ABC analysis on contribution margin instead of the turnover which can be interpret as a more obvious choice. Recommended is to divide the components after a cause/ effect- relationship. If there exist a more complex cause/ effect- relationship than the margin and the turnover has it can be necessary to divide the components after more than one factor in order to reach a fairly dividing. [Mattsson, 2003]
It is nothing that says that a categorization should end with one level. If a company would like an effective categorization ABC analysis can be made on subgroups of the total selection of components. A categorization can be that starting material should not be in the same subgroup as finished products or purchased components with self-produced components. [Mattsson, 2003]
Categorizations of the components can be done in an effective way with today’s ERP- system. Generally, a categorization of the components does not need a manual effort and it is easy to implement. Even though it is economical to make the categorizations they should not be executed too often. On the contrary, it is desirable to have the components in the same ABC group under a longer period of time. If changes in the ABC categorization are done often there is a risk that the employees get confused and do not know which component that belongs to which group. If it happens there is a risk that the categorization is not used in sufficient extent. [Mattsson, 2003]
18
Outsourcing is something that many manufacturing companies use, in order to purchase those components that they are not self-produced. These components can be small and have a low price or it can be complex products that are more expensive. It is irrational to put the same effort and time on every component. Those components that are purchased in a high volume and have a high purchase price should have a well done background work with suppliers in order to reach an optimal purchase- and sale price through negotiation. Negotiation is not an obvious choice on components that are purchased to a low price and small quantities. If the goal is to minimize the cost for purchased material, volume value can be the factor that is affecting the categorization. If that is the case the ABC analysis should be use so the A-components need much work, B-A-components medium work and C-A-components minimum work. The effects of using ABC analysis when purchasing, the time that a purchaser lays on each component can be rightly divided by the categorization. [Mattsson, 2003]
Variations in the demand are something that cannot be avoided so a safety inventory is used to cover the demand when unpredictable variations happen. Policy defined service levels are the base for dimensions of the safety inventory. Capital- and inventory costs exist when a company has a safety inventory so it is important to calculate the right dimension of it.
Components that are crucial, that a lack of that component cause significant implications get a higher proportion of the total capital in the inventory. Those components that not are crucial get a less proportion of the capital because the consequences of a lacking component in this category is not crucial. The ABC analysis can be used so this division is fairly made. [Mattsson, 2003]
It is almost impossible to have a correct balance in the inventory accounting system and it lead to difficulties to avoid shortages and create effective flow of material. It exist two ways to come to grips with this problem, the first is to conduct inventories more often in order to discover errors early and have the opportunity to correct it in an early stage. This method is non-value added work but a resource is needed in order to execute this. The other way to solve the problem is to increase the safety inventory which lead to a less intense inventory. Inventory at a regular basis is the most effective way in order to see the correct balance, this seen from a logistics perspective. Incorrect inventory quantity occurs most often in the in- and outgoing deliveries, because of this, inventory movement scale can be the factor that is used in order to categorize the components. If a company use safety inventory in order to minimize the inventory work, the article value can be the factor for the categorization in ABC. There are some other ways to use ABC analysis, below the goal of the analysis is described and which criteria the categorization that should be used:
Decrease the capital of the current inventory through minimizing the cost of setup within the production. Volume value should be the criteria in this categorization. Dimension safety times due to the non-certain delivery time keeping. The value of the
components and average order quantity are the criteria.
Decrease products in work. The criterion here is the lead times.
Reach an auto control of error from a progress by using control limits. ABC analysis is in that case using components value.
Where to place components so the picking order will be effective. Withdrawal rate is the criteria for the ABC analysis.
19
3.3.1.2. Criteria for selection of procurement strategy
When an article should be purchased it exists two different strategies, purchase to inventory or to order. If a company want to deliver to order one condition is that the delivery time should at least correspond to the replenishment lead time. The possibility to deliver with right delivery time can exist but the strategy to purchase to order may not be the right chose
anyway. It is the economic that the chose depends on, it can be better to choose the strategy to purchase to inventory instead. [Mattsson, 2008]
Many companies use simple criteria when they should chose purchasing strategy. One of the most common ways to do it is to start looking at the number of customer order in a year or the number of removal of inventory in a year. It is logical that these criteria is used but only takes into account to the costs involved in selected chose, mainly ordering cost and warehousing cost. The quantity of orders, number of orders per year, storage location costs and picking costs are also affects the choice of strategy. [Mattsson, 2008]
It exist downsides by purchasing to inventory, tied up capital and the company get depended at unsecure forecasts. Articles in inventory risk getting unsalable if they have an expired date or if the technology is developed so the articles in inventory gets outdated, these risks
disappear if the strategy choice land on order. [Mattsson, 2008] Methods with continuous demand
This method helps to decide if the purchasing should be done to inventory or order if the demand is continuous. If the sum of warehousing costs and ordering costs, when the articles is purchased with optimal order size, is less than the sum of ordering costs, when an article should be purchased to orders and with quantities corresponding to each customer order in a period, it is the inventory strategy that fits best. This method is called SPP-model and describe that a purchase to inventory should be the strategy if:
√ √ r = inventory factor per year [%]
p = price per piece
S = ordering cost per purchase time d = demand in a year
n = number of orders in a year [Mattsson, 2008]
This model is based on an assumption, price per unit is independent if the article kept in stock or not and that the ordering cost is the same whether it is purchased for inventory or customer orders. This model has one lack, all costs that are affected by inventory is not in this model. In addition to this it exist another model that take all the cost affected by inventory into account, see the model below:
√ k1= picking cost per pick from inventory
20 The decision criterion for purchasing to inventory is:
√ √ [Mattsson, 2008]
This model is based on economic order size according to Wilson´s formula and assumes that a lack never occurs but lacks do occur. That leads to lower warehousing costs and give
therefore the opportunity to rise to a more optimal order size. There is a model that takes the lacking into account when economic order quantity (EOQ) should be calculated. This model ignores the lacking costs and focus instead of warehousing cost, since that cost change when the inventory change in amount of articles. The result of this model show the total cost (the sum of ordering costs and warehousing costs).
( )
b = average shortage quantity per inventory cycle
Q = quantity [Mattsson, 2008]
Methods with discrete demand
Spare parts have a low and unpredictable demand which sometimes lead to that a company decide to not have an inventory or only have a one piece of every article, as a safety inventory but there are a few models that take this into account. Two of these models are based on discrete demand, average quantity for every order and on expected number of orders. The two different models have also different terms in order to choose strategy, purchase to inventory or order. With this, it means that the two models should use different decisions models. [Mattsson, 2008]
The first model
The importance of replenishment lead time is also taken into account in the first model. This model has their focus on situations that always deliver from inventory if the right quantity is available and that any defects is being backordered for delivery when the next replenishment order is delivered in. In order to use this model several assumptions have to match. The first is that the time from order to delivery is zero, if the article is in inventory otherwise the time is the same as replenishment lead time. The second assumption is that the replenishment lead time is less than the time between two following orders. In both the first and second model it is assumed that the inventory management occurs with a system there the ordering point is negative one since the customer accepts a delivery time that is the same as the replenishment lead time and an order would not have been bought in advance. A safety stock is not useful here. The last assumption is also regarding both the first and second models and it says that in these two models it is assumed that all orders concern the average value of the historic order quantities and that the time between two orders would be the same. [Mattsson, 2008]
21
If purchasing should be to inventory the formula below should apply.
[ ] √[ ]
lt = replacement time for replenishing stock [year] n = amount of orders per year for the article
k =quantity on average per customer order for the article
b = lacking quantity on average when orders could not be delivered fully d= demand
p = price per piece r = inventory factor S= ordering cost
k1= picking cost per pick from inventory k2 = fixed cost for stocking per year [Mattsson, 2008]
The second model
In this model the focus is on situations that always deliver with a delivery time that corresponding to current replenishment lead time. A positive factor in this model is that a company can provide the same and known delivery time to their customer in advance. As in the first model there are several assumptions that have to match in order to use this model. The first assumption to the second model is that the time from order to delivery is the same as replenishment lead time. The second assumption is the same as in the first model, that the replenishment lead time is less than the time between two following orders. [Mattsson, 2008] The last assumption is described above, in the first model.
If purchasing should be to inventory the formula below should apply.
n = amount of orders per year for the article
k =quantity on average per customer order for the article p = price per piece
r = inventory factor S= ordering cost
k1= picking cost per pick from inventory k2 = fixed cost for stocking per year [Mattsson, 2008]
Order bound material planning’s methods are the right choice if a company has a low degree of processing orders in which the final production order corresponding to a specific customer order or if the company has standard products where the final production order is equivalent to a series in a production program and manufacture and purchase of articles on the
22
are not suitable when it is difficult to forecast the demand as in spare parts for example. [Mattsson, 2010c]
Most common methods in Swedish companies
In order to decide if an article with acceptable delivery time, when it is purchased to order, instead should be purchased to inventory it is possible to use a decision model or criteria so it consistent assessment can be executed. [Mattsson, 2008]
A survey has been executed on several companies to reach information on which factors companies use in order to decide if an article should be purchased to inventory or to order. The result of the survey showed several different factors and different combinations and those were:
Manual assessment
Number of orders per year + manual assessment Turnover per year
Number of orders per year + turnover per year
Number of orders per year + manual assessment of how critical an article is Number of orders per year + value of an article
Manual assessment of how critical an article is
Number of orders per year + turnover + manual assessment + lead time
According to the surveys result, the most common way to decide if an article should be stocked is to check the number of orders per year, at second place is the turnover per year. These criteria is simple to use and the information that the method is based on is easy accessible to companies and is used in business systems (ERP- system) available at the market. [Mattsson, 2008]
3.3.2. ORDER POINT SYSTEMS
The definition of order point:
“The quantity of an item that is on hand when more units of the item are to be ordered”
[QFINANCE, 2012a]
Sequentially the organizations operations can be divided into three activities; purchase, manufacturing and delivery, shown in figure 3. In the ideal organization articles are not purchased before an order has been received. The time that it takes from a purchase to a complete delivery is called the Logistic Lead Time (LLT), therefore the time from that the customers place an order until they receive their delivery is the so called LLT. Depending on where in this process the actual customer order point lays the company will have to handle different solutions. [Lumsden, 2012]
The customer has the need for articles by some pre-decided specific times point, delivery times. The delivery time up to this point is totally based on internal conditions and the
Purchase Manufacturing Delivery
Logistic Lead Time