1-4 2a'2' §z o ("m"#231; V W: .{EL, , I " . .7' - . g' - _ Vaf. F M3.;4,,'.V r 'w I L ,LBKZEF ,, . a n : .31»? a a a . ,
Statens vag- och trafikinstitut (VTI) - Fack - 581 01 Link ping
No. 116A - 1977
National Road & Traffic Research lnsttute - Fack - 581 01 Linképing - Sweden
Objectives and Criteria
for Speed Limit Systems
(abbreviated version of RAPPORT No. 76, 1976)
C O N T E N T S ABSTRACT BACKGROUND OBJECTIVES Objective relating 2.2 Objective ralating Objective relating 2.4 Objective relating vehicle costs 2.5 Objective relating economics 2.6 Objective relating speed limit 3. to to to to to to accident density accident rate accident costs accident and transport infringement of
PROPOSALS FOR OBJECTIVES AND CRITERIA FOR A SPEED LIMIT SYSTEM
REFERENCES
APPENDIX 1: Memorandum giving modified
norms for speeds higher than the basic speed limit of 70 km/h
APPENDIX 2: Speed limit in force outside
built-up areas during the years 1960 1976. VTI RAPPORT 116 A Page m m m ww 11 12 13 18
ABSTRACT
It has been found that the enforcement of speed limits is a measure which makes it possible to influence
both the number of traffic accidents and the resultant damage. However, the question of how this measure should be put to use ~ or, in other words, which ob jective should be adopted in choosing speed limits for different road and traffic environments has not yet
been studied in sufficient detail.
Such studies require a system according to which gene-ral speed limits can be set up. The applicability of such a speed limit system can subsequently be ad
justed to give the desired effects on traffic safety
and travel times.
The present report accounts for some feasible, guiding objectives. These have been used to provide a basis for a prOposed speed limit system.
This report describes objectives that are concerned
solely with various aspects of traffic safety.
How-ever, the arguments are then develOped to include costs relating to vehicles and to travel times.
Furthermore, the report presents a discussion of the
insight and understanding of the road user in relation
to the speed limit system, eXpressed as road-users infringements of speed limits.
BACKGROUND
Speed limit trials have been run in Sweden since the beginning of the 19605. (See Appendix 2.) Following
the changeover to right hand traffic in September 1967,
trials were started in l968 involving differentiated
speed limits on the rural road network, which meant that the entire road system was under speed limit con
trol, the valid speeds being indicated by road signs.
Since 1968, the limits have been changed for certain types of road sections and traffic environments, the purpose being to acquire data upon which a speed limit
system can be based; such a system permits adjustments
that are related to the various items of data. In the
main, the speed limits have beed reduced successively
in the intervening years, a move that has led to both fewer accidents and to less damage resulting from acci
dents. In certain instances, the speed limits were in
creased which led to an increase in the number of acci dents and greater damage following accidents.
Thus, it was found that the enforcement of speed limits is a measure which makes it possible to influence both the number of traffic accidents and the resultant
da-mage. However, the question of how this measure should
be put to use or, in other words, which objective
should be adOpted in choosing speed limits for diffe-rent road and traffic environments has not yet been
studied in sufficient detail.
Such studies require a system according to which
gene-ral speed limits can be set up. The applicability of
such a speed limit system can subsequently be adjusted to give the desired effects on traffic safety and
tra-vel times.
The present report accounts for some feasible, guiding objectives. These have been used to provide a basis
for a proposed speed limit system.
The report has been drawn up at the request of the National Swedish Road Safety Office and among those who have participated in the work, apart from the National Swedish Road Safety Office, are representati ves of the National Swedish Police Board and of the
National Swedish Road Administration.
The purpose of a speed limit system is to present, on the basis of the guiding objective, and relating to various measures of traffic safety and other aspects of the traffic complex, criteria that can be applied to the choice of speed limit, and which can be assumed
on such grounds to give the desired degree of traffic
safety.
An example of a measure of traffic safety is the number
of accidents occuring, or the accident rate, which gives
the number of accidents in relation to the volume of traffic. Other measures that can be used include the damage and injuries resulting from accidents, or the
accident costs.
A measure applicable to the traffic complex as such is the speed of the traffic. Other such measures are tra-vel times, the number of drivers who exceed speed li
mits, the cost of travel or the cost of vehicles.
Primarily, this report describes objectives that are concerned solely with various aspects of traffic safe-ty. However, the arguments are then developed to
in-clude costs relating to vehicles and to travel times.
Furthermore, the report presents a discussion of
in-sight and understanding of the road user in relation
to the speed limit system, expressed as roadusers in fringements of speed limits.
OBJECTIVES
Objective relating to accident density
The annual daily traffic criteria that were accepted when the basic speed limit of 70 km/h was introduced have led to an equalization of the differences in accident density, i.e. of the number of accidents per
distance unit. Roads having more or less the same
standard have had their speed limits lowered when the annual daily traffic exceeded a given value.
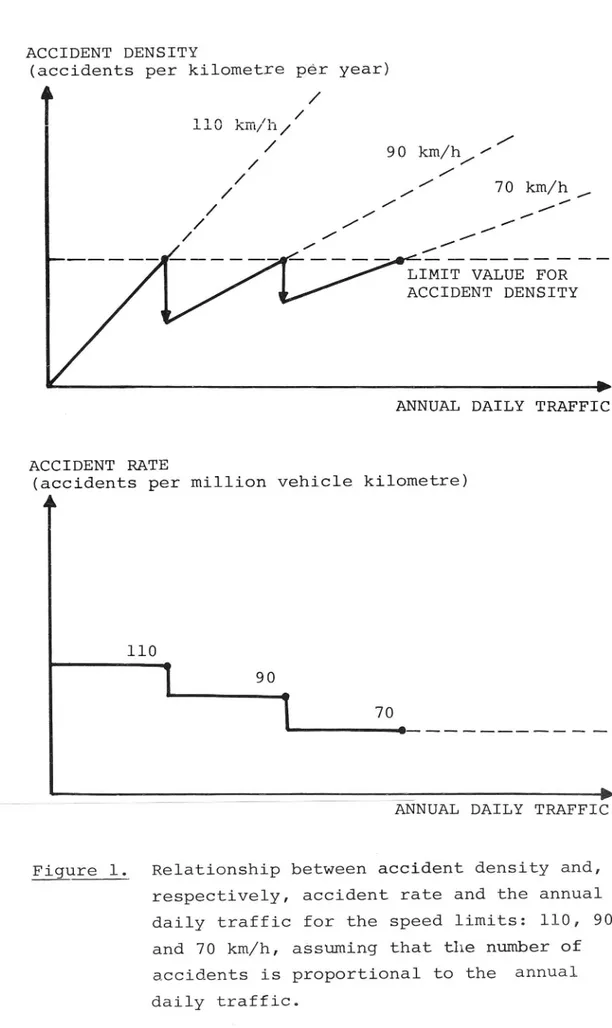
Figure 1 shows the relationship between accident den-sity and, respectively, accident rate and the annual daily traffic. If a limit value for the accident density could be obtained, the speed limit could be
This
would mean that the accident rate would fall succes
reduced successively when the traffic increases.
sively and roads with a high traffic intensity would
show lower accident rates than roads of corresponding
standard but with low traffic intensity.
The relationships described in the figures indicate that the accident density is prOportional to the size of the annual daily traffic. This in turn indicates
that the accident rate is not dependent on the size of
the annual daily traffic.
ACCIDENT DENSITY
(accidents per kilometre per year)
4
/
LIMIT VALUE FOR
ACCIDENT DENSITY
D
ANNUAL DAILY TRAFFIC
ACCIDENT RATE
(accidents per million vehicle kilometre)
Am
110
I 90
I 70
, :%>
ANNUAL DAILY TRAFFIC
Figure 1. Relationship between accident density and,
respectively, accident rate and the annual
daily traffic for the speed limits: 110, 90 and 70 km/h, aSsuming that the number of accidents is prOportional to the annual daily traffic.
Objective relating to accident rate
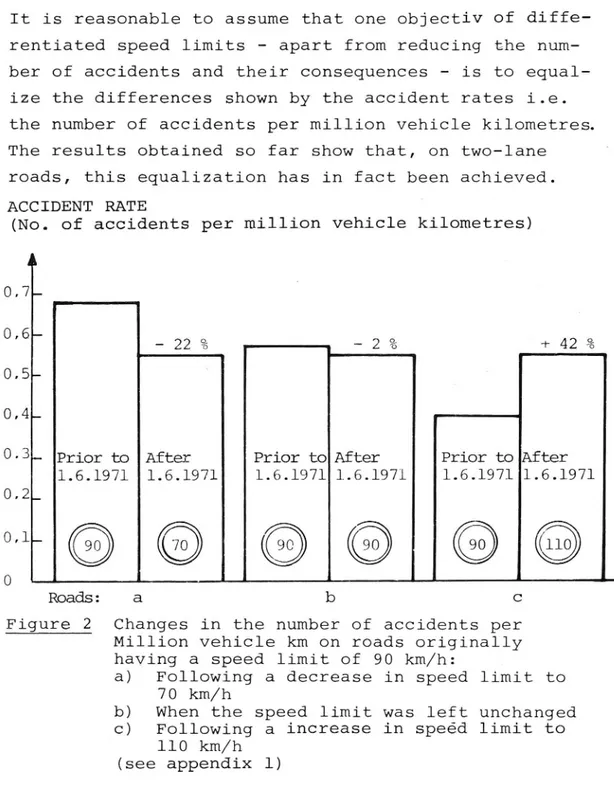
It is reasonable to assume that one objectiv of diffe-rentiated speed limits - apart from reducing the num
ber of accidents and their consequences - is to equal ize the differences shown by the accident rates i.e. the number of accidents per million vehicle kilometres.
The results obtained so far show that, on two lane
roads, this equalization has in fact been achieved.
ACCIDENT RATE
(No. of accidents per.million vehicle kilometres)
A 0.7_ L
0'6
22%
-2%
+42%
0.5 » 0,4_0-3- Prior to After Prior to After Prior to After
1.6.1971 1.6.1971 1.6.1971 1.6.1971 1.6.1971 1.6.1971
0.2_
O
Ikads: 21 b c
Figure 2 Changes in the number of accidents per
Million vehicle km on roads originally having a speed limit of 90 km/h:
a) Following a decrease in speed limit to 70 km/h
b) When the speed limit was left unchanged c) Following a increase in speed limit to
110 km/h
(see appendix 1)
Figure 2 shows that the accident rates, expressed as the number of accidents per million vehicle kilometres were to a considerable extent equalized on the roads with speed limits of 70, 90 and 110 km/h, respectively,
as a result of the introduction of the differentiated
speed limits currently valid.
Roads with narrow cross-sections were given lower speed limits than roads with wider cross sections.
(See Appendix 1.)
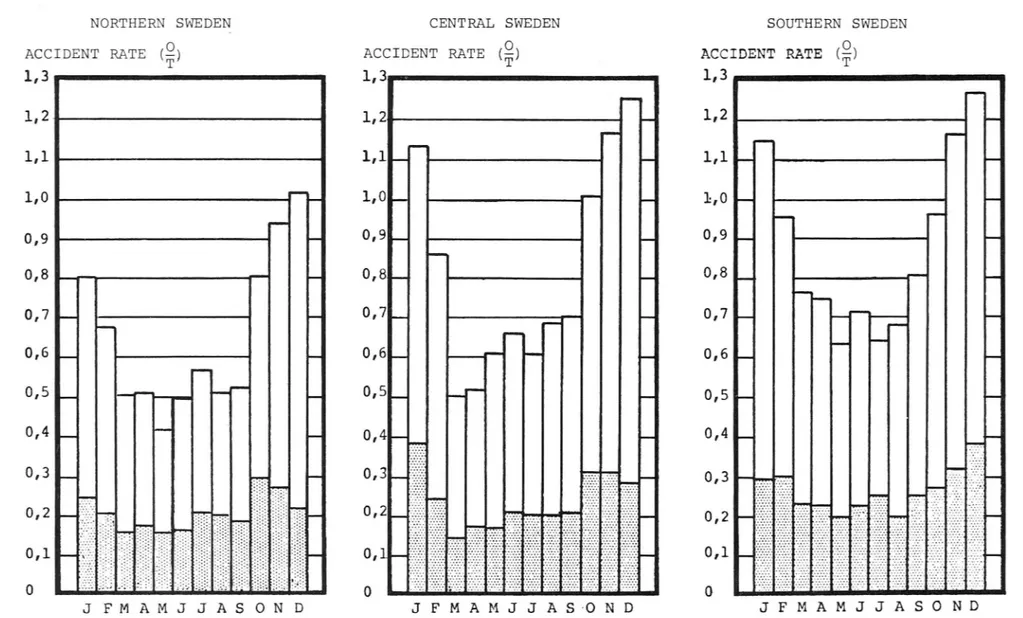
Owing to the geographic position of Sweden, there are
very large differences in climatic and light condi-tions during the course of the year. Consequently,
there are large variations in the accident rates for
the year. Statistics show that the accident rate is
far larger during the winter months than during the
months when mild weather conditions prevail. (The
reason for this is, for the most part, the state of
the road surface and the light conditions prevailing during winter.)
A study performed by the Institute (9) describes the
differences in accident risks arising from various
light and road surface conditions in different regions
of the country and at different times during the year. The measure used for accident risk is the accident
rate the number of accidents per million axle-pair
kilometres. The road network used in this study was
the national road network and the data upon which the
study was based was collected in 1973.
The average accident rates obtained for the various
external conditions studied, and for regions in
northern, central and southern Sweden, were as follows:
Northern Sweden
Clear surface Ice/snow
Daylight 0.37 1.07
Nighttime 0.83 1.43
Central Sweden
Clear surface Ice/snow
Daylight 0.46 2.67
Nighttime
1.01
3.30
Southern Sweden
Clear surface Ice/snow
Daylight 0.55 5.29
Nighttime l.O6 7-93
A comparison of the different regions shows that the
accident rates throughout are lowest for northern
Sweden and highest for southern Sweden. This relation
ship is particularly accentuated during periods marked
by ice and/or snow. Then the accident rate is about 2.5 times higher in southern Sweden than that in the
central region. Furthermore, the accident rate in the
central region is, in turn, about 2.5 times higher than the value obtained for the northern region.
In comparison to clear surface conditions, the ice/snow
relationship gives an accident rate which is 2 3
times higher in northern Sweden, 3 - 6 times higher in
central Sweden, and 7 - 10 times higher in southern
Sweden.
Irrespective of region, the accident rates obtained for dark night time conditiOns are about twice as high
as those for daylight conditions when the ground is
clear and about 1.5 times higher when the surface is,
covered with snow or ice.
Just as difference in accident rates for different road and traffic environments can be equalized by using speed limits that are differentiated according to the road standard, so should it be possible to equalize accident rates during the year by using
V T I R A P P O R T 1 1 6 A ACCIDENT RATE ( 1,3 1,2 1,1 1,0 0,9 0,8 0,7 0,6 0,5 0,4 0,3 0,2 0,1 0
NORTHERN SWEDEN
9
T
CENTRAL SWEDEN SOUTHERN SWEDEN
(%)
ACCIDENT RATE (g)
)
ACCIDENT RATE
1,
1.3
l, 1'2 1,1 1,1 1,0 1,0 0,9 0,9 0,8 0,7 0,6 0,5 0,4 ..-.. 0 I 3:2,}:- ,_C:_:,: O , 3 I . . _ ._.'.I._. . . .. . - . . . . .. . . . .. . . . .. . . . . . .-. - . . . . . . -. I C O I I o I a .4 . . . .. . . . ... . . .. . . . .. p V . . . . ... . . ... . . .. . . ... . . ... . . ... . . .. I . . . n . . . . .. . . . . u . - . . . .. . . . ..n - . . . .. . . . u. . - . . . . .. . . ..- . . . . o . . . .. .. h . . . - . . . n - - - O - '-. '-. '-. '-. '-. .. .c.. -u. ' .. ' - ' . . . . - . . . - . n . .. . . - n .. . . . - - u . . n . .. ' ' ' ' ' ' ' ' ' ' " - . u o . a . c o p . . . - . g . o . . . o . . - - u - u o. . . . n o - - . . . .- n . . s . . .a . . . . .I. - o n u u -. . . - n.. . . .c . . II . . . A v . .. . ' ' ' . ' . . . . . . . . - . g . . . g n n a o . o n . - cl . . . - - - u - . o - o o a n a o n a v . . . ... . . u . . ~ . . . - - . . o . . . n n - o . . . ¢ . . . "" III. III .cu 1.. -¢ a. -..- ' ' ' -. .
. . . .. . . ..
. . . .. _
. . . ... . . . . . . . I .. _
I . . . n . r u q - . . o - . .- . . . u . n o . . u .. " II 1.. .nl It. u--. or: ....
... o. . ' . ' . . u . . . . . - . . . n . . . c ~ n . - u g n . - . . . . .. . u . .. n n . . . -. . . .. . . o .. . . - n . - . c a - . n .. . . o . -. . . - . - u .o . u u . . . ... - o - . o.. . - . . . .1 . - . . . . . . . . n - ' ' - ' h _ . ' . . . - . A. . . - . . . . . _ - - - _ . - _. . . .. . . . - . . . .. . . . .. . . -. . n Au . c u . -. . n- . . - .-- . . - . . . .. . . . u n - . ~ . u .n u . o n o - -» - . . . - .-. . . .-. .-. .-. n n - o c . . n n . . . u n v . . . . u . n u no . . . i .. . . . . ~ .. l. .I . '' ' - p I -' - I'n c . - - n I u ~ . . . .c c u u p. p n-. . . . .. . . .. . . . , .. . , . _ ., . . . _ . . I ' I' . ' ' ' I I . . . .. . . .. . .. . . ..-o-. .-. .a l . . . . - . I n - u u n ~ I . u . . u o . - a v - v ~ -o . . . .. J F M A.N1LI.J A S O N'D I . .J .'.; J E M A M J J A S O N D n . - . . g . . . u . . . . .-J F M ATD1LITI.A 8-0 N D
Figure 3. Accident rates for the total number of accidents and accidents involving personal injuries, grouped by region and month.
speed limits that are differentiated according to time. It should be possible to achieve improvements in traffic safety by enforcing lower speed limits during the winter months. It should even be possible in the future to allow speed limits to be determined by the prevailing road surface and light conditions.
Objective relating to accident costs
In the objective deScribed above, no consideration was
given to the fact that accidents occurring at high speeds generally result in far greater damage than those occurring at lower speeds. One way of elimi-nating this discrepancy is to attempt to equalize the differences between the costs involved by using diffe-rentiated speed limits. This would result in lower accident rates for roads of a better standard
compa-red to those obtained for roads of a lower standard.
Objective relating to accident and vehicle costs
As in the case of costs incurred in accidents, the
cost outlay for vehicles increases with increasing speeds. The increase in vehicle costs depends on creased energy consumption and expenditure due to in-creased wear and tear to the vehicle. In View of the fact that energy supplies are a matter of current in terest, it might well be pertinent to take vehicle costs into account in discussions on objectives for a speed limit system.
The consequence of an objective in which both accident
costs and vehicle costs are taken into account is that
the accident rate should diminish increasingly with
lO
improved road standards compared with an objective which takes into account only accident costs. Figure
4 shows how the vehicle costs for family cars vary
according to speed. Sw.Crs./Family car-kilometre 0.27 0.26 0.25 02L 023 0.22 0.2 1 020 0.19 0.18 Figure 4 4L
\
T Gravell
\\
/
Aspha:j//
l
\
Oil gravel +asphalt (old//N
\
road)V/'
\JV/
1.0 VI,S0 60 70- 90 mo 110 KH/H
Vehicle costs for family car at different
speeds and for different road surfaces
(prices as per 1973).
Source: Profitability estimations of
Road Project DAlZl National
Swedish Road Administration 1973
11
Objective relating to transport economics
In the objectives discussed hitherto, no direct consi
deration has been paid to the effects of speed limits on travel times. An objective relating to the econo-mic aspects of transport aims at setting a speed limit
which, in every conceivable road environment, gives
minimum transport costs, i.e. the sum of the costs of
accidents, vehicles and time. The "Optimum" speed
limit in each road environment will be dependent on such factors as arbitrary evaluations of time and accidents. The experimental work that has been done
so far does not provide sufficient information upon which to base an objective dealing with the economic
aspects of transport. Judging from the profitability calculations used in road planning, and the results obtained from various road trials with differentiated
speed limits (which are designed to study the effect
of these on accidents and on the actual driving speeds
speeds exceeding 100 km/h are not "profitable" from
the standpoint of transport economy. Furthermore, in
order to reach minimum transport costs at a speed of
100 km/h, it is essential that the road environment in question is devoid of accidents.
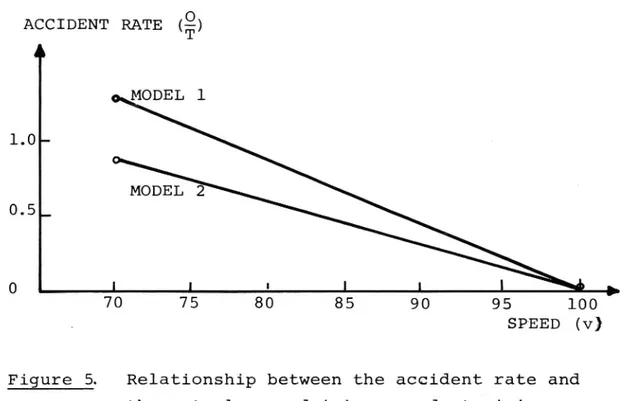
Figure 5 illustrates, using two models, the relation ship between the accident rate and the actual mean driving speeds which lead to a minimum transport cost.
Mddel l is designed so that the accident rate is pro
portional to the square of the actual driving speeds (v2), and Mddel 2 is designed so that the accident
rate is prOportional to the cube of these speeds (v3)
Figure 3 12
ACCIDENT RATE (ST?)
A1.0
0.5 _
0 l 1 I I I I70
75
80
85
90
95
100
SPEED (v)Relationship between the accident rate and the actual mean driving speed at minimum
transport costs.
Objective relating to infringements of speed limit
Another feasible objective for a speed limit system which is constructed purely on a system of surveil-lance, is to assume that the frequency of infringe-ments is the same for the different road and traffic
environments.
l3
PROPOSALS FOR OBJECTIVES AND CRITERIA FOR A SPEED LIMIT SYSTEM
On the basis of the objectives presented above and in consultation with representatives for the National
Swedish Police Board, the National Swedish Road Safety Office and the National Swedish Road Administration,
the following proposed objective has been drawn up.
OBJECTIVE RELATING TO ACCIDENT RATE
The points covered by this ob-jective should also include accident densities, personal in juries resulting from accidents,
and the insight into and under
standing of the speed limit
sys-tem shown by the road user.
The objective can be formulated as follows:
To equalise the differences in accident rates and in-juries within "homogenous" road categories, by the application of differentiated speed limits. The term "accident rate" refers to the number of accidents occuring per million vehicle kilometres, while "in juries" refers to the number of peOple injured per traffic accident. The speed limits may differ in both
location and time.
Ideally, the objective implies that the accident rate and injuries relating to one "homogenous" road cate-gory should be of the same magnitude for all the roads
belonging to this category at various times during the
year.
14
The reason for differentiating the objectives applying to different road categories is to be found in the
large variations in standard, in traffic volume and in
traffic composition applicable for the various cate gories.
These differences also lead to considerable variations
in the accident rates. A comparison between motormways
and two-lane highways may serve as an example. The
physical plan of the motor ways steers the traffic in
such a way that such roads are generally safer than two-lane roads, i.e. the accident rate is lower for
motor-ways than for two-lane roads. This difference
in accident rate, which is largely due to differences
in road standard and traffic composition, should not be eliminated completely in a speed limit system.
As roads of a high standard carry, with few exceptions, a high traffic intensity, the accident density is a factor that must be considered. However, it appears to be impossible to set an upper limit for accident
density since it would mean enforcing very low speed
limits on the roads of motor way standard having high traffic intensity.
As a first step towards determining which criteria
should be applicable to a road differentiated speed
limit system, it is necessary to reach agreement on
the relationship between the accident rates applying
to different road categories. However, the term "road
category" requires definition first.
A construction relating to road category must take in
to account not only accident rates but also the perso nal injuries mentioned earlier the number of peOple injured per traffic accident. The figures for these
are obtained by studying the distribution of the
15
types of accidents occurring in different road and
traffic environments. In this case, too, it is
necessary to reach agreement on the extent of varia
tions in personal injuries that can be accepted as
permissible in the road traffic system.
The statistics drawn up by the National Swedish Road Administration (based on the traffic accidents occurr
ing on rural roads that were reported to the police in 1973) enable an estimation to be made of the number of injured persons per accident reported to the police
for different types of accidents.
Type of accident Number of injured persons per reported accident
Single vehicle 0.60 Turn-off 0.48 Catching-up 0.43 Overtaking 0.51 Crossing 0.51 Head on 0.86 Bicycle 0.90 Pedestrian 0.99 Animals 0.10 Others 0.45
As seen from the table, the injuries to persons
in-curred during different types of accidents vary con siderably. According to the table, personal injuries are most likely to occur in accidents arising from head-on collisions and in accidents between a vehicle
and a bicycle or a pedestrian, whereas a collision
with an animal seldom leads to personal injuries.
The data upon which to base criteria designed to compbr with the objective set up have been very largely in creased since the introduction of the speed limit
16
system currently in use. In this connection, mention
canbe made of the Road Data Bank that has been started
and the research and develOpment work that is being done on speed and accident models
account the traffic volume,
and speed limits.
Figure 6
rate and the road width for three
road width,
which take into
road alignment
illustrates relationships between the accident
different alignment figure that the the alignment and
radius >lOOO metres with
530 0/00 or brow of hill.
radius >lOOO metres with >30 o/oo, curve radius 700 1000 metres irrespective
of slope, and curve radius 400-700 metres with slope 330
0/00 or brow of hill.
Curve radius 400-700 metres 'with lepe >30 0/00 and curve radius $400:metres irrespec
classes. It can be seen from the
accident rate is affected by both
the road width.
ACCIDENT RATE
Class I alignment: Curve
sth
Class II alignment: Curve
shxe
1.0 _
\. Class III alignment:
\
- tive of slope..
\. III \ ./ 0.5 _ 0 WM 1 I I I I n n l I I 50 150 ROAD WIDTH (DM)Figure 6 Relationships between accident rate and
road width for different alignment classes
17
With reference to the prOposed objective, it is there
fore possible to state the criteria necessary for se
lecting speed limits and which take into account
a road width
0 road alignment
0 accident type distribution
Using the relationship between the accident rate and injuries incurred in accidents (relating to the various
road categories), the actual status of traffic safety may be derived from the variety of criteria determining
the choice of speed limit.
Thus, it is possible for the authorities who are re-sponsible for traffic safety to decide how, and the extent to which, speed limit measures can be effected
in order to influence the number of traffic accidents.
18
R E F E R E N C E S
(Articles written in Swedish, with titles translated
into English)
(1)
(2)
(3)
(4)
(5)
(6)
(7)Roosmark P-0 and Nilsson G
Differentiated general speed limits. Parts 1.1
and 1.2
The effect on traffic accidents.
VTI (SVI), Special report No. 90, 1970
Roosmark P-0 and Nilsson G
The effect on traffic accidents of the 70 km/h
speed limit
VTI, Report No. 24, 1973
Anderson B M and Nilsson G
The effect of speed limits on traffic accidents A comparison between the speed limits 130 and
110 km/h on motor ways, and the speed limits 90
and 110 km/h on two-lane roads
VTI, Report No. 59, 1974
Nilsson G
Studies of the relationships between accidents, road profiles and traffic volume
VTI, Report No. 27, 1973 Nilsson G
Relationship between traffic accidents and road
cross section, annual daily traffic and speed limits
VTI, Intern Report No. 128, 1973
Br de U and Nilsson G
Prediction model for traffic accidents
VTI, Report No. 77, 1975
Gynnerstedt G
Simula-and its system-ana-Summarized descriptionof the project:
tion of rural road traffic, lytical background
VTI, Intern Report No. 164, 1975
(8)
(9)
(10)(ll)
(12)
(l3) l9Jornrup H and Svensson A
The effect of speed limits outside built up areas STR, Bulletin No. 10 1971
Nilsson G
Accident rate as a measure of traffic safety Variation in accident rates in relation to road surface conditions and light conditions
VTI, Report No. 73, 1975
Marcellis J C
An Economic Evaluation of Traffic Movement at Various Speeds
Highway Research Record No. 35, 1963 (In English) Kolsrud B and Ustman C
Edholm S,
Differentiated general speed limits
Part 2
The adjustment of drivers to speeds
VTI (SVI), Special Report No. 90, 1970
Carlsson G and berg G
Follow-up speed studies of the 70 km/h speed limit
during the summer (6 months) of 1971 VTI, Report No. 12, 1974
Nilsson G
A summary of differentiated speed limit trials
run during the years 1968-1972 VTI, Report No. 88, 1976
Appendix 1
Criteria for higher speed limit than basic speed limit 70 km/h. Road category l. MoUnmay Rcaimud i 2. 3. Roads in nordmin Sweda1 I v I V I/ \ I V I V IV I V 12 9 7.0 6.0 6.0 10.0 9.0 8.0 7.0 6.0 6.0 5.5 5.0 5.0 VTI RAPPORT 116 A
Annual daily traffic
.9 (gravel) (ADT 1969)
53000
< |/ \ |/ \ I/ \ I A I A I A I /\ |/ \ |/ \ |/ \ l 500 000 800 250 000 000 000 000 000 500 300 200 Spaai lhnit._.._1_<I_n__/1_1_._.
110 110 110 110 110 110 90 90 90 90 90 90 90 90 90Appendix 2
p- 1(2)
Speed limits in force outside built-up areas during
the years 1960-1976.
Time Speed limit
22 dec 1960 - 9 jan 1961 80 90 100 29 march - 5 april 1961 90 19 may 24 may 1961 90 22 june - 12 july 1961 90 1 sept 11 sept 1961 90 22 dec 1961 8 jan 1962 80 18 april - 2 may 1962 100 8 june 25 june 1962 90 13 july 31 july 1962 90 17 aug - 3 sept 1962 100 21 dec 1962 - 7 jan 1963 90 10 april - 17 april 1963 90 31 may 3 june 1963 90 20 june - 23 june 1963 90
every week end (friday sunday)
during the period
28 june 4 aug 1963 90 20 dec 1963 - 6 jan 1964 80 25 march - 1 april 1964 90 15 may 18 may 1964 90 18 june - 21 june 1964 ' 9O 3 july 2 aug 1964 90
every week-end (friday sunday)
during the period
7 aug 30 aug 1964 100 11 dec 1964 10 jan 1965 80 14 april 21 april 1965 90 4 june 7 june 1965 90 24 june 27 june 1965 90 2 july - 1 aug 1965 90 29 oct - 28 nov 1965 90 17 dec 1965 - 9 jan 1966 80 1 april - 13 april 1966 90 27 may 30 may 1966 90
VTI RAPPORT 116 A
Appendix 2
p- 2(2)
Time Speed limit
23 june - 30 june 1966 90
1 july - 31 july 1966 90
evemy week-end (friday-sunday) 100
durlng august 1966 1 hov 30 nov 1966 90 16 dec 1966 8 jan 1967 , 80 17 march - 29 march 1967 90 12 may - 15 may 1967 90 22 june 31 june 1967 90 31 july - 2 sept 1967 90 3 sept 5 sept 1967 60 6 sept - 17 oct 1967 70 18 oct - 31 dec 1967 80 1 jan 7 may 1968 80 8 may - 28 june k1 1200 1968 Di fI (130,110,90) 28 june k1 1200 - 1 sept 1968 90
2 sept 19 dec 1968 Di fII
(130,110,90)
20 dec 1968 - 7 jan 1969 90
8 jan 2 april 1969 Dr fII
(130,110,90)
3 april - 8 april 1969 90
9 april 18 june 1969 InffJI
(130,110,90)
19 june 23 june 1969 90
24 june 1969 - 29 april 1970 Dr EII (130,110,90) 30 april 1970 - 31 may 1971 90 1 june 1971 - - Di EIII (110,90,70)