121
A review of the traffic safety situtation in Sweden with regard to different strategies and methods of evaluating traffic safety measures
Göran Nilsson
Reprint from Journal of Occupational Accidents, 6 (1984) 35-47
V i l s ä r t r y c k__
1987
Väg00/1 7}Hf ! Statens väg- och trafikinstitut (VTI) + 581 01 Linköping , [ St]tlltet Swedish Road and Traffic Research Institute * S-581 01 Linköping Sweden
A REVIEW OF THE TRAFFIC SAFETY SITUATION IN SWEDEN WITH REGARD TO DIFFERENT STRATEGIES AND METHODS OF
EVALUATING TRAFFIC SAFETY MEASURES
GÖRAN NILSSON
Swedish Road and Traffic Research Institute (VTI), S-581 01 Linköping (Sweden)
ABSTRACT
Nilsson, G., 1984. A review of the traffic safety situation in Sweden With regard to different strategies and methods of evaluating traffic safety measures. Journal of
OccupationalAccidentS, 6: 35 47.
In industrialized countries road traffic accidents cause the majority of accidental
deaths. The experience from accident and casualty investigations and studies of the effect of traffic safety countermeasures can to some extent be of great value in research on
occupational accidents.
This paper illustrates problems connected with the evaluation of the effects of
counter-measures, problems with accident and casualty statistics, examples from investigations
and of the evaluation process in order to describe the benefit of investments to increase
road traffic safety in relation to traffic safety strategies in Sweden.
BACKGROUND
Experience from traffic safety research may, in many cases, be of great value for the development of occupational accident research. In literature which describes risk concepts and risk analysis, examples are often taken from road traffic in order to explain in simple terms the concept of risk. These examples more often form an expression of the author s own view of
traffic than a scientifically based evaluation.
In reality, road traffic is at least as complicated as any other situation Where man constitutes a meaningful part of a system. If road traffic were under the administration of a single employer and road users were regarded
as employees, this area of activity, if regarded as an occupational activity, would be the first to take action due to accidents and casualties. However, since the greater part of the road transport sector has developed into an in-dividual activity and is regarded as such, it is the road user Who has to bear
the larger part of the responsibility for the negative consequences together with the police and hospital services.
As in many other situations the negative results of road traffic in the form of accidents and casualties can be regarded as a lottery. We know with
con-siderable certainty how many road users are killed or injured annually but we cannot predict the time, location or consequences of each accident.
We are forced to describe traffic safety for groups of road users, parts of
the population or sections of the road and street network before we adopt
a plan of action which in general is suited to the corresponding structure. Through various channels for recording accidents and casualties - the police, hospitals and insurance companies it is possible to follow trends in
the number and type of accidents from one period to another in various en-Vironments.
However, these sources produce distorted pictures of the traffic safety situation no authority has the responsibility for reporting the correct level or providing a representative picture of the traffic safety problem. The
majority of decisions are based on the number and severity of accidents
which have already occurred. Risk assessments are beginning to draw
atten-tion but are most often based on historical knowledge.
ACCIDENT TRENDS, COUNTERMEASURES AND RISK CONDITIONS IN ROAD TRAFFIC
The rapidly increasing number of accidents during the 19505 was seen as
a considerable social problem and was met with increased action by society in the form of investment in roads and streets, primarily to cope with the expansion of road traffic.
During the 1960s traffic regulation was given priority in the hope of
limit-ing the continued increase in the number of accidents and casualties. The
result was that traffic regulations in the first instance, speed restrictions reduced the consequences of accidents to a greater extent than the actual number of accidents. During the 1970s this led to the political possibility of
action to reduce the consequences of accidents, which resulted in legislation
on the use of seat belts and crash helmets.
After the Second World War, the number of accidents and casualties corre-sponded fully to the increase in car traffic until the middle of the 1950s.
During the 1960s, the increase in accidents was on average about 5% units lower annually than the increase in car traffic due to the positive effect of different countermeasures.
The 1960s were characterised by over-use of cars and excessive travel at high speeds. The change to right-hand traffic in September 1967 probably
meant a longterm positive effect on traffic safety drivers and other road
users started a process of re-education and speed limits were introduced throughout the whole road network, which contributed to reducing travel
at high speeds.
Corresponding patterns are found in most industrialized countries but, for
some reason, the traffic safety situation in Sweden has never become a
catastrophe , as it has, for example, in Japan, France or Finland. The
TRAFFK VEHICLE KM 10° A 50 TOTAL NUMBER OF FATALITIES lN TRAFFIC ACCIDENTS l 1.0 1500" A "30 (O (0
10000
495
i?
&? (F 57(5?
20
A soo » «To 01945 50 -55
60
65
-7o
-75
00
-85
Fig. 1. Number of fatalities and vehicle-km in Sweden, 1945 1982.
traffic and roadbuilding policy during the 19603 and the years after the change. It is worth noting here that the planning of housing estates since 1965 has also taken full account of traffic safety requirements.
On the basis of information on the number of casualties in accidents
re-ported to the police and information from travel habit surveys, it has been possible to quantify the risks to various road user categories on a national
level (Thulin, 1981).
In Fig. 2, the number of casualties (including those killed) is related to
the number of person-kilometres for various road user categories. The figure shows that high risks are associated with small degrees of exposure and low risks with high degrees of exposure, expressed in person-kilometres.
In Fig. 3, the number of casualties is related to the number of hours in
traffic for various road-user categories. The difference in travel speeds be-tween different road-user categories results in increased risks for motor
NUMBER OF KILLED AND INJURED PERSONS PER MILLION PERSONKM
3 1,9 0,5\ 49 30
032 PERSONKM (109)
Fig. 2. Number of killed and injured people per million person-km for different road user groups.
NUMBER OF KILLED AND INJURED 325 PERSONS PER MILLION HOURS
I
\/@etg
e
13- (f,. 721. 149 27 1066 S10 3 HOURS IN TRAFFIC (106)Fig. 3. Number of killed and injured persons per million hours in traffic for different road-user groups. (* 1 3 1 2 3 k T F Y ' T ' T T T Y X I / Y T ' N A F _
vehicles, especially for car drivers. Note that the areas shown are the product of risk and exposure, which is the same as the number of casualties.
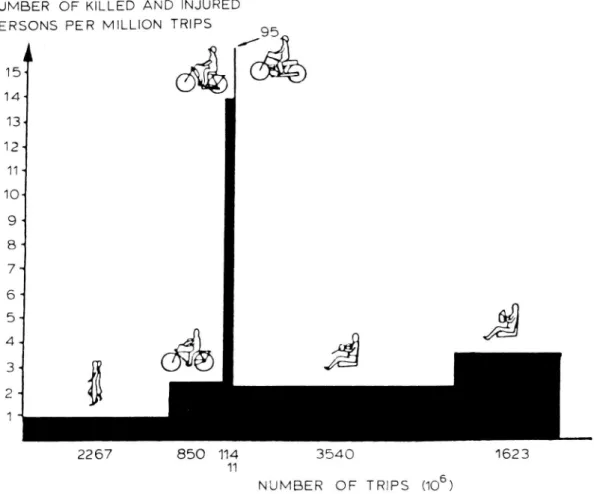
In Fig. 4, time in traffic has been replaced by the number of trips without
changing the internal order of the risk levels. The explanation for this is that the average travelling time per trip regardless of mode, is relatively constant
(20 min.).
NUMBER OF KILLED AND INJURED
PERSONS PER MILLION TRIPS 95
I
/
141 13< 2267 850 114 3540 1623 11 NUMBER OF TRIPS (106)Fig. 4. Number of killed and injured persons per million trips for different road user
groups.
ACCIDENT AND CASUALTY STATISTICS
Traffic safety descriptions based on reported accidents represent about 25% of all traffic casualties. The statistics are, however, almost comprehensive
in the case of those killed or very seriously injured.
If we also include single accidents with bicycles and mopeds we find another 25% of the casualties. The majority of these injuries are recorded
only by hospitals.
The remaining 50% of all traffic casualties consists of pedestrians who for
some reason are injured when walking along roads or streets, hurrying to a
bus, stumbling or falling or being injured when travelling by bus or tram.
The official traffic casualty statistics are still oriented towards describing accidents involving motor vehicles. This means that we receive a distorted
picture of, for example, the need for hospital resources on the basis of police
information, partly because of the fact that the majority of those killed do not need hospital treatment, while a large part of society s resources are
required in order to care for cyclists, moped riders and pedestrians injured in single accidents not reported to the police.
Figure 5 shows a comparison between the official statistics for the severe-ly injured and the corresponding information from hospitals (Nilsson and
Thulin, 1982). Hospitals record a traffic safety problem which is twice as
large as that recorded by the police and, in certain cases, is even larger in those age groups which use bicycles or walk more than other age groups.
NUMBER OF HOSPITAL PERIODS AND NUMBER OF KILLED AND SEVERELY INJURED PERSONS IN ROAD TRAFFIC REPORTED BY THE POLICE PER 1000 INHABITANTS
70 15 17
HOSPITAL PERIODS PROM HOSPITAL
So. STATISTICS
18 19
l
5,0- KILLED AND SEVERELY INJURED PERSONSFROM POLICE STATISTICS
4,0-20 24
m off.Stot
7,5 9,4 3223 5,6 13,0 9,6 9,4 9,9 12,1 INHABITANTS ( IO )IN AGE GROUPS
Fig. 5. Number of hospital periods per 1,000 inhabitants for people injured in road traffic, 1977. Number of people killed or severely injured in police reported accidents per 1,000 inhabitants, 1977.
THE TRAFFIC SAFETY SITUATION AND THE EFFECTS OF DIFFERENT COUNTERMEASURES
Each countermeasure or change in traffic may alter the traffic safety
situation in different ways. In principle, three different effects can be distinguished and recorded (Nilsson, 1981):
0 Change in the risk of accidents or personal injuries.
0 Change in the consequences of accidents or personal injuries.
This can be illustrated in a three-dimensional figure as in Fig. 6.
If we introduce a countermeasure this may influence one, two or all of the above effects. One example is that of speed limits which restrict exposure, risks and consequences. Increased fuel prices may influence exposure, better road standards may reduce risks and wider use of seat belts may reduce the consequences of accidents. This can be illustrated by altering the volume in
Fig. 7 which is a direct measure of the number of traffic casualties.
nam BENT H TE (%]
Fig. 6. Description of a traffic safety situation in terms of accident rate, accident conse-quences, exposure, number of accidents and injury rate.
FICCIBEHTT HnTE
tug}
?? *nlIIIIIIIIIIIIIIIIIIIIIIIIIIIIIIIIIIIIIIIIIIIIIIIIIIIIIIIII" " -: 511W
:|.|||||I|||||l||||IIIIIIIIIIIIIIIIIIIIIIIIIIIIIIIIIIIIII; ||
IIIIIIIIIIIIIIIIIIIIIIIIIIIIII
Fig. 7. The effect on the traffic safety situation if accident rate, accident consequence
PROBLEMS IN EVALUATING THE EFFECTS OF COUNTERMEASURES
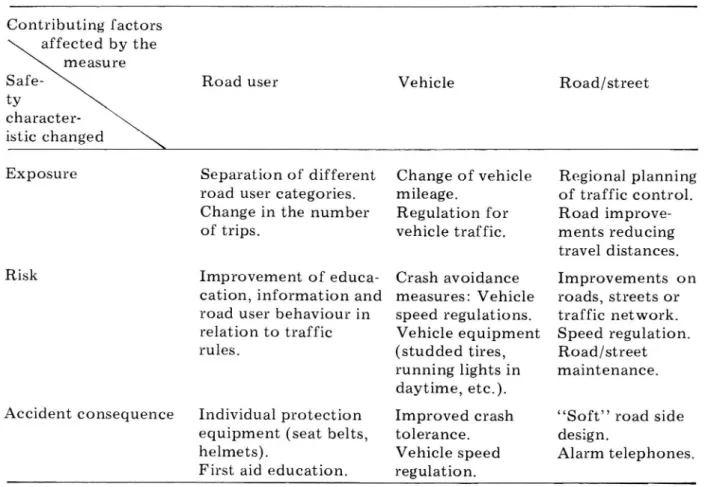
Table 1 surveys countermeasures and expected effects related to road environment, vehicles and road users, through a two-dimensional
classifica-tion of road safety measures.
One example of a countermeasure for reducing exposure to accidents or the number of casualties is the separation of pedestrians from motor traffic by pedestrian tunnels or signals. A problem occurring here is that risks in-crease noticeably for the group of pedestrians who do not use the tunnels or who cross against a red light. If this group increases and becomes a majority, the difference in risk between crossing against a red light and crossing with a green light will decrease. However, this does not mean to say that it is safer to cross against a red light, but the expected effect of the countermeasure
will be greatly reduced.
TABLE 1
Two-dimensional classification of road safety measures Contributing factors affected by the measure
Road user character-istic changed
Exposure Separation of different road user categories. Change in the number of trips.
Risk Improvement of educa-cation, information and road user behaviour in relation to traffic rules.
Individual protection equipment (seat belts, helmets).
First aid education. Accident consequence Vehicle Change of vehicle mileage. Regulation for vehicle traffic. Crash avoidance measures: Vehicle speed regulations. Vehicle equipment (studded tires, running lights in daytime, etc.). Improved crash tolerance. Vehicle speed regulation. Road/street Regional planning of traffic control. Road improve-ments reducing travel distances. Improvements on roads, streets or traffic network. Speed regulation. Road/street maintenance.
Soft road side design.
Alarm telephones.
The same problem appears when road standards are improved. There is,
for example, no difference in accident risk for single accidents on motorways
and on normal two-lane roads due to the higher speeds on motorways, or
other factors. Since traffic in different directions on motorways is separated the risk of collisions is reduced. However, in those cases where a vehicle
crosses the central reservation or travels in the wrong direction by mistake
the consequences are often catastrOphic because of the high speeds.
Apart from speed restrictions, countermeasures to reduce risks include other types of traffic regulation, road environment, vehicle-oriented mea-sures and information and education. Vehicle-oriented meamea-sures may relate
to brakes, tyres and lighting. A concrete example is that of vehicle lighting under daylight conditions ( running lights ) and re ectors on bicycles and pedestrians.
Measures such as road markings and re ective posts along the road do not, in many cases, provide the expected effect since speeds increase. This means that an expected decrease in the accident risk is reduced or does not occur
at all, at the same time as the consequences of accidents increase.
Action to reduce the consequences of accidents is not yet complete.
Energy-absorbing modifications to various parts of vehicles have shown
positive developments. Seat belts are not yet used by all occupants, especial-ly those who perhaps would gain the most from using them, for example young drivers and passengers during nighttime. Pedestrians who are run over often receive unnecessary injuries as a result of the design of vehicles. It is precisely in quantifying how consequences are changed by various measures that most research is needed. This must be coordinated with the information
available from hospitals.
TRAFFIC SAFETY RESEARCH
When investigating the effects of countermeasures there are probably few areas which have attracted as much interest as road traffic, at the same time
as research resources have been limited.
In spite of the relatively comprehensive investigations and the fact that
research has largely been done on the basis of available information not al-ways suited to the problems studied, a considerable amount of knowledge has been gained regarding the background to traffic accidents. This is how-ever often confused with ideas which have no connection with reality and
with results which re ect rather an unsatisfactory investigation methodology rather than the effect on traffic safety. These false truths play a part
which is not insignificant when decisions are made in the road transport sector.
There is, therefore, a body of opinion which has not wholly accepted the
speed restriction system and is above all an opponent to further reductions
in speed limits on roads where most accidents occur. Arguments that one becomes tired when driving at 90 km/h or that it is difficult to overtake
where speed limits are in force are still heard occasionally.
Perhaps the greatest problem is that the effect of many road and traffic
measures and of information and education activities is overestimated by
the use of unsuitable investigation methods or by the absence of possibilities
Investigations in the form of statistical experiments objects selected at random for treatment to quantify the effects of measures are not
accept-ed although practical experiments involving such measures are made without
either checks being made or the desire to obtain information on the real
effect of the measures.
The whole traffic system can be regarded as a gigantic experiment new vehicles and new traffic regulations are all too often introduced without either planning or the intention of evaluating the effects. The discovery is made too late that it would be desirable to quantify the effects, usually because an individual person s suspicion has been aroused.
This unplanned situation often results in retrospective before and after
studies. However, in those cases where action has been taken because of high
accident rates, which is the normal case, it is impossible to eliminate random effects from the effects of the measures regression to the mean effect. This
procedure also means that all control possibilities are eliminated and the con-trol object used must consist of objects which differ from the test object in some essential respect.
Measures are often applied to junctions, drivers and vehicles as though they had an abnormally high number of accidents or a high accident risk. As a result of the problem of the regression to the mean, the number of
acci-dents or the accident risk will be reduced even if no countermeasures are
taken. Many lists of countermeasures often include more random effects
than actual effects.
A before-and-after study of road intersections in Sweden which remained
unmodified during the years 1972 1978 (Table 2), showed that a halving of
the number of personal injury accidents may be expected to be due simply to regression to the mean (Briide and Larsson, 1982). It is not unusual for effects of this order of size to be reported in before and after studies of countermeasures.
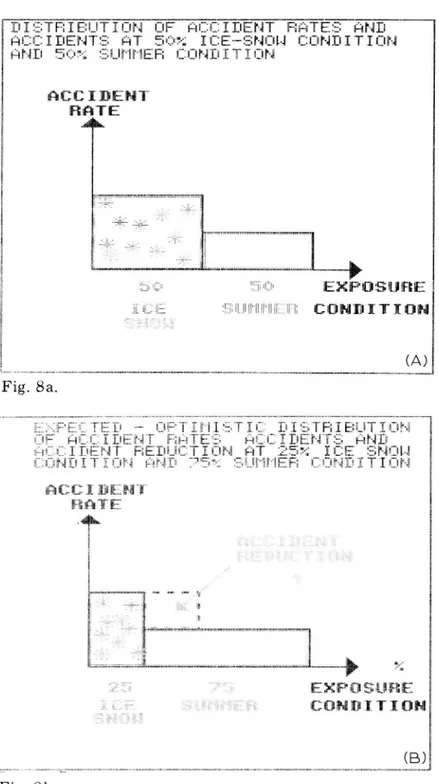
Finally, I shall give an illustrative example regarding road conditions and
traffic safety in winter (Andersson, 1978). Ice and snow on the road are a
TABLE 2
Regression to the mean injury accidents at intersections Sweden (Figures in ( ) are
exposure adjusted)
Number of No. of accidents per Average no. of accidents per Change (%) intersections intersection during intersection during equivalent
in group before period after period
2039 0 (0) 0.19 Increase
441 1 (0.85) 0.42 ( -51)
119 2(1.70) 0.71 ( 59)
24 3(2.56) 1.33 ( 48)
14 4.143(3.53)a 1.50 ( 57)
problem for all road users. The occurrence of ice and snow can be reduced
by spreading salt, which is expected to bring down the number of accidents.
Figure 8A describes a situation where half the traffic uses roads affected by ice and snow while the other half uses roads free of ice and snow during a
given period of time.
The accident rate is twice as high under conditions of ice and snow com-pared with roads free of ice and snow. Two thirds of the accidents occur under conditions of ice and snow.
If salt is used it is possible to eliminate half the ice and snow conditions.
DIETFIE_TIHH DF HCCIDEHT HHTEE HHD HHFIIETT HT 59% ICEmSHDH CBHDITIDH HHD 5C'H "gUMHEH EDHHITIDH HBCIMEHT HHTTZ
e
www
EMPDBMHE
_???"
wwwwmw CHHHITIDN
. (A) F g.8alwrttliu
wvnwgrwruii_r iaurion
UsHnniriur hurt
riturg_mwnm
«w Iftlll rEi TKH%ltlrgem; luh.t MgM
unriiiun but H&M r:mnman MUMMITIUH
amminmwr
warn
mm
% & {EM3:
vw
EMPMHMM£
iii.
wwwrw;
CUMMITIUM
( B )EHPECTED _ PESSIHISTIC HHD EHFIHICHL DIETHIBUTIDH DF HCEIDEHT HHTE RHD MECIBEHTS RT 25% IBEmSHUH CDHDITIDH MHF ?SH HUMMER CDHDITIUH HEEIBEMT H TE NU CHHHBE IH mm In ut:: i:; I 13: E H T 5 mm: _... 1-3! 15'- .: _ '_'. ; . _ ; 51 i? WWE EHPHHUHE __ TWWWWHM CUHMITIUN (C) g8o
Assuming that the accident risks are unchanged the result shown in Fig. 8B is obtained.
The investigations show, however, that reality is different (Fig. 8C).
The risk has increased by 50% under ice and snow conditions, which
means that the number of accidents is unchanged. These results have led to
an experiment being made with unsalted roads in Sweden, although on a modest scale. The results indicate that when the existence of ice and snow is
reduced the accident rate increases on the remaining parts of the roads with
ice and snow.
COST BENEFIT ANALYSIS IN THE EVALUATION OF THE EFFECTS OF COUNTERMEASURES
When undertaking cost benefit analysis, the road transport sector forms an interesting area. Traffic planning often relates to the expected accident costs, travel time costs and vehicle costs when illuminating the benefit of a new road or road improvement. However, I will not enter here into the evaluation problems arising mainly from accident and travel time costs.
In order to demonstrate society s valuation, a figure of S. Kr. 8 million is used for every person killed, 400,000 for every person severely injured and
150,000 for every person slightly injured. In reality this means that almost
half the calculated accident costs are associated with fatalities.
The cost benefit analysis is used both to create a priority ruling between
different road projects and in conjunction with different road maintenance strategies.
Measures which alter vehicle speeds are of special interest here, since all costs can be related to speeds. They also include the present speed restriction
systems Which indirectly form the background to the relationship between accident and travel time costs.
For society as a Whole the above-mentioned cost benefit models must, however, be supplemented With other unquantified effects, such as
em-ployment, regional politics etc., Which means that priority rulings are often invalidated. I believe that the latter problems coincide to a great extent With problems of research into occupational accidents and the consequences of
these accidents for society.
REFERENCES
Andersson, K., 1978. Chemical de-icing of roads effects on road accidents. Report 145, VTI, Linköping.
Briide, U. and Larsson, J., 1982. The regression-to-mean effect Some empirical examples concerning accidents at road junctions. Report 70, VTI, Linköping.
Nilsson, G., 1981. Traffic safety in terms of accidents, injuries, risks and consequences
a multidimensional method for the description of traffic safety situations. Ninth IRF
World Meeting, Road Design and Safety. Stockholm 1981.
Nilsson, G. and Thulin, H., 1982. A description of the traffic safety situation based on
patient statistics from the National Welfare Board. Report 237, VTI, Linköping.
Thulin, H., 1981. Traffic risks for different age groups and modes of transport. Report 209, VTI, Linköping.