Media sharing network functions to
enhance user participation.
A qualitative study in a media sharing network regarding user participation for social connection.
Main Subject area:Informatics Author:Eun Ah Kim & Renate Sjövik Supervisor:Ida Serneberg JÖNKÖPING2021 June
This final thesis has been carried out at the School of Engineering at Jönköping University within [see main field on previous page]. The authors are responsible for the presented opinions, conclusions and results.
Examiner: Ulf Seigerroth Supervisor: Ida Serneberg
Scope: 15 hp (first-cycle education)
Abstract
This study has researched which function contributes to user participation for social connection amongst 18-34 year olds in a media sharing network system. Previous studies indicated that users are seeking ways of participating with media sharing networks functions such as hashtags, image captions, and reposting as some examples. Further motivations for participating was to feel a social connection that would be an alternative to face-to-face communication. This study explored further interactive functions in media sharing networks which have not been researched and if these functions can lead to social connection.
Through this research, a qualitative method including interviews and surveys were implemented. Proceeding with open-ended questions, we could obtain a deeper understanding of participants' motivations and further collected qualitative data. The research result shows that users are not participating for social connection but rather motivated to participate depending on ease of use, entertainment value, and instant response. These factors were represented in functions such as poll and quiz.
Moreover, the result of the study shows that users are influenced by others actions and the social relationship that they have with the sender when interacting with functions.
Limitations of this study were considered due to the selective demographics of 18-34 year olds living in Jönköping, Sweden. A diverse demographic provides further research in regards to different cultural perspectives within participation in media sharing networks. The research is limited to the media sharing network Instagram and thus further study on different kinds of media sharing network will provide broader and deeper understanding on user participation in media sharing networks.
Keywords: User participation, Social connection, Media engagement, Media sharing
Table of content
Abstract
ii
Table of content
iii
1 Introduction
5
1.1 BACKGROUND 5
1.2 PROBLEM STATEMENT 6
1.3 PURPOSE AND RESEARCH QUESTIONS 7
1.4 SCOPE AND LIMITATIONS 8
1.5 DISPOSITION 8
2 Method and implementation
9
2.1 DATA COLLECTION 9 2.1.1. MOCKUPS 9 2.1.2 INTERVIEWS 10 2.1.3 SURVEYS 13 2.2 ETHICS 14 2.3 DATA ANALYSIS 14
2.4 VALIDITY AND RELIABILITY 15
3 Theoretical framework
173.1 THE PARTICIPATORY CULTURE MODEL 17
3.2 SOCIAL CONNECTION WITHINSOCIAL PRESENCE 17
3.3 MEDIA ENGAGEMENT 18
3.4 USES& GRATIFICATIONTHEORY 18
3.5 USABILITY& FUNCTIONALITY 19
3.6 HERD MENTALITY 19
3.7 GROUNDED THEORY STUDY 19
3.8 SUMMARY 20
4 Results
21
4.1 INSTAGRAMACTIVITY 22
4.2.1 PREFERED FUNCTIONS IN TERMS OF INTERACTION 23
4.2.1.1 MOTIVATION 24
4.2.2 PREFERED FUNCTIONS IN TERMS OF SOCIAL CONNECTION 24
4.2.2.1 MOTIVATION 25
4.3 CODINGINTOCATEGORIES 26
4.3.1 OPEN CODING 26 4.3.2 AXIAL CODING 27 4.3.3 SELECTIVE CODING 27
5 Discussion
29
5.1 RESULTDISCUSSION 29 5.2 METHODDISCUSSION 306 Conclusions and further research
32
6.1 CONCLUSIONS 32
6.2 FURTHER RESEARCH 32
7 References
34
1
Introduction
1.1 Background
A Social Networking Service (SNS) system refers to users interacting through their own profile with other profiles on a SNS platform such as Instagram, Twitter, Facebook & LinkedIn (Kenton, 2020). Within the SNS systems, there are different types of platforms such as social networks, media sharing networks and discussion forums (Foreman, 2017). Media sharing networks provide the possibility for users to create contents and share them with others whereas social networks create relations with shared contents among users (Foreman, 2017).
We see a shift in media sharing networks, where participation and interaction arises as a preference from users, and research shows us that two-way communication between senders and receivers is highly important in today's social media society (Calabrese & Hether, 2020). Based on the participatory model, the shift indicates that users now want to contribute by participating and engaging with content (Fuchs, 2017). When we define participation in a media sharing network, we define it as users engaging with functions provided by media sharing network systems such as hashtags, likes, and shared content as some examples.
It should further be noted that users engaging in a media sharing network can be defined in many ways. Engagement has been defined as a state of mind where users feel a sense of enjoyment with a high degree of involvement (Syrdal & Briggs, 2018). Within engagement there are different disciplines which range from user engagement, media engagement, brand engagement as some of the examples (Syrdal & Briggs, 2018). User engagement is referred as an engagement in computer-mediated activities (Syrdal & Briggs, 2018). Syrdal & Briggs further explained that brand engagement describes how the brand is entrenched in a person's identity and the brand loyalty to one's favorite brand (2018). Media engagement is relevant considering that it is defined as described by Syrdal & Briggs (2018) as being connected and feeling involved in a media sharing network. The difference between the various
engagements lay on the users intentions, and their motivations of why they proceed to use a media sharing network (Syrdal & Briggs, 2018). We aim to narrow down to media engagement when talking about user participation and engagement in a media sharing network since users willingness to participate depends on their media
Previous study demonstrates that users participate in a social network application to feel connected. It shows that immediate access to other users and a desire to
communicate was a strong motivation to use the application (Xu et al., 2012). Where we previously established human connection via face-to-face meetings or phone calls, we have in the present time taken to media sharing networks to interact and connect with others (Chan, 2016).
Media sharing network systems include platforms such as Youtube, Snapchat, Instagram and Tiktok. Amongst them, Instagram has gained a great amount of popularity as a photo/video sharing network. Amongst participants using Instagram, over 62% of total Instagram audiences are aged 34 years and younger (Tankovska, 2021). In recent years, Instagram has implemented new features such as Instagram Story and this has led Instagram to achieve higher user engagement than other platforms (Buryan, 2018). Its engagement rates are 58% higher than Facebook’s and 2,000% higher than Twitter’s (Jolly, n.d.). This can be interpreted that there has been more user interaction, since engagement rate is by its definition the formulate to measure the amount of interaction which social contents earn (Sehl, 2019). After comparing various social media platforms such as Facebook and Twitter, we have come to the conclusion that Instagram is superior in terms of measuring user interaction.
Instagram Stories, one of the ephemeral social media platforms that disappears after 24 hours, has grown rapidly reaching 500 million daily active users in 2019
(Tankovska, 2021). Instagram Stories provide users with their own advanced
engagement functions such as poll, slider, questions and quiz stickers so that users can participate more on story contents. Such functions and interactions can be found on Instagram Stories. With higher user participation and its interactive functions, we can use Instagram stories as a media domain in our methodology to analyse and
understand user participation within a media sharing network to further explore participatory functions.
1.2 Problem statement
Klostermann et al. (2018) have in their research looked further into the participatory culture in the media sharing network Instagram, and how user-generated content (UGC) has led to consumer experience and interaction with brands. Through hashtags, image captions and reposting on Instagram, users have established one form of
participation with brands. The study provides an insight into how consumers interact and perceive a brand by using UGC but further features on a media sharing network
such as Instagram and specifically Instagram Story, which could be discovered as another way of participating with a brand, is not spoken of. We have yet to gain knowledge regarding if there is a more efficient, and satisfactory way of participating without the users having to produce the content themselves in today's media sharing network where previous studies showed that interactions matter (xu et al, 2012).
There have been researches on social presence and connection in the context of social commerce, online learning communities or a social networking application such as Twitter (Lu et al., 2016 ; Caspi & Blau, 2008 ; Han et al., 2015). However, further research on media sharing network functions and social connection is lacking since these functions are relatively new phenomena and this gives us opportunity to further investigate the given subject. While previous study has shown the importance of connecting with other users in media sharing networks (xu et al, 2012), we have yet to know in what way the users prefer to interact in order to achieve the social
connections. To further establish if users, through various media sharing network functions provided by the applications, can achieve social connections through participating in a media sharing network. Conducting further studies is essential to gain knowledge of how users on media sharing networks seek to interact with contents in order to gain social connections.
A great amount of research regarding user participation has been studied in social networks such as Twitter and Facebook (Han et al., 2015). However, research on a media sharing network such as Instagram in terms of user participation and social connection is lacking despite its high engagement rate and advanced interaction functions, something we previously established that users strive for in order to feel a social connection.
1.3 Purpose and research question
Through previous research we have established that users rely on media sharing networks for social connections and participating in these networks provides a connection between users. Research does however have limitations of how these networks can initiate user participation in terms of specific functions. Thus, the aim of this study is to explore functions of a media sharing network and if these functions can initiate participation leading to social connections. In order to conduct the study, the following research question should be answered:
RQ: Which functions contribute to user participation for social connection amongst 18-34 year olds in a media sharing network system?
1.4 Scope and limitation
The scope of our research aims to focus on the demographics of participants between ages of 18-34, who are participating in the media sharing network Instagram. The age group has previously been established through research as the most active age group on the media sharing network Instagram (Tankovska, 2021). Furthermore, the
research will be conducted on participants who are living in Jönköping, Sweden as the research does not aim to study cultural differences depending on different locations. This research mainly concerns a media sharing network, Instagram. Thus, other media sharing network applications will be excluded in order to make the research feasible. We will only explore the functions given by the media sharing network which are necessary to our research.
The study does not entail the benefits of Instagram participation from a marketing point of view, nor does it entail additional behavioral reasons for participating in a media sharing network.
1.5 Disposition
Chapter two includes this study’s method approach and design, necessary to collect data and answer our research question. Chapter three follows the designed theoretical frameworks suited for our study. Chapter four provides the result collected from the method, presenting the data and the analysis. Followed by chapter five, where discussion of the result together with implications and limitations are included. The conclusion and further research is established in chapter 6.
2
Method and implementation
In order to answer the research question, a qualitative method including interviews and surveys are employed. Qualitative research is used to understand issues or particular situations by investigating the perspectives and behavior of people in certain situations and the context within which they act (Kaplan & Maxwell ,1994). Furthermore, when data is quantified, the goal of understanding a phenomenon from the perspective of the participants and its particular social context is largely lost (Kaplan & Maxwell ,1994). In qualitative research, open-ended questions are asked which makes it possible for participants to further answer and expand questions themselves, leading to further explore answers and possibly provide new data (Gaille, 2018). A qualitative method also provides an understanding of participants' attitudes through open-ended questions (Gaille, 2018). Thus, providing an understanding of why participants' attitudes may change while participating with different media sharing functions on Instagram.
2.1 Data collection
The research method starts from creating Instagram story based mockups. To provide a realistic point of view and to secure reliability, we created a brand profile and mockup contents with different functions. By controlling the participant’s view, we can in a justified way establish reliable data rather than having the participant paint the picture in their head. When we for example ask a participant whether they would rather participate with another user's poll or slider, each participant would have a different view of how this would look based on previous experiences. We therefore ensure each and every participant has the same view of how these functions look like by creating these mockups in order to ensure valid data.
2.1.1. Mockups
When creating our mockups we had to take into consideration that the content we created had to be neutral in terms of gender and age in order to avoid biased results or opinions. This is vital since we previously established that the mockups and brand itself are not relevant for our study, considering that we are only measuring the functions of Instagram stories and the correlation between participants and these functions. Millennials and Gen Z have been established through research as the generations seeking most gender neutral marketing and brands (Ma, 2020). This is important in our study since our target group is 18-34 year olds of all genders, and thus having a gender neutral brand could affect the result of the participants' answers less than with a brand who triggers gender differences. Coca-Cola has established through various marketing campaigns as a demographically neutral brand, and is
therefore seen as a product of no gender or age value (Bump, 2019). White Claw is another brand performing well over a large variety of demographics, having gender neutral advertising and packaging design (Ma, 2020). With these similar products in mind, we have chosen to create a brand selling sparkling water, with the aim to create as little biased and pre-stated thoughts as possible in order to mainly focus on our research question and receive trustworthy data.
The main purpose of the mockups is to provide a realistic view of how the functions, even referred to as “stickers”, in a media sharing network such as Instagram stories would look like, in order to collect valid data suitable to answer our research question. Making our own mockups gives us control in the interview and survey process,
focusing on what is important rather than misleading participants with unnecessary or irrelevant information. Our mockups focus on the 5 defaulted functions: polls,
question, slider, countdown and quiz. These functions can be used to drive engagement and for users to interact with other users (Read, n.d) Through these functions we aimed to further explore our research gap and see if they can contribute to user participation.
We took into consideration that the participants may have biased opinions or answers depending on the mockups. We aimed to decrease the limitations by having controlled mockups. However, we can not control previous experiences and opinions amongst participants and took this into consideration when analysing the data.
2.1.2 Interviews
There are three interview methods: structured, semi-structured and unstructured interviews. In this study, semi-structured interviews were implemented. The structured interview is where the interviewer asks participants pre-established questions and it deviates as little as possible. All participants are asked the same questions in the same order to elicit brief answers (Qu & Dumay, 2011). At the other end of the continuum of interview methods, there is the informal, unstructured interview. In unstructured interviews, interviewers do not use any set of questions, instead, the interviewer asks open-ended questions based on a specific research topic, and tries to let the interview flow like a natural conversation (McLeod, 2014).
Semi-structured interviews lie in between structured and unstructured interviews. Semi-structured interviews are guided by a strict set of questions with possibility for follow-up questions related to participants’ answers (Williamson, 2002).
Implementing semi-structured interviews helps this study since the interview method is flexible, allowing follow-up questions, therefore more accurate in-depth responses
can be obtained. Moreover, it is easy to duplicate hence we can ensure the reliability of the research by implementing this interview method.
Some considerations to be aware of when interviews are constructed are that
interviewers should be neutral so that they do not influence participants' responses but at the same time, empathetic and enthusiastic so that participants are encouraged to express their genuine opinions (Williamson, 2002). For better analysis of the
interview, we recorded the interviews and got consensus from participants before the interview.
A study found that there is little rigor in justifying sample size in qualitative research and often the number of interviews in qualitative studies is correlated with culture factors, implying subjective nature of sample size in qualitative research (Marshall et al., 2013). Throughout the examination it was suggested that grounded theory
qualitative studies should generally contain 20-30 participants. As this research is is implementing the grounded theory method as data analysis, the research of Marshall et al (2013) has been considered regarding sample size. Based on the research and feasibility, we aim to interview 8-10 adults between the ages of 18-34. The age group has been selected through statistics providing that over 62% of total Instagram audiences are aged 34 years and younger (Tankovska, 2021).
Regarding recruiting interviewees, we approach our personal networks and acquaintances through social networks application messages. Recruiting
acquaintances can be beneficial since interviewees can be more relaxed and express their honest opinion. A rapport between researchers and interviewees is already built, so in-depth answers about feelings and thoughts can be received. On the other hand, it also has its limit as interviewees can be biased. They might try to answer in favour of researchers. Therefore, we tried to be as neutral as possible so that interviewees can answer what they actually think. Most of the interviewees are students at Jönköping University who are tech-savvy and have knowledge on social media.
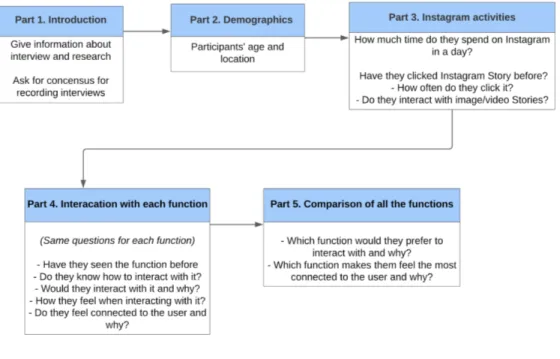
Figure 1. Interview structure
The interview questions are designed mainly into 5 parts: introduction, participants’ demographics, Instagram activities, interaction with a specific function and
comparison of all the function types. Firstly, the purpose and of the research and process of the interview are introduced to interviewees. Participants’ consensus for recording interviews is asked in this part. In the second part, we ask participants' age and the location they are living. Having information about demographics is important as we need to ensure that participants belong to the scope of our research.
Furthermore, we request the information only required for the research to be ethically correct. In the third part, we ask about their Instagram activities, asking how much time they spend on Instagram in a day and if they have interacted with Instagram Stories before. Since the media engagement theory indicates that users’ willingness to participate depends on how active they are, we would like to investigate the relation between being active on Instagram and intention to participate. In the fourth part of the interview, we ask questions about interaction with 5 function types. A mockup of a function is shown at a time and participants are asked to answer if they have seen it, if they know how to use it, if they would like to interact and why, as well as how they feel when interacting and if they feel connected to the user. Finally, We ask among 5 functions which function participants would like to interact with the most and which function participants feel the most connected to the user.
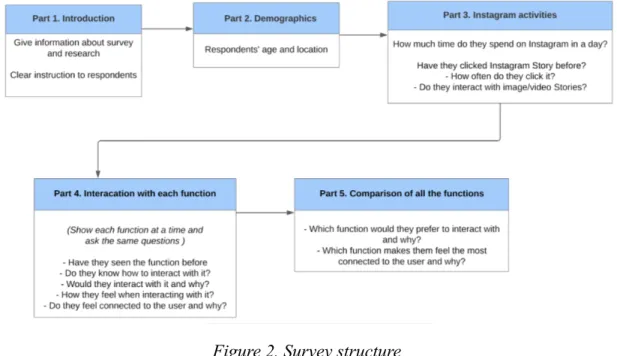
2.1.3 Surveys
Surveys are fixed sets of questions that can be administered by paper and pencil or a Web form (Harrell & Bradley, 2009). After conducting interviews, we briefly looked into collected data from interviews to find an improvement in questionnaire for a survey. With some improvements and adjustment to a survey format, questionnaires for a survey have been formed. The data collected from interviews and the survey were analysed together after data collection was finished. By implementing surveys after interviews, we can get a larger amount of in-depth data and ensure validity. Due to its nature to be distributed widely, we aimed to collect answers from the same age group, with a response rate of 30-50 people. The response numbers have been calculated based on feasibility, and the number we believe is vital to receive enough data for a reliable conclusion.
In order to design a survey, there are few guidelines to consider which are to make questions and instructions clear and easy enough for respondents to understand and to provide consistent response options for example, the range of numbers (1~7) or boxes to check throughout the survey (Williamson, 2002). We utilized google form so that respondents can easily access. The questions are grouped logically into 5 parts and use consistent response options. The survey also includes open-ended questions to enable respondents to express their opinion precisely. Each question is short and simple. Furthermore, there is a clear instruction at the beginning of the survey.
The survey has a similar structure as interviews but with some adjustments of questions after the interview. It consists of 5 different sections : introduction, participants’ demographics, Instagram activities, interaction with a specific function and comparison of all the function types. In the fourth part, where we investigate specific functions and interaction, each function is shown in a page so that respondents are not confused with other functions.
In order to receive a larger sample size, we turned towards social networks such as Facebook. We aimed to publish the survey through personal networks as well as relevant groups targeting our demographics. As previously stated in our interview section, we may encounter biased answers depending on our relationship with the participants. We shared our survey amongst people we were not acquainted with in order to avoid these biases and possibly reach participants with a different mindset than ours. This is important considering that the people in our social network may have a similar mindset to ours, which provides a less reliable result. The negative aspect is that we can not control the demographics answering the survey and thus know if the sample size is 100% accurate or if participants lied when asked for questions such as demographics. We therefore believe combining survey and interview data provides more validity.
2.2 Ethics
In order to conduct ethical research, some important ethical concerns that should be taken into account are: anonymity, confidentiality and informed consent (Sanjari et al., 2014). Participants should remain anonymous and their information have to be confidential, be used for only research purposes and be deleted within a reasonable time. Furthermore, consensus is needed for any form of recorded contribution during the interview. We tend to further keep an ethical research process by providing information about the purpose of the study and highlight that participation is not mandatory.
2.3 Data analysis
Data collected has been qualitative, and we therefore take a qualitative data analysis approach when we interpret and gather the data. Grounded theory method was implemented in our data analysis as it gives us the possibility to narrow down codes to further see connections between the code and to find the core knowledge to answer our research question. We initiated this approach by putting the transcribed data into
categories based on the codings to see correlations in the answers.
When analysing our data, our analysis method is based on the following process: (1) Transcribe the raw data, (2) Familiarize ourselves with the data, (3) Categorize the data (Williamson, 2002). These three steps are essential for us to understand, organise and evaluate the data provided through interviews and surveys.
Transcribing our data is essential for understanding the recordings and organising the data. In order to receive a clear view of the data collected during interviews and surveys, we can write down the answers of the recordings and the answers from the interviews and surveys, and in the process interpret and understand it. Familiarizing ourselves with the participants' answers is beneficial in terms of understanding the participant answers and if the answers correlate with the research and research
questions. By reading and re-reading our material collected, we can establish relevant data for our research question. We followed this by summarizing the important parts of the data collected to receive a greater understanding of the relevant material. Categorizing our data for both interviews and surveys is an important step for us to take in order to understand the data further, see correlations between categories and retrieve the most important parts. In order to categorize our data, we use the grounded theory method suitable for qualitative data. The method includes open coding, axial coding and selective coding in the process of analysis (Corbin & Strauss, 1990). Firstly, we started with open coding. Transcribed data from interviews and surveys was put into individual codes that were labeled, opening up for a new theoretical possibility. We implemented the method in order to find similarities in codes so that we can further establish a notion. Secondarly, we moved into axial coding where we defined connections between the codes in order to divide the codes into relevant categories. Lastly, we implemented selective coding to connect the categories together to develop one core category. Through this final process we can either find new knowledge or modify already existing knowledge within the field of informatics.
2.4 Validity and reliability
We can ensure reliability when being consistent with the execution of our interviews and surveys. We asked questions the exact same way each time, and provided the exact same instructions to the participants, to ensure that the outcome can be the same. Throughout our interviews, we were in the same room with the same amount of interview time, asked the questions in the same order and provided the same
additional reliance when analysing data. We have previously stated that creating our own mockups leads to further reliability due to each individual participant
experiencing the exact same content, and if the study would be conducted again, the participants would receive the same content.
Before collecting data that is the base for our methodologies, we ensured the research and data collected are valid. We looked into how data has been collected and whether or not the result is reliable and valid. To provide validity through surveys and
interviews, we also considered the participants' demographics, making sure the respondents and interviewees are in the same range group. We believe a changed demographics could affect the result and thus put a big focus on collecting data from our targeted demographics. Questions in interviews and surveys are formulated only to ask what is necessary to the research.
3
Theoretical framework
We have established relevant frameworks based on previously gathered research necessary to collect further data to receive a deeper understanding of our research aims. The frameworks were taken into account when forming our execution of study and when we analyse our collected data.
3.1 The Participatory Culture Model
The theoretical framework we took into consideration when exploring our theory is the social media participatory culture model. Participatory culture on social media is about the involvements of users when creating content (Fuchs, 2017). According to Fuchs (2017), the participatory culture model can be seen as a mass media tool where there is one sender and multiple recipients, and that even today these recipients will not only watch but also contribute by creating their own content. Fuchs (2017) brings up Henry Jenkins and how he highlights the importance of shareable content, and if it is not spread then it is dead content. Through this framework we can moreover research whether users experience a contribution through participation with functions of a media sharing system. We have used this theory during our data collection to understand whether users want to participate with engaging content and further to research which content can contribute to user participation. It is a relevant theory to include in order to explore the correlation between engaging content and the
willingness to participate and further reasoning for participating. With the base of this theory, we explore through our research if users would participate with various functions provided in a media sharing network or not.
3.2 Social Connection within Social Presence
Social connection can be defined with social presence theory. Short et al. (1976) defined that social presence is “the sense of the other in a mediated communication and the consequent feeling of interpersonal interactions. Social presence demonstrates the feeling of being actively engaged in an interaction with others (Durlach & Slater, 2000; Schroeder, 2006). Social presence is related closely to social connection. Research shows that higher social presence can increase users' perceived social connections in computer mediated communication (Han et al., 2015 ; Kreijns et al., 2003). Thus, we defined social connection as the feeling that users perceive to be connected and engaged with others. The theory is relevant to our study since this research aims to investigate the users perceived social connection through interaction with functions. The theory facilitates the understanding and the measurement of social connection. Therefore, the theory is applied to evaluate users' social connection. In the
data collection stage, when creating questionnaires for surveys and interviews, the theory was implemented to ask participants how much they feel socially connected to the user through interaction with a function. Furthermore, it is applied in the data analysis when analysing categories and evaluating if social connection correlates with participation.
3.3 Media Engagement
Aiming for users to engage on social media through various techniques such as users sharing other users' content, commenting or liking content leads to satisfaction, commitment and emotional attachment (Prado‐Gascó et al., 2017). The willingness to engage on a media sharing network impacts if a user has a high participant
satisfaction and is accordingly willing to share an experience (Prado‐Gascó et al., 2017). The framework is relevant when we conduct our study due to the fact that the amount of time spent on social media and the content matter in terms of user
engagement and can therefore affect a users willingness to participate. This has to be taken into consideration when analysing our codes since participants can be more willing to participate depending on their active use of media sharing networks, or depending on the content we provide while conducting our study. We further discuss our result with the base of this theory.
3.4 Uses and Gratification Theory (U&G)
The uses and gratification theory (U&G) is about the motivations behind using media and how individuals use the different channels in social networking systems (SNS) to communicate daily (Korhan & Ersoy, 2016). The theory is specified on users'
reasonings and goals when using for example a media sharing network, and how users participate through interacting with content and other users to fulfill social
connections (Korhan & Ersoy, 2016). Further, creating one's own content for self-expression. Korhan & Ersoy (2016) mentions that the U&G theory shows
different motivations for using a media sharing network such as seeking information, seeking entertainment, social interactions and more. This theory is relevant for our study due to the fact that the theory explains the user being goal-oriented and thus uses media networks in order to fulfill certain requirements and satisfactions (Qiao & Zhu, 2011). This has to be taken into consideration when understanding users'
motivations for participating in a media sharing network. We can further implement this theory in our discussion when analysing categories through our coded data in order to understand if further motivations lead to participants' decision making which eventually leads to gratification.
3.5 Usability & Functionality
Usability and functionality in a SNS application, and more specifically a media sharing network, is defined as the easy and efficient way a product or system can be used in order for the user to reach their goals (Korhan & Ersoy, 2016). It relies heavily on the user being able to carry out a task with success and the feelings that come with it (Korhan & Ersoy, 2016). Satisfaction of using a system is proven with the theory to be highly important for the user (Korhan & Ersoy, 2016). Usability and functionality have also been established to influence users' decision to use a certain media sharing network, and ease of use is specifically important for users in terms of picking a media sharing network (Korhan & Ersoy, 2016). This is a relevant theory to include in our research considering that users' decision making and willingness to participate might be affected by usability and functionality of a media sharing network. The theory is taken into consideration when discussing our result and how participants' action to interact with a media sharing network might be affected depending on the usability of the application. The theory is implemented when discussing our
categories in the analysis stage to support the findings.
3.6 Herd mentality
Herd mentality is a form of convergent social behaviour that can be defined as an alignment of the thoughts and/or behavior of individuals through natural interaction with others (Kameda & Hastie, 2015). It describes how people are influenced by other people to adopt a certain behavior in order to conform with the majority of the group when interacting with others. It indicates the importance of the social influence on individuals’ decisions (Kameda & Hastie, 2015). This framework is applied in the data analysis stage, especially when comprehending participants’ underlying behavioral motivation for interaction. Furthermore, it will be discussed further to address our findings in the research. It is relevant as it illustrates users behavior that we found from the data and enables us to understand the data better.
3.7 Grounded theory study
Grounded theory study is designed to produce or construct an explanatory theory from data systematically obtained and analysed using relevant analysis. Moreover, it is appropriate when little is known about a phenomenon (Chun et al, 2019). Our research question is rather exploratory and therefore the research did not include preconceived theories, rather we aimed to establish new knowledge from the data. In that sense, grounded theory study is suitable for our research. It will be considered in the process of data analysis when we analyse data into codes, integrate them into categories and finally establish the selective code.
3.8 Summary
The Grounded Theory is implemented as a guide for our analysis stage in order to find codes and categories to obtain relevant data in a scientific manner. Usability and functionality as well as Uses and Gratification theory are established in our analysis as two theories relevant to further understand the coded data through participants'
answers. As well as the herd mentality theory to understand participants' underlying behavior for participating with certain functions. The theories are implemented after our initial coding process where we see further correlation between the codes and theories. This is relevant when discussing the motivation behind participation and it enables us to answer the research question. Moreover, we can further back-up the result and motivation with theoretical grounds to explore reasonings behind participating.
4
Results
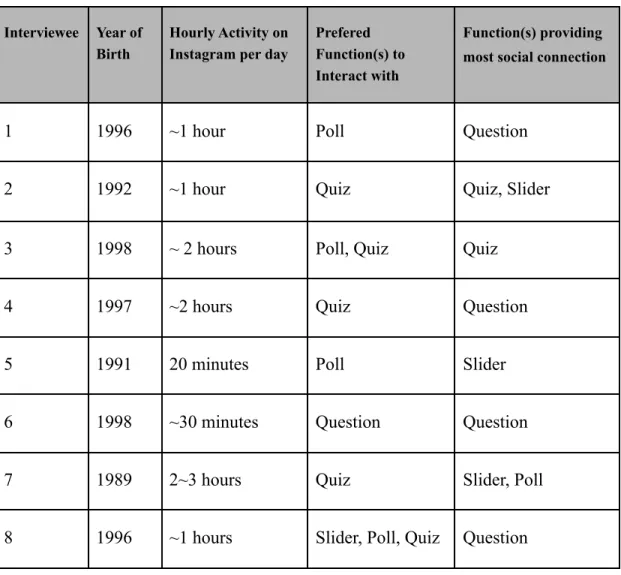
In this research the data was collected from 8 interviewees and 28 survey participants Figure 3-7 show the collected data. Data has first been transcribed and then studied for further understanding of the result.
The study was based on finding prefered functions in a media sharing network in order to initiate participation amongst users, and establishing if this leads to a social connection. The result has been categorized in regards to age, Instagram activity, prefered functions to participate with and functions providing the most social connection.
Interviewee Year of Birth
Hourly Activity on Instagram per day
Prefered Function(s) to Interact with
Function(s) providing most social connection
1 1996 ~1 hour Poll Question
2 1992 ~1 hour Quiz Quiz, Slider
3 1998 ~ 2 hours Poll, Quiz Quiz
4 1997 ~2 hours Quiz Question
5 1991 20 minutes Poll Slider
6 1998 ~30 minutes Question Question
7 1989 2~3 hours Quiz Slider, Poll
8 1996 ~1 hours Slider, Poll, Quiz Question
4.1 Instagram activity
Based on Media engagement theory, we researched participants' activities on a media sharing network, since the time spent on a media sharing network can affect users willingness to participate on a media sharing network (Prado‐Gascó et al., 2017). The time spent on Instagram on a daily basis in the survey is dispersed which can be seen in figure 4. The time participants spend the most is 1-2hours, followed by 0-30 minutes and 30minutes to 1hour; 10 out of 28 participants answered that they spend 1-2 hours and 9 participants said 0-30 minutes. 8 participants responded that they use it between 30 minutes and 1 hour. The result of a question asking how many times participants click on Instagram Stories is quite concentrated. It was found that most of the participants click Instagram Stories 0-10 times a day; 13 participants responded that they click 0-5 times and 8 participants answered 6-10 times. Interview data shows similar answers. As for the time spent on Instagram, the data is slightly different from the survey result. The time period that interviewees answered the most was 30
minutes to 1 hour followed by 0-30 minutes and 1-2hours. For the number of times that interviewees click on Instagram Stories, 0-5 times was the answer that
interviewees answered the most.
Figure 5 - Instagram Activity: “How much time do you spend on Instagram per day?” 4.2 Prefered functions in the media sharing network Instagram
The development of the question regarding user participation in a media sharing network was based on the theory of the Participatory Culture Model. The theory demonstrates the basis of users wanting to participate with content (Fuchs, 2017). We further researched whether participants want to participate with each function and the motivation for participating with functions in a media sharing network. After
receiving a greater understanding whether users want to participate with the content, we proceed by asking which function they prefer to interact with.
4.2.1 Prefered functions in terms of interaction
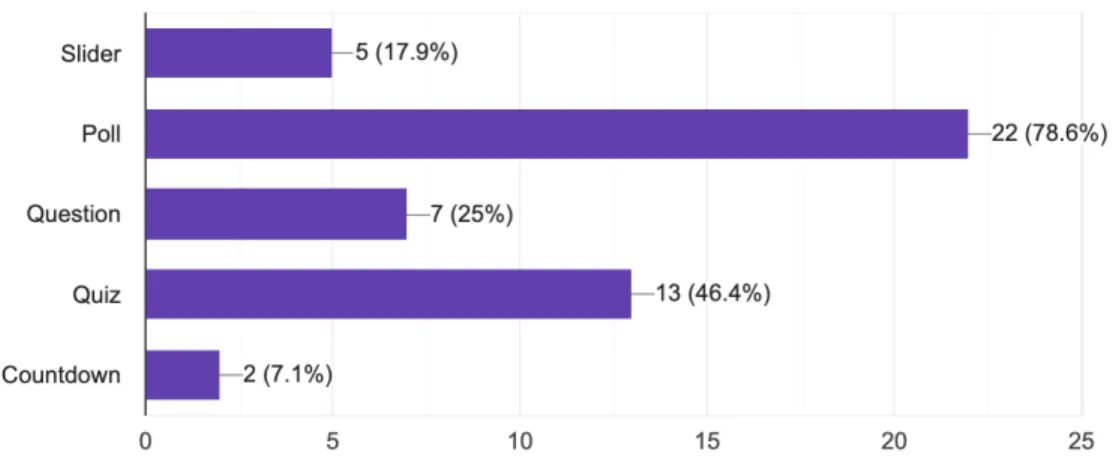
The result of the category about prefered functions to participate demonstrates the clear preference of the participants in the survey. The result can be seen in figure 6 where 78% of the participants chose poll to interact with. Secondly, 46.4% of them chose Quiz. Question, Slider and Countdown followed, accounting for 25%, 17.9% and 7.1% respectively. This is similar to the interview result. The top two answers which got the most votes from interviewees are Quiz and Poll; 5 interviewees voted for Quiz and 4 interviewee for Poll. Question and slider got one vote each.
Figure 6 - Compared Functions: “Out of these 5 functions (slider, poll, question, quiz & countdown), which one would you prefer to interact with?”
4.2.1.1 - Motivation
Interviewee 5 answered that Poll was the best out of 5 functions to interact as it was simple and easy. Interviewee 1 and 8 answered the same. Interviewee 7 and 4 chose the quiz because it’s fun. Interviewee 7 mentioned that she felt like she was playing a game. Interviewee 2 motivated the reason for choosing quiz as the instant response that he got after interacting with the function. Interviewee 3 answered the same as Interviewee 2 for choosing a poll and quiz. This data correlates with the survey result of motivation. The reason for choosing poll is that it’s easy to use. The reason for choosing the quiz is mostly because it’s fun. 4 participants chose both the poll and quiz because they could get an immediate response after interaction. Survey participants who chose question to interact with motivated their choice to have a direct interaction with the user. The reasoning for choosing a slider is it’s quick and easy. One participant did not have preference but all the functions can be interacted with depending on the situations.
The data from interviews and the survey has been extracted and analysed to construct 3 distinct groups: Easy access, entertainment and an immediate response, particularly how other users answer. Participants and interviewees tend to interact with certain functions when it is easy to use, gives users joyment and gives back the response rapidly.
4.2.2 Prefered functions in terms of social connection
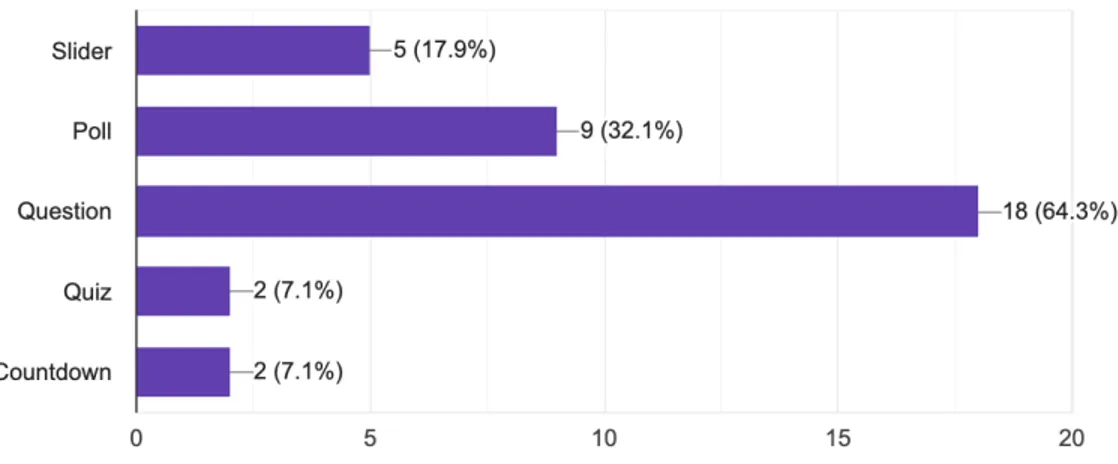
Our category about social connection in regards to the functions shows in figure 7 that 64.3% of the survey participants think the function question provides the most
connection to the user. Out of the interviewees with the option of choosing multiple functions, 4 out of 8 provided the answer question. This number is however the superior amongst the interviewees considering that slider was answered by 3 interviewees, quiz by 2 interviewees and poll by 1 interviewee. Comparing these numbers to the survey, where slider was picked by 17.9%, quiz and countdown by 7.1% and poll by 32.1%, we can establish that the biggest difference lies between the poll where the number was noticeably higher amongst the survey participants
compared to the interviewees.
Figure 7 - Compared Functions: “Out of these 5 functions, which one makes you feel the most connected to the user?”
4.2.2.1 - Motivation
When asking participants during interviews and surveys which functions they felt most connected to the user with, the follow up question of why was asked.
Interviewee 1 claimed that question provides social connection to the user only if answered by the other user. The same reasoning was provided by Interviewee 4, Interviewee 6 and Interviewee 8, saying that they will receive personalized answers. The motivations throughout the survey were similar for the participants choosing the question function. The majority of the participants' motivations were the facts that it was a two way communication and a more personalised communication.
Interviewee 5 and Interviewee 7 motivated the choice of slider as feeling like the user asks more personalized questions and being able to show how much they feel. The participants choosing sliders in the survey argue that it is a way of showing how much they feel, similarly to the motivations provided by the interviewees.
Out of the different data and motivations provided by the participants of the survey and the interviews, we can establish that there are two distinct groups. One group that is motivated by a personalised communication through the question function where one user asks and the other user answers. The other group is motivated by showing how they feel.
4.3 Coding Into Categories
After transcribing our data into numbers, quotes and statements we proceed with coding our transcribed data. The data was put into documents where the collected answers from the survey and the interviews were grouped by each question. We further familiarized ourselves with the data by going through it several times and proceeded with finding relevant keywords to create our codes which we based on the grounded theory.
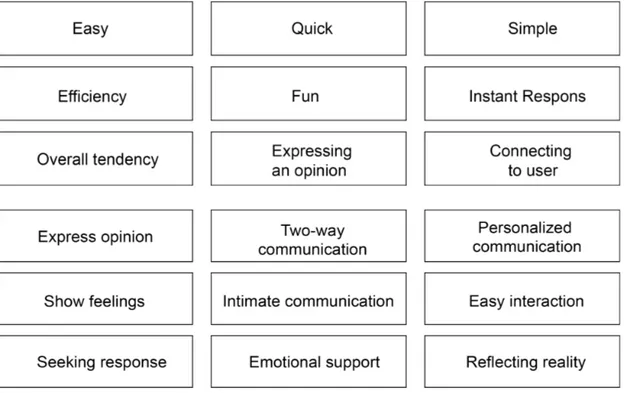
4.3.1 Open Coding
In this stage, we were able to find repeated keywords in participants’ answers specifically in quotes. The answers were summarized in 4.2.1.1 and 4.2.2.1 of this chapter which we then labeled into separate codes. The codes are separated by main questions which were concerning user participation and social connection. For each question we discovered 9 different codes which were presented in figure 8 and were later categorized in the axial coding stage.
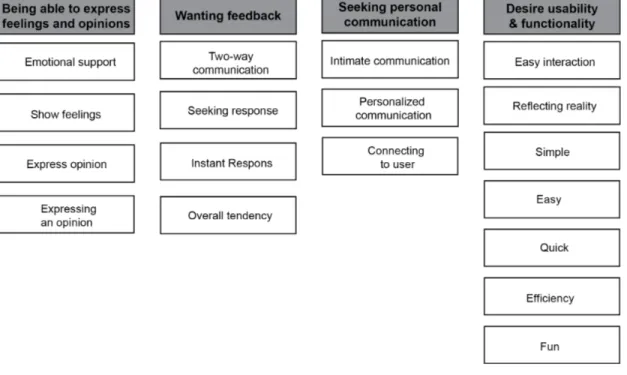
4.3.2 Axial Coding
Through our open coding we proceed by finding correlations between the labels to narrow down the findings and categories the data. During this step we further implemented our theoretical frameworks with the coded data to see correlations between the qualitative data and previous theories. Through axial coding that can be seen in figure 9, we found a phenomenon which is “desire usability and functionality” that could be supported by the usability and functionality theory. This will be further discussed in chapter 5.
Figure 9 - Axial Coding
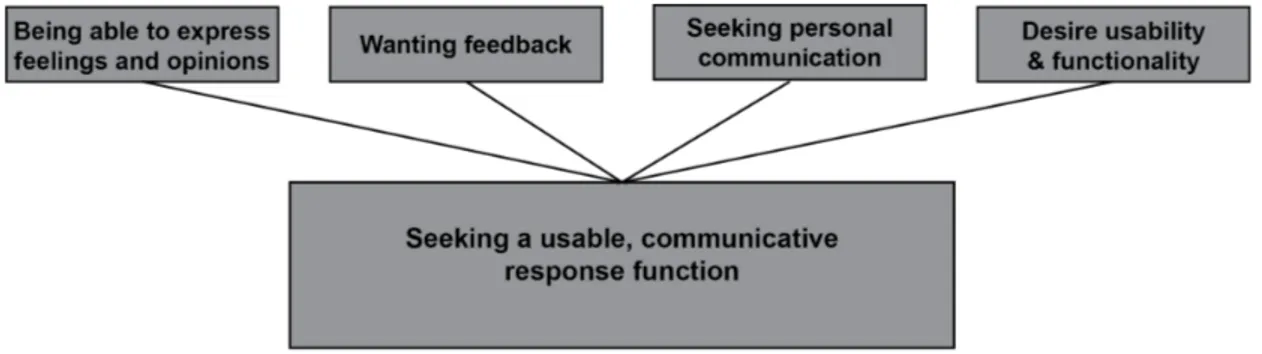
4.3.3 Selective Coding
From axial coding, we formed 4 categories and continued on selective coding where we narrowed down categories into a core category which will answer the research question. We were able to find connections between categories and a bigger idea that captures the concepts in categories. The result of selective coding is presented in figure 10.
Figure 10 - Selective Coding
Through the selective coding, we were able to answer our research question with further understanding of why the function of poll and quiz was the most popular to interact with and question the function that provided the most social connection. Moreover, we acknowledge the correlation between the selective coding and theoretical frameworks. Amongst the frameworks, the Usability and Functionality theory claims that users seek ease of use when interacting with media sharing networks, which can be recognized in our research from our qualitative data.
Moreover, coded data corresponds with Uses & Gratification theory which establishes that users are goal oriented and seek gratification which our data additionally
established through the tendency of users seeking feedback. Finally, We could see the correlation between herd mentality theory and the coded data. Herd mentality
describes the trend in social behavior that people are influenced by others in order to conform with the group norm. The phenomenon was found in our data analysis especially in the category where users seek conformity.
5
Discussion
Through our results and previous studies we establish new findings regarding our research question. In this chapter we will discuss the result from our interviews and survey as well as the method we implement in the research.
5.1 Result discussion
The purpose of this research is to find which functions in a media sharing network that would contribute to user participation, and if participating will lead to social connections. Through our result we have constructed data that speaks for the importance of functionality and gratification when users decide to participate. Through our selective coding we established that users are seeking a usable, communicative response function which can be found in poll, quiz and question.
We established that the majority picked the poll and this was due to the ease of use. This goes hand in hand with the Usability and functionality theory. The theory establishes that the user is relying on carrying out a task and feeling satisfied when completing the task (Korhan & Ersoy, 2016). The data provided in the result shows that users wanted immediate response which corresponds with the theory about usability and functionality.
Secondly, participants chose quiz due to the entertainment value of the function. This correlates with the gratification theory. The U&G model, explored by multiple researchers, hypothesizes that the users have various motivations for using a media sharing network such as seeking information, seeking entertainment, social
interactions and more. Our result indicates that the entertainment value is a big part of users participating in a media sharing network. It is correlated to the research
conducted by Xu et al (2012), which shows that enjoyment and happiness that users perceive impacts the use of social networks.
Xu et al (2012) further established that the desire to communicate was a strong desire for using a media sharing network. However, our result provides little to no
connection between users' choice of function to participate with and the function chosen as providing most social connections. Through our result, poll and quiz contributed to user participation the most. Nonetheless, question was the function where users felt the most social connection. Through this result we can speculate whether users' motivation for participating in a media sharing network provides an entertainment value and usability rather than a social value.
The data from the participants in the study also shows that participants' actions when interacting with a media sharing network are affected by other users' answers. Users being curious about what other users answered, whether they are in the majority or minority when interacting with a function, receiving instant response and the
relationship to the user on the other end proved to be of high value. This is correlated with the herd mentality theory.
Through previous study it has been established that the willingness to participate increases depending on how active a user is (Prado‐Gascó et al, 2017). We can see in our result that their time spent on a media sharing network does not necessarily initiate the willingness to participate. Regardless of the time spent on a media sharing network, most participants were still willing to participate with various functions.
5.2 Method discussion
Through the collected data and by basing on the theory of Media Engagement we could establish that content mattered to the participants. Having a fictional brand therefore affected some of the participants' answers, and a common statement in the interview process was that participants would interact differently depending on the receiver. The willingness to participate was greater when there was a close
relationship between the participant and the sender. We could therefore have explored more options in regards to our mockups and collected extended data regarding the importance of the relationship between the users. The decision to choose a neutral brand for our study was however based on eliminating biased results and providing reliability. This would have been more difficult to control if we would have based our mockups on personal users, providing little reliability due to the result being difficult to replicate. The social context would be a matter of influence when collecting data, risking a higher chance of biased answers and thus providing less validity.
For the survey, we formed our questionnaires with multiple open-ended questions. That might have caused fatigue for several participants to answer. We could have more simple multiple choices to facilitate users' answers. However, in order to get in-depth data, questioning why they would answer the question in an open-ended question was necessary.
It is further to be noted that collecting data through a different media sharing network would generate a different outcome. Through various platforms, users tend to have
different motives and as a result provide different levels of participating and reasoning behind participating. We believe collecting data through the media sharing network Instagram works well when answering our research question since we measured the level of participation with interactive functions.
In order to obtain a more neutral result, we could recruit interviewees that we do not have any acquaintance with by announcing in a school or local community. This would eliminate possible biased answers that we have by recruiting our acquaintance.
6
Conclusions and further research
Through previous research combined with a qualitative data collection from interviews and surveys, we have answered our research question “Which functions contribute to user participation for social connection amongst 18-34 year olds in a media sharing network system? ”.
6.1 Conclusions
We mentioned that there has been a shift in a media sharing network, where social connection through participation is seeked by users. We established that there is a lack of research when it comes to participating in a media sharing network such as
Instagram Stories and further researched in what way users prefered to participate and if there was a correlation between user participation and feeling socially connected. Nonetheless, the result shows a weak correlation between user participation and social connection in the media sharing network Instagram, specifically Instagram stories. Users were rather motivated by a usable, communicative, and response function. We can conclude that there are more underlying motivations for user participation rather than a social connection. Depending on which function the user prefered to participate with, the underlying motivation varied. Poll provided usability and quiz was
associated with the entertainment value. These motivations were combined with users wanting to see the majority's answers and the motivation to participate further was impacted by the relationship between the receiver and sender. In conclusion we can see that multiple factors determined the willingness to participate, and few of them were determined by feeling a social connection.
6.2 Further research
Our research expanded the knowledge in informatics by bringing existing theories that have been applied to other fields to a media sharing network which has not been studied yet. We have through our research established that users are seeking a usbale, communicative response function. However, our research provides little to no
connection between users' motivation to participate in correlation to social connection. Further research is suggested to understand the social behaviours and motivations to participate for social connection, and if users are more motivated to participate for entertainment purposes or social purposes. Within the field of
informatics, it is important to further study users' motivations and behaviours towards media sharing networks to fulfill users needs.
18-34 years old and living in Jönköping, Sweden. Therefore, further research on a broader range of demographics might provide additional knowledge. Moreover, it will be useful to further investigate different types of media sharing networks such as TikTok and Snapchat to explore if users are motivated to participate for social
connection. To even further expand the area within social networking systems (SNS), further studies on other types of SNS platforms such as social networks can be conducted.
7
References
Bump, P. (2019, Nov 12). 7 Brands That Got Inclusive Marketing Right. HubSpot.
https://blog.hubspot.com/marketing/inclusive-marketing-campaigns
Buryan, M.(2018).Instagram Engagement:Everything You Need to Know. socialbakers.https://www.socialbakers.com/blog/instagram-engagement
Caspi, A., & Blau, I. (2008). Social presence in online discussion groups: testing three conceptions and their relations to perceived learning. Social Psychology of Education, 11(3), 323–346. https://doi.org/10.1007/s11218-008-9054-2
Chan, M. (2016). Maslow’s Model as Applied to Social Media. Medium.
https://medium.com/@MarshaChan/applying-some-psychology-to-social-media-9deb 505f678
Chun Tie, Y., Birks, M., & Francis, K. (2019). Grounded theory research: A design framework for novice researchers. SAGE Open Medicine, 7,
2050312118822927–2050312118822927. https://doi.org/10.1177/2050312118822927
Corbin, J., & Strauss, A. (1990). Grounded theory research: Procedures, canons, and evaluative criteria. Qualitative Sociology, 13, 3-21.
Durlach, N & M. Slater. (2000). Presence in Shared Virtual Environments and Virtual Togetherness. Presence, 9(2), 214-217. https://doi.org/10.1162/105474600566736
Foreman, C. (2017). 10 Types of Social Media and How Each Can Benefit Your Business. Hootsuite.https://blog.hootsuite.com/types-of-social-media/
Fuchs, C.(2017).Social Media a Critical Introduction. SAGE Publications Ltd.
Gaille, B. (2018). 25 Advantages and Disadvantages of Qualitative Research.
Han, S., Min, J., & Lee, H. (2015). Antecedents of social presence and gratification of social connection needs in SNS: A study of Twitter users and their mobile and
non-mobile usage. International Journal of Information Management, 35(4), 459–471. https://doi.org/10.1016/j.ijinfomgt.2015.04.004
Harrell, M., & Bradley, M. (2009). Data Collection Methods: Semi-Structured Interviews and Focus Groups. RAND Corporation.
Hether, H., Calabrese, c. (2020). Chapter 13 - Beyond liking: Inspiring user-generated content for health promotion. Technology and Health Promoting Attitude and
Behavior Change, 291-312.https://doi.org/10.1016/B978-0-12-816958-2.00013-7
Holly A. Syrdal & Elten Briggs. (2018). ENGAGEMENT WITH SOCIAL MEDIA CONTENT: A QUALITATIVE EXPLORATION. Journal of Marketing Theory and Practice, 26:1-2, 4-22, DOI: 10.1080/10696679.2017.1389243
Jolly, W. (n.d.). The 6 Most Effective Types of Social media Advertising in 2021. bigcommerce.https://www.bigcommerce.com/blog/social-media-advertising/#the-6-be st-social-networks-for-ecommerce-advertising
Kaplan, B. and Maxwell, J.A. “Qualitative Research Methods for Evaluating Computer Information Systems,” in Evaluating Health Care Information Systems: Methods and Applications, J.G. Anderson, C.E. Aydin and S.J. Jay (eds.), Sage, Thousand Oaks, CA, 1994, pp. 45-68.https://doi.org/10.1007/0-387-30329-4_2
Kameda, T., & Hastie, R. (2015). Herd Behavior . Emerging Trends in the Social and Behavioural Sciences. https://doi.org/10.1002/9781118900772.etrds0157
Kenton, W. (2020). Social Networking Service (SNS). Investopedia.
https://www.investopedia.com/terms/s/social-networking-service-sns.asp
Klostermann, J., Plumeyer, A., Böger, D., & Decker, R. (2018). Extracting brand information from social networks: Integrating image, text, and social tagging data. International Journal of Research in Marketing, 35(4), 538-556.
https://doi.org/10.1016/j.ijresmar.2018.08.002
Kreijns, K., Kirschner, P.A., Jochems, W. (2003). Identifying the pitfalls for social interaction in computer-supported collaborative learning environments: A review of the research. Computers in Human Behavior, 19 (3), 335-353.
https://doi.org/10.1016/S0747-5632(02)00057-2
Korhan, O., Ersoy, M. (2016). Usability and functionality factors of the social network site application users from the perspective of uses and gratification theory. Qual Quant, 50, 1799–1816.https://doi.org/10.1007/s11135-015-0236-7
Lu, B., Fan, W., & Zhou, M. (2016). Social presence, trust, and social commerce purchase intention: An empirical research. Computers in Human Behavior, 56, 225–237.https://doi.org/10.1016/j.chb.2015.11.057
Ma, Q. (2020, Oct 10). Why Brands Should Embrace Gender-Neutral Marketing. Medium.
https://medium.com/swlh/why-brands-should-lean-in-to-gender-neutral-product-mark eting-2f1bd0cef516
Marshall, B., Cardon, P., Poddar, A., & Fontenot, R. (2013). Does Sample Size Matter in Qualitative Research?: A Review of Qualitative Interviews in is Research. The Journal of Computer Information Systems, 54(1), 11–22.
https://doi.org/10.1080/08874417.2013.1164566
McLeod, S. A. (2014). The interview research method. Simply Psychology. https://www.simplypsychology.org/interviews.html
Prado‐Gascó, V, Calabuig Moreno, F, Añó Sanz, V, Núñez‐Pomar, J, Crespo Hervás, J. (2017). To post or not to post: social media sharing and sporting event performance. Psychol Mark. 2017; 34: 995– 1003. https://doi.org/10.1002/mar.21038
Qu, S., & Dumay, J. (2011). The qualitative research interview. Qualitative Research in Accounting and Management, 8(3), 238–264.
Qiao X., Zhu Y. (2011) A Review of Theory and Research Based on Uses and Gratifications in HCI. In: Lin S., Huang X. (eds) Advances in Computer Science, Environment, Ecoinformatics, and Education. CSEE 2011. Communications in Computer and Information Science, vol 216. Springer, Berlin, Heidelberg.
https://doi.org/10.1007/978-3-642-23345-6_44
Read, A. (n.d.). Instagram Stories: The Complete Guide to Using Stories. Buffer.
https://buffer.com/library/instagram-stories/
Sanjari, M., Bahramnezhad, F., Fomani, F. K., Shoghi, M., & Cheraghi, M. A. (2014). Ethical challenges of researchers in qualitative studies: the necessity to develop a specific guideline. Journal of medical ethics and history of medicine, 7, 14. Schroeder, R. (2006). Being there together and the future of connected presence. Presence Teleoperators & Virtual Environments, 15(4), 438-454.
https://doi.org/10.1162/pres.15.4.438
Sehl. (2019). All the different ways to calculate Engagement Rate.Hootsuite.
https://blog.hootsuite.com/calculate-engagement-rate/
Short, J., Williams & E. & Christie, B. (1976). The social psychology of telecommunications. Wiley.
Tankovska, H. (2021). Distribution of Instagram users worldwideas of January 2021, by age group.https://www.statista.com/statistics/325587/instagram-global-age-group/
Tankovska, H. (2021). Number of daily active Instagram Stories users from October 2016 to January 2019.
https://www.statista.com/statistics/730315/instagram-stories-dau/
Williamson, K. (2002). Research methods for students, academics and professionals : information management and systems (2. ed.). Centre for Information Studies.
8
Appendices
Appendix 1. Interview questions (1) introduction
(2)Participant demographic
Question 1. What is your year of birth? Question 2. Where do you live?
(3)Instagram activity
Question 1.How much time do you spend on Instagram on average in a day? Question 2. Have you ever clicked Instagram Stories?
- How often do you click Instagram Stories in a day?
- Do you interact with other users' image or video Instagram Stories? (interacting as commenting and fast reaction emojis and gif)
(4)Function types
Mockup 1: slider, Mockup 2: poll, Mockup 3: question, Mockup 4: quiz, Mockup 5: countdown
Question 1. Have you seen this on Instagram Stories?
Question 2. Do you know how to interact with the function? How? Question 3. Would you interact with the function?
Question 4. Why would you interact with the function?
Question 5. How do you feel when you interact with the function? Question 6. Do you feel connected to the user? Why?
(5)Comparison
Comparison : mockups of all the functions
Question 1. Among 5 functions, which one would you prefer to interact with? - Why do you think so?
Question 2: Which function makes you feel the most connected to the user? - Why do you think so?
Appendix 2. Survey questions Participants demographics
(1) What is your year of birth?
(2) Where do you live? (City, Country)
Instagram Activity
(1) How much time do you spend on Instagram on average in a day? (2) Have you ever clicked on Instagram Stories?
○ Yes ○ No ○ other ______________________ (3) How often do you click Instagram Stories in a day?
(4) Do you interact with other users' images or video Instagram Stories? (when we say interact, we mean commenting, fast reaction emojis, gif etc.) ○ Yes ○ No ○ other ______________________
Instagram function: Slider
(1) Have you seen this on Instagram Stories? ○ Yes ○ No ○ other ______________________ (2) How do you interact with this function?
(3) Would you interact with this function? Why/ why not?
(4) Do you feel connected to the user who posted this function? Why/ why not?
Instagram function: Poll
(1) Have you seen this on Instagram Stories? ○ Yes ○ No ○ other ______________________ (2) How do you interact with this function?
(3) Would you interact with this function? Why/ why not?
(4) Do you feel connected to the user who posted this function? Why/ why not?
Instagram function: Question
(1) Have you seen this on Instagram Stories? ○ Yes ○ No ○ other ______________________ (2) How do you interact with this function?
(3) Would you interact with this function? Why/ why not?
(4) Do you feel connected to the user who posted this function? Why/ why not?
Instagram function: Quiz
(1) Have you seen this on Instagram Stories? ○ Yes ○ No ○ other ______________________ (2) How do you interact with this function?
(3) Would you interact with this function? Why/ why not?
(4) Do you feel connected to the user who posted this function? Why/ why not?
Instagram function: Countdown
(1) Have you seen this on Instagram Stories? ○ Yes ○ No ○ other ______________________ (2) How do you interact with this function?
(3) Would you interact with this function? Why/ why not?
(4) Do you feel connected to the user who posted this function? Why/ why not?
Compared Functions
(1) Out of these 5 functions (slider, poll, question, quiz & countdown), which one would you prefer to interact with?
○ Slider ○ Poll ○ Questions ○ Quiz ○ Countdown (1-1) Why did you pick that/ those functions?
(2) Out of these 5 functions, which one makes you feel the most connected to the user?
○ Slider ○ Poll ○ Questions ○ Quiz ○ Countdown (2-1) Why did you pick that/ those functions?
Create yourself or interact with others
(1) Which one do you prefer?
○ Creating your own Instagram Story using one or more of the functions (poll, slider, question, quiz or/and countdown)
○ Interacting with one or more functions (poll, slider, question, quiz or/and countdown) in another users Instagram Story
○ Both (1-1) Why?
○ Create your own Instagram Story using one or more of the functions (poll, slider, question, quiz or/and countdown)
○ Interact with one or more functions (poll, slider, question, quiz or/and countdown) in another users Instagram Story
○ Both (2-1) Why?