School of Innovation, Design and Engineering
Design for maintenance: An
interview based survey
Master Thesis Work (PPU503)
30 credits, Advanced level
Product and process development Production and Logistics
Marcel Buinus
Commissioned by: Mälardalen University
Tutor (home university): Prof. Dr. rer. nat. Stephan Jacobs Tutor (university): Dr. Antti Salonen
II
ABSTRACT
Design for maintenance is concerned with achieving good design that considers the general care and maintenance of equipment and the repair actions that follow a failure. This thesis gives an overview about the theoretical background of maintainability respectively design for maintenance and presents how companies in the Swedish manufacturing sector are dealing with design for maintenance for their machines. This work discusses the behavior and dealing with the topic design for maintenance from the perspective of the users.
In order to answer the research questions of this thesis, a literature review and expert interviews were used. Industrial experts from maintenance departments of Swedish industrial companies answered the interview questions for this research which serve as a foundation for the results and the analysis.
The results of the research questions and the conclusion are summarized on the basis of the expert interviews. It enables the reader to know to what extent design for maintenance is considered, how important it is, how communication affects the design and therefore the maintainability and finally a rating of how important a range of maintainability attributes are for them.
For the Swedish manufacturing industry design for maintenance is a topic which is considered as important, but a lot of effort in improving maintainability due to the design is not conducted. Improving maintainability with the help of adapting maintainability concepts or recording data especially for design issues are examples for the potential. Swedish companies have the opportunity to create an appropriate relation to the suppliers to utilize benefits in order to improve maintainability. The rating of maintainability attributes turns out as very difficult for the interview experts because of the strong relation between them.
(Keywords: DFMAIN, Design for Maintenance, Design for Maintainability, Maintainability, Communication)
III
ACKNOWLEDGEMENT
With this acknowledgement I would like to express my gratitude to all those who have supported me in completing this thesis.
First of all, I would like to express my sincere gratitude to my advisor, Antti Salonnen for his valuable guidance and constant supervision throughout my entire thesis. It impressed me how prompt he sent feedback in every situation. I gained a lot of knowledge, encouragement, and confidence while writing this thesis. Secondly, I would like to express my sincere gratitude as well to Stephan Jacobs who supported me from Germany as my first supervisor. All formalities between my home university and MDH as well as with Antti Salonen were coordinated by him.
I am very grateful to my parents who always supported me with the right words and motivation especially in critical moments. Without them I wouldn’t have been here, thank you for their love, understanding and inspiration throughout my life.
I would like to thank all the academic researchers as well as industrial experts who participated in the interviews for their immense support on making this thesis successful.
I extend my warm gratitude to especially one person who helped me mentally at every time I needed it. Thank you very much Maaike Das for your unlimited support during the last months. Her positive, enthusiastic and cheerful manner kept me being optimistic and confident. Lastly I would like to thank you for all other people who directly or indirectly helped me in writing this thesis.
IV
TABLE OF CONTENTS
1. INTRODUCTION ... 1
1.1. BACKGROUND ... 1
1.2. PROBLEM FORMULATION ... 2
1.3. AIM AND RESEARCH QUESTIONS ... 2
1.4. PROJECT LIMITATIONS ... 3
2. RESEARCH METHOD ... 4
2.1. SELECTION OF TOPIC ... 4
2.2. RESEARCH STRATEGY AND DESIGN ... 5
2.2.1. QUALITATIVE RESEARCH ... 6
2.2.2. QUANTITATIVE RESEARCH ... 7
2.2.3. CHOICE OF METHODOLOGY ... 7
2.2.4. RESEARCH DESIGN ... 7
2.3. CONDUCTING EMPIRICAL FINDINGS ... 8
2.3.1. DATA COLLECTION... 8 2.3.2. LITERATURE REVIEW ... 9 2.3.3. INTERVIEW QUESTIONS ... 9 2.4. RESEARCH CONSIDERATION ... 11 2.4.1. DATA ANALYSIS ... 11 2.4.2. RELIABILITY ... 11 2.4.3. VALIDITY ... 12 3. THEORETICAL FRAMEWORK ... 13 3.1. MAINTAINABILITY ... 13
3.2. LIFE CYCLE MANAGEMENT ... 15
3.3. MAINTENANCE CONCEPTS ... 17
3.3.1. TOTAL PRODUCTIVE MAINTENANCE ... 17
3.3.2. RELIABILITY-CENTERED MAINTENANCE ... 22
3.4. DESIGN FOR MAINTENANCE ... 30
3.4.1. DFMAIN GUIDELINES ... 32 3.4.2. DESIGN REVIEW ... 33 3.4.3. SYSTEM RELIABILITY ... 34 3.4.4. MAINTAINABILITY ... 36 3.4.5. SUPPORTABILITY ... 36 4. RESULT (EMPIRICS) ... 38 5. ANALYSIS ... 43 5.1. RESEARCH QUESTION 1 ... 43 5.2. RESEARCH QUESTION 2 ... 44 5.3. RESEARCH QUESTION 3 ... 45 6. CONCLUSIONS ... 47 7. REFERENCES ... VII 8. APPENDICES ... XI
V
LIST OF FIGURES
Figure 1: Topic Selection – Topic and research questions ... 5
Figure 2: Types of scientific research methods ... 5
Figure 3: Data collection method (Ghauri & Grønhaug, 2005; Sekaran, 1992) ... 8
Figure 4: System life cycle (examples). (Blanchard, 1991) ... 15
Figure 5: Commitment of life-cycle cost (Blanchard, 1991) ... 17
Figure 6: Framework of total productive maintenance (Ben-Daya, et al., 2009)... 19
Figure 7: Eight pillar approach the implementation of TPM (Ben-Daya, et al., 2009) ... 20
Figure 8: The traditional view of failure (Moubray, 1997) ... 27
Figure 9: Six patterns of failure (Moubray, 1997) ... 29
Figure 10: System design integration (Blanchard, 1991) ... 31
LIST OF TABLES
Table 1: The difference in emphasis in qualitative versus quantitative methods, based on (Reichardt & Cook, 1979) ... 6Table 2: Twelve step TPM implementation methodology 1/2 (Ben-Daya, et al., 2009) ... 22
Table 3: Design review procedure (Chen & Cai, 2003) ... 34
Table 4: Rating of maintainability attributes ... 41
VI
ABBREVIATIONS
ABS Association of Business Schools ADT Administrative delay time
Cost/OH Maintenance cost per system/product operating hour DFMAIN Design for maintenance
IDT School of Innovation, Design and Engineering JIPM Japan Institute of Plant Maintenance
LCC Life cycle costing LCM Life cycle management LDT Logistics delay time
M¯ Mean active maintenance time MDH Mälardalen University
MDT Maintenance downtime
MLH/OH Maintenance labor hours per system/product operating hour MTBF Mean time between failure
MTBM Mean time between maintenance OEE Overall equipment effectiveness RCM Reliability centered maintenance TAT Turnaround time
TCO Total cost of ownership TPM Total productive maintenance TQM Total quality management
1
1. INTRODUCTION
The first chapter of this thesis is dealing with the topic design for maintenance in the Swedish manufacturing industry, beginning with a short background introduction. After that the problem formulation is outlined. Furthermore, the author is discussing the aim and research questions followed by a brief explanation of the project limitations of the study.
1.1.
Background
Tarelko clarified maintainability as “[attributes]…of design, manufacture and installation which affect the ability of the system to be retained in or restored to service by means of maintenance actions…” (Tarelko, 1995, p. 86). The mentioned attributes ease for example performance of failure diagnosis activities, repair, inspection or replacement of parts (Tjiparuro & Thompson, 2004).
The importance of maintainability is increasing steadily due to high support and operating costs of a system or the equipment in general. The U.S. industry for example spends over $300 billion just for maintaining their plants and for further operations each year. Looking at this number, reducing the costs by applying maintainability engineering principles to machines or rather systems is a possibility. Reducing projected maintenance costs, reducing the maintainability time by modifying the design, using available maintainability data to evaluate the availability respectively unavailability of equipment and finally to define labor hours and further related resources which are required to increase maintainability (Dhillon, 2006).
According to Wani and Gandhi maintainability is a design attribute which has a high importance during the operation time of a system. Well performed designing of a system leads to simplification of maintenance and consequently conduces to lower maintenance costs, increases the production and availability. To reach easy maintainability it is outlined that the best option is the design stage during the development process of a machine/production cell (Wani & Gandhi, 2002).
2
1.2.
Problem formulation
A major field of industrial manufacturing is the maintainability. Markeset and Kumar mentioned that the need of maintenance is already decided at the design stage of a machine or production cell (Markeset & Kumar, 2003). Hence, the design of a machine or production cell should be strictly planned and realized. The both parties involved in the topic design for maintenance are firstly the suppliers and secondly the users. As far as the author knows there is insufficient literature available about whether both the machine producer (supplier) and the industrial manufacturer (user) maintain contact with each other to improve the design of a machine/production cell and therefore to improve maintainability.
1.3.
Aim and research questions
The overall goal of this work is to find out how specific companies in the Swedish manufacturing sector are dealing with design for maintenance. Particularly, this work will discuss the behavior and dealing with the design for maintenance of the perspective of the users. Due to the fact that there is insufficient scientific literature available for this topic, the thesis aims to find out more about the behavior and dealing with design for maintenance in the Swedish manufacturing industry. Does a continuous contact between supplier and user exist?
Therefore, a couple of research questions are formed to achieve the work objective and those questions are:
1. How important is DFMAIN and what actions are taken to improve maintainability in general concerning to the aspect of DFMAIN the Swedish manufacturing industry?
2. How does communication between users and suppliers affect the design and therefore the maintainability of a machine or production cell from the users´ perspective?
3. Which maintainability attributes are most important for the Swedish manufacturing industry?
3
1.4.
Project limitations
The project limitations of this thesis exposed uncontrollable factors during the draw up of the thesis. The time factor was the first reason for that; the thesis is based on interviews with maintainability experts (users) of the manufacturing industry. The fundamental knowledge of at least five years up to 25 years experience makes them to professional experts with essential and valid knowledge. The originally plan was to focus on both perspectives. On the one hand the perspectives of users and on the other hand on suppliers of industrial manufacturing machines. To get in touch with those experts took more time than scheduled. Until the contact was made and an appointment was scheduled the time was elapsing quickly. Because of that and because the author couldn´t find more suppliers for an interview, the thesis will cover just the users perspective.
The second factor was the lack of literature on design for maintenance in the manufacturing industry section, especially those that related directly to the design. Literature about the improvement of maintainability through design changes on the basis of the collaboration of the two parties is equally not available.
4
2. RESEARCH METHOD
This chapter provides a comprehensive overview of the various research strategies and procedure that were used to gather relevant information to best answer the research questions. Besides the research strategies, the made choices and how the data was collected are explained. The chapters’ goal is to create the possibility for the reader to critically review the thinking process and choices made for this research. At last, the reliability and validity of this study complete the research method part.
2.1.
Selection of topic
The author of this thesis is interested in the design of machines related to maintainability. Concerning this the author wanted to gain information on how the producers and users of these machines/production cells in the manufacturing industry are dealing with the topic design for maintenance. After a brainstorming meeting with the supervisor the author decided to investigate a topic related to design for maintenance which is also related to a running research project of the Mälardalen University (MDH) and therefore also provide useful information for this research project. Further meetings and discussions took place and the research questions were defined. Due to the fact that too less interviews of the producer site could be made, the focus is just the users’ perspective. Preliminary research in the field of maintainability and design for maintenance had already been accomplished with the help of academic journals and professional books. Figure 1 shows the topic of the thesis including the research questions:
5
Figure 1: Topic Selection – Topic and research questions
2.2.
Research strategy and design
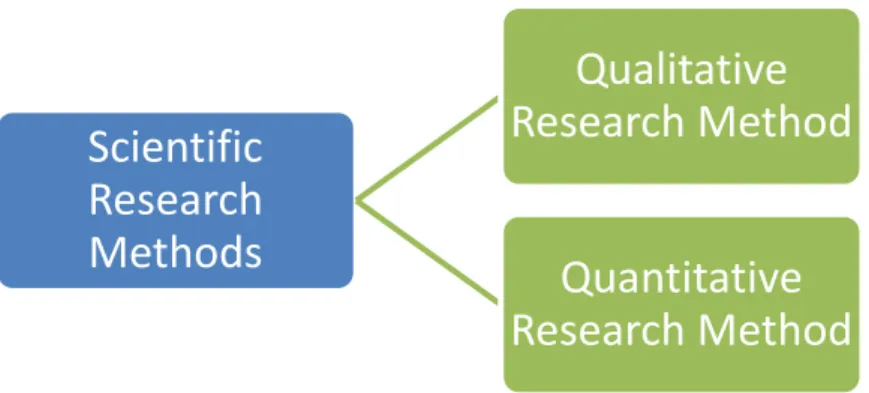
For every thesis there is the possibility to use both of the scientific research methods, which are divided into two types as displayed in Figure 2; on the one hand the qualitative research method and on the other hand the quantitative research method. Within this chapter these methods are briefly described and depending on the objective of the thesis the reason of the selected method is provided.
Figure 2: Types of scientific research methods
There are many discussions in the available literature concerning which of the methods are more suitable or more ‘scientific’. According to Jankowicz (1991) none of the methods can be called better or more ‘scientific’. He mentioned that the most suitable method or technique
Design for maintenance: An interview based survey
RQ 1
How important is DFMAIN and what actions are taken to improve maintainability in general concerning to the aspect
of DFMAIN the Swedish manufacturing industry?
RQ 2
How does communication between users and suppliers affect the design and therefore the maintainability of a machine or production cell from the users´
perspective?
RQ 3
Which maintainability attributes are most important
for the Swedish manufacturing industry?
Scientific
Research
Methods
Qualitative
Research Method
Quantitative
Research Method
6 depends on the research problem and the purpose of the research project. In general the author of a research project can select any of the research methods independent of the approach (Fisher, 2004).
In the following Table 1 differences in emphasis in qualitative versus quantitative methods are provided (Ghauri & Grønhaug, 2005):
Qualitative methods Quantitative methods
Emphasis on understanding Emphasis on testing and verification
Focus on understanding from
respondent´s/informant´s point of view
Focus on facts and/or reasons for social events
Interpretation and rational approach Logical and critical approach
Observation and measurements in natural
settings Controlled measurement
Subjective ‘insider view’ and closeness to data
Objective ‘outsider view’ distant from data
Explorative orientation Hypothetical-deductive; focus on hypothesis testing
Process oriented Result oriented
Holistic perspective Particularistic and analytical
Generalization by comparison of properties and contexts of individual organism
Generalization by population membership
Table 1: The difference in emphasis in qualitative versus quantitative methods, based on (Reichardt & Cook, 1979)
2.2.1. Qualitative research
As mentioned before, the qualitative research is a scientific research method which investigates the following characteristics (Mack, et al., 2005):
Seeks answer to a question
Systematically uses a predefined set of procedures to answer the question
Collects evidence
Produces findings that were not determined in advance
Produces findings that are applicable beyond the immediate boundaries of the study Connected to the mentioned characteristics Mack et al. defined that qualitative research “seeks to understand a given research problem or topic from the perspectives of the local population it involves. Qualitative research is especially effective in obtaining culturally
7 specific information about the values, opinions, behaviors, and social contexts of particular populations” (Mack, et al., 2005, p. 1).
Ghauri (2004) and Marshan-Piekkari and Welch (2004) described that the qualitative research method is typically for researches which purpose is to ascertain a person´s experience or behavior to understand a phenomenon which has not been or has just been researched barely.
2.2.2. Quantitative research
According to Shirish “Quantitative research is generally associated with the positivist/post positivist paradigm. It usually involves collecting and converting data into numerical form so that statistical calculations can be made and conclusions drawn” (Shirish, 2013, p. 66). Identifying patterns and trends with the help of a great amount of a certain target group describes the quantitative approach. To achieve this approach data based on numbers has to be collected and converted into graphs and figures.
2.2.3. Choice of methodology
The selection of the methodology within this research is after defining research questions based on the qualitative research method. Due to the fact that this method is focused on the emphasis on understanding the respondent´s point of view than focusing on facts and numbers (see also Table 1). To answer the research questions a detailed ‘insider view’ and the closeness of date is of highly importance. Since the aim of the thesis is to find out how users of machines in the Swedish manufacturing industry handle the topic of design for maintenance the qualitative method serves best results.
2.2.4. Research design
Exploratory, descriptive and causal (explanatory) researches are the three main classes of research design (Ghauri & Grønhaug, 2010). This study focuses on exploratory research following up the advice of the same authors. They state that “When the research problem is badly understood, a (more or less) exploratory research design is adequate” (Ghauri & Grønhaug, 2010, p. 56). This study fits the criteria above and therefore a qualitative, exploratory research method has been chosen. To the author’s knowledge, no specific research has been conducted in the field of design for maintenance and its importance and the handling of this topic in the manufacturing industry, especially not in Sweden.
8 According to Ghauri and Grønhaug (2010), inductive research is often associated with qualitative research. However, the structure of this thesis is rather deductive than inductive which means conclusions are drawn through logical reasoning (Fisher, 2010; Ghauri & Grønhaug, 2010). The interview questions are built up by the author to obtain the best results in order to analyze and answer the research questions.
2.3.
Conducting empirical findings
2.3.1. Data collection
In order to get answers to the research questions, two different methods of collecting data exist. One of the methods is the gaining of data with primary sources and the other is the use of secondary data (Kumar, 2005). In Figure 3 the data collection methods are displayed and provide an overview of what kind of primary and secondary sources exist.
Figure 3: Data collection method (Ghauri & Grønhaug, 2005; Sekaran, 1992)
To achieve the goal of answering the research questions this research uses both primary sources and secondary sources. To prove and compare the findings of the gained information through interviews the secondary sources were used. The correct connection of primary and secondary sources provides a credible result which can be used for future researches.
9
2.3.2. Literature review
The role of reviewing past literature is very important for this research in order to compare the gained information of the interviews with the available literature. The author of this thesis wants to discover relevant data and find out the relationships between them to finally put this information together in a new way. The following purpose of a literature review is given by Ghauri and Grønhaug (2005):
Frame the problem under scrutiny
Identify relevant concepts, methods/techniques and facts; and
Position the study. (Any study should add something ‘new’.)
For this research data was collected from several textbooks in order to get an overview of the complexity of the topic. The internet gives the opportunity to get access to several databases. These data was retrieved from the Springer Research and Development publisher and scientific journals dealing with design for maintenance or maintenance in general. To get further in detail, the author gathered information from the Mälardalen University database, Otago Polytechnic ProQuest database, the Harvard database, Google Scholar, Elsevier Science, Journal of Quality in Maintenance Engineering and Industrial Management & Data Systems. It is important for the author that the selected literature is reliable and valid. To confirm this, a little research of the author and their literature has been performed. For example how many times the author was cited, how many books the author has been published or awarding of academic distinctions. For the online articles or scientific journals the publisher was well-known and therefore reliable.
2.3.3. Interview questions
According to Ghauri and Grønhaug (2005) interviews are considered as the best data collection method for research projects. In this research the semi-structured interview method is used. When deciding on whether to use a structured, semi-structured or unstructured research approach, a semi-structured approach can be described as an approach where the topics to be covered, the sample size, people to be interviewed and questions to be asked are determined beforehand (Saunders, et al., 2009, p. 320). Due to the open-ended questions the respondents can give more clear and accurate answers. Furthermore, during the interview further questions could pop up and the interviewer can ask for additional elaboration of
10 attitudes and answers. The reason to use the interview method to collect data is that the interview questions are open and basically every answer is different. Furthermore the direct contact to the company and the face to face conversation gives more information in the end. A survey or questionaire would just give less information in the authors opinion. In general the response rate is often less than five percent which is the reason to conduct the interviews personally and not via E-Mail.
Specialists of the manufacturing industry with positions in the field of maintenance are chosen for the interviews to get access to the highest possible knowledge. The six interviews were conducted in meeting rooms of the different companies and all of them were recorded. The interviews were approximately 20-40 minutes long and always just one interviewee attended. Unfortunately just users of of the manufacturing industry were interviewed. Due to the tight shedule and the difficulty of getting contact to those companies, just six interviews has been realised. The author would have prized to conduct more interviews to gain access to even more information.
11
2.4.
Research consideration
2.4.1. Data analysis
When doing research in general, the first step is writing down the results which are gained from the qualitative or quantitative research method. Solely findings do not have any significance, as they are not connected to any theories or models. All the findings have to be analyzed because one cannot develop conclusions from merely findings.
Due to the varied nature of qualitative data Saunders et al. explain that there is not any standardized process for the analysis of this data. In the analysis of the qualitative data, the theories and concepts found in secondary data research were combined with the results out of the primary data collection (Saunders, et al., 2009). The semi-structured in-depth interviews were analyzed and understood as well as supported by transcripts. Therefore the author is able to use the gathered information correctly. “In-depth interviewing is a qualitative research technique that involves conducting intensive individual interviews with a small number of respondents to explore their perspectives on a particular idea, program, or situation” (Boyce & Neale, 2006, p. 3). After the interview was conducted, the author wrote transcripts by listening to the recorded interview to collect all information. When all transcripts are collected the author compared them, is trying to identify, code and categorize patterns or themes that were found in the data.
In order to be able to answer the research questions, the theories described in chapter three were connected to the results in chapter four. This combination forms the analysis of the obtained information discussed in chapter five.
2.4.2. Reliability
In every research project the credibility of the research findings depends on both the validity and reliability. Saunders et al. describe reliability as “the extent to which data collection technique or techniques will yield consistent findings, similar observations would be made or conclusions reached by other researchers or there is transparency in how sense was made from the raw data” (Saunders, et al., 2009, p. 600).
To ensure the presented information was both reliable and relevant, all the collected information for this research was proved thoroughly and the sources were reviewed with the help of the ABS ranking. The ABS ranking is an academic journal quality guide which gives an overview how reliable a source is. How many times an article has been cited gives the impact factor of the used literature and is therefore another characteristic of the reliability of a
12 resource. According to Fisher (2010), the sample size of a research depends to some extent on the size of the population from which the sample is taken.
2.4.3. Validity
In general the validity of a research refers to “the extent to which data collection method or methods accurately measure what they were intended to measure” (Saunders, et al., 2009, p. 603). The analysis of the gained data of the expert interviews was related to the developed theoretical framework section which is based on existing literature.
Furthermore the author of this research aimed to use various sources as reference for a certain amount of statements which increased the validity of the study.
13
3. THEORETICAL FRAMEWORK
This section is giving a fundamental understanding of the topic and it serves as a proof in the analysis later if the connection can be made. Due to the fact that maintainability and the design in combination are not explicit researched; the theoretic framework has to be generalized and is not for the Swedish manufacturing industry specifically.
3.1.
Maintainability
One basic characteristic of design is the maintainability which is described in four different factors. The first one is the labour-hours factors, the second one is the time for maintenance actions, the third one is the maintenance frequency factors and the fourth one is the occurring costs for maintenance. Blanchard et al. defined maintainability as:
“A characteristic of design and installation which is expressed as the probability that an item will be retained in or restored to a specified condition within a given period of time, when maintenance is performed in accordance with prescribed procedures and resources” (Blanchard, et al., 1995, p. 1).
Another more comprehensive definition of maintainability was made by Kececioglu who said that:
“Maintainability is the probability of successfully performing and completing a specified corrective maintenance action, or a specified preventive maintenance action or both; within a prescribed period of time; at a desired confidence level; with specified manpower, skill levels, test equipment, technical data, operation and maintenance manuals, and maintenance support organization and facilities; and under specific environmental conditions” (Kececioglu, 2003, p. 30).
For every system or product design the maintainability itself is an appertaining characteristic. Maintainability belongs to the ease, safety, economy and accuracy in the performance of maintenance actions. The main objective when designing a system or a product should be that it can be maintained with the lowest costs as possible and without using a large amount of time. Further objectives are as always the impact on the environment; it should be hold to a minimum, and at least a minimum of resources like personnel, facilities, materials and test
14 equipment should be used. Reaching high efficiency and effectiveness are goals of maintaining a system in its intended environment without influencing the task of that system. Blanchard et al. separated maintainability and maintenance. On the one hand maintainability basically describes the ability to maintain an item, whereas maintenance on the other hand represents the required actions which are made to repair, replace or restore an item in a system in a most effective way. While maintainability covers design parameters, maintenance pertains as a consequence of design (Blanchard, et al., 1995).
Rosenberg mentioned that the consideration of easy maintenance and adequate accessibility for reparation actions is highly recommended when putting a system together. If changes are made during the design stage, a lot of hassle can be avoided for the next decades. As well as Rosenberg preached to make notes of the items you combine for the system. Some of them last 10, 20 or 30 years. Whoever will maintain the system later will appreciate those notes (Rosenberg, 1999).
To measure the maintainability of a system, a couple of key figures are available. Maintainability contains several factors especially within the scope of a whole system. The key figures are shortly listed subsequently. Mean time between maintenance (MTBM) is one of the popular key figures. This number considers both the unscheduled and scheduled maintenance needs. Apart from these requirements it also covers the reliability mean time between failure (MTBF). Another key figure is called mean time between replacement (MTBR) which is usually used when a spare part is replaced at a system due to maintenance actions (Blanchard, et al., 1995).
If a machine or a system is maintained, the time during which the system cannot be run in general is called the maintenance downtime (MDT). MDT covers some key figures like administrative delay time (ADT), logistics delay time (LDT) and the mean active maintenance time (M¯ ). Furthermore the turnaround time (TAT) key figure is described as a number which includes the time needed to repair, to service and/or check out for recommitment. The time which is used to take off an item in total includes the installation of the operational system as well as the time at the maintenance shop or the time used at the spares inventory. Some general key figures are maintenance labor hours per system/product operating hour (MLH/OH) and maintenance cost per system/product operating hour (Cost/OH). Last
15 mentioned maintenance costs are also regarded in terms of the life cycle costs (LCC) (Blanchard, et al., 1995).
3.2.
Life cycle management
Tinga defined the life cycle management (LCM) as it “is used to indicate all the activities that are required to exploit a capital asset in the most effective and efficient manner during its complete life cycle” (Tinga, 2013, p. 287). The total life cycle of a machine or of a system contains all phases beginning with the idea over the design, production and finally the disposal (Woodward, 1997). In Figure 4 a system life cycle is displayed. The phases starting with conceptual design, preliminary system design, detail design and development, the construction itself, the operation and retirement are shown in Example B, but furthermore distribution, maintenance and support as well as the phase-out and disposal should be added to complete all phases in detail.
Figure 4: System life cycle (examples). (Blanchard, 1991)
Other import concepts as life cycle costing (LCC) and total cost of ownership (TCO) are closely connected to the LCM. In the past decisions on a normal investment were based on the
16 initial investment costs and costs for the operational part were neglected. Nowadays those responsible know that operational costs for a system can reach the same order of amount. Due to a long service life with around 25 to 30 years for some specific assets the operational costs are higher than the investment costs. They can reach up to a factor of 3-5 times compared to the investment costs itself. The direct life cycle costs and the related fix costs for the facility for example have to be added to obtain the total cost of ownership (Tinga, 2013).
At this point it has to be underlined that during the design phase of a system the majority of the fixed costs is already determined. This is the reason why the design stage of a system or the design in general is from high importance. All the requirements during the operational stage of a system including maintenance, the need of spare parts, the facilities and the level of mechanics can become a great cost factor if not considered in the first place. Consequently changes in the design stage of a system are the only possibility to substantially lower the LCC. Although the fact that it is difficult to estimate all costs which could appear in the future precisely, it is necessary to take into account operational plus disposal costs at the design stage in order to achieve lower TCO (Tinga, 2013).
Related to the general overview of life-cycle costs in Figure 5, there is a large commitment to life-cycle cost for the beginning of a system development. As shown in Figure 5 there a three different projections which of course can vary from project to project. The actual expenditures of the project sum up slowly from the beginning of the project until the end of the preliminary system design stage. After this stage, costs will increase more and more, especially during the production or construction stage. For many systems the cumulative life-cycle costs for the project range from 60-70 % of the total amount of cost by the end of the preliminary system design. To put it another way, the maintenance and support cost of a system which represent a great amount of the total costs are highly influenced by the decisions made in the early design stage (Blanchard, 1991).
17
Figure 5: Commitment of life-cycle cost (Blanchard, 1991)
3.3.
Maintenance concepts
Within the next two parts the most common maintenance concepts are presented. On the one hand the total productive maintenance and on the other hand the reliability-centered maintenance.
3.3.1. Total Productive Maintenance
Total productive maintenance (TPM) was described by Nakajima, vice-chairman of Japan Institute of Plant Maintenance, as a mixture of total employee involvement and total quality management concepts from Japan and of the American preventive maintenance (Nakajima, 1988).
TPM consists of three words (Ben-Daya, et al., 2009):
Total: this word implies that everything and everybody is involved from top to bottom
Productive: represents the aim to do maintenance during the operation in order to reduce having troubles while producing
18 Maintenance: signifies that the equipment upkeep is autonomously by production operators focused on having good condition – clean, grease, repair, and accept to spend necessary time on it
The existing literature on TPM describe different definitions. Nakajima defines TPM as
“an innovative approach to maintenance that optimizes equipment effectiveness, eliminates breakdowns, and promotes autonomous maintenance by operators through day-to-day activities involving the total workforce” (Rhyne, 1990, p. 683).
Another definition is given by Wireman who describes TPM as:
“a maintenance improvement strategy that involves all employees in the organization and includes everyone from top management to the line employee and encompasses all departments including maintenance, operation, design engineering, project engineering, inventory and stores, purchasing, accounting finances, and plant management” (Wireman, 1990, p. 114).
During the quality revolution after World War II the TPM became a really important world-class manufacturing program. One of the most important goals of TPM is to increase the effectiveness of equipment from the first use until the complete deterioration. In order to avoid unexpected problems from operational activities like breakdowns, quality losses and speed losses, TPM aspires perfect maintainability conditions of the equipment (Ben-Daya, et al., 2009).
Zero accident, no breakdowns and no defects are the main objectives of TPM. TPM can be separated into six classes which provide benefits including quality, cost, safety, productivity, delivery and morale. During the years TPM has been pictured as an overall manufacturing strategy for increasing the productivity of equipment. In order to perceive defect, accidents, breakdown, machine stoppage, zero breakdown and pollution, benchmarking on quality, cost, safety, productivity, delivery, morale and overall equipment effectiveness (OEE) can be helpful. For TPM these sectors conduce an extreme objective (Ben-Daya, et al., 2009).
In terms of the strategy of TPM, cross-functional teams are formed to achieve the following elements (Ben-Daya, et al., 2009):
19
elimination of barriers to machine uptime
strict preventive maintenance programs
increase the efficiency of maintenance operations management
education of equipment maintenance to the lowest level
introduce information systems in order to support the development of obtained equipment with higher reliability and lower cost
There are similarities between the focus on TPM and TQM, as TPM tries to advance all the big picture indicators of successful manufacturing. To introduce TPM and to aim all the benefits of improved OEE through education, teamwork and management support, a long-term obligation is necessary (Ben-Daya, et al., 2009).
In Figure 6 the framework of TPM is displayed and tools for implementing such a TPM implementation program are covered. Furthermore the tools which are used to do so, possible benefits originated and the targets are stated (Ben-Daya, et al., 2009).
20 Another approach is the eight pillar Nakajima model which is displayed in Figure 7. The Japan Institute of Plant Maintenance (JIPM) suggests this eight pillar plan which helps to improve labor productivity with the assistance of controlled maintenance activities, lower the downtimes and setups as well as the reduction of maintenance costs. The above mentioned eight pillars are the foundation of the TPM building and are considered to be the principles of TPM. TPM stands for organizing, monitoring, controlling and planning up to perfection (Ben-Daya, et al., 2009). Rodrigues and Hatakeyama (2006) describe the eight sections of this method as following (see also Figure 7):
Autonomous maintenance
Focused improvement
Planned maintenance
Quality maintenance
Education and training
Safety, health and environment
Office TPM
Development management
21 In the following Table 2 Nakajima and Shirose summarized twelve steps for introducing a four phases TPM implementation methodology. These twelve steps cover developmental tasks with the characteristic that they form very low requirements for the development of TPM (Nakajima, 1988; Shirose, 1996).
Phase of
Implementation
TPM Implementation Steps Activities Involved
Stage Preparation
1. Declaration by top management decision to introduce TPM
Declare TPM introduction at in-house seminar
Carried in organization magazine
2. Launch education and campaign to introduce TPM
Managers: trained in seminar/camp at each level
General employees: seminar meetings using slides
3. Create organizations to promote TPM Create organizational hierarchy for TPM program
Constitute committees and sub-committees
4. Establish basic TPM policies and goals Benchmarks and targets evolved
Prediction of effects 5. Formulate master plan for TPM
development
Develop step-by-step TPM implementation plan
Framework of strategies to be adopted over time
Preliminary Implementation
6. Hold TPM kick-off Invite suppliers, related companies, affiliated companies
TPM Implementation
7. Establishment of a system for
improving the efficiency of production system
Pursuit of improvement of efficiency in production department
8. Improve effectiveness of each piece of equipment
Project team activities and small group activities
22
(SGA) at production centers 9. Develop an autonomous maintenance
(AM) program
Step system, diagnosis, qualification certification 10. Develop a scheduled maintenance
program for the maintenance department
Improvement maintenance, periodic maintenance, predictive maintenance 11. Conduct training to improve operation
and maintenance skills
Group education of leaders and training members 12. Develop initial equipment
management program level
Development of easy to manufacture products and easy to operate production equipment
13. Establish quality maintenance organization
Setting conditions without defectives, and its
maintenance and control 14. Establish systems to improve
efficiency of administration and other indirect departments
Support for production, improving efficiency of related sectors
15. Establish systems to control safety, health and environment
Creation of systems for zero accidents and zero pollution cases
Stabilization
16. Perfect TPM implementation and raise TPM performance
Sustaining maintenance improvements efforts
Challenging higher targets
Applying for PM awards
Table 2: Twelve step TPM implementation methodology 1/2 (Ben-Daya, et al., 2009)
3.3.2. Reliability-Centered Maintenance
After years of work, Nowlan and Heap developed a new cost effective way to maintain a system. The name of this concept is Reliability-Centered Maintenance (RCM) based on the fact that inherent safety and reliability capabilities shall reached with least occurring costs as possible (Keeter & Plucknette, 2008).
23 Moubray defines RCM as “a process used to determine what must be done to ensure that any physical asset continues to do what its users want to do in its present operating context” (Moubray, 1997, p. 7).
Many practitioners were trying to reduce time and resources in order to improve RCM projects and due to varying ‘successes’ the RCM method turned out to be the most successful method. To utilize the correct maintainability activity and to choose the right amount of people at the right time are main goals of RCM. Another important objective is to operate with equipment in the best way in order to reach a high level of reliability linked to safety, operational, environmental and profit objectives of the company. To achieve these objectives, basic failures of a system have to be dealt with. The organization has to make sure that there are activities which prevent, predict or mitigate these functional failures related to these basic system failures (Smith, 1992).
The seven basic questions which entail the RCM method are given by (Anon., 2015):
1. What are the functions and associated performance standards of the asset in its present operating context?
2. In what ways does it fail to fulfill its functions? 3. What causes each functional failure?
4. What happens when each failure occurs? 5. In what way does each failure matter?
6. What can be done to predict or prevent each failure?
7. What should be done if a suitable proactive task cannot be found?
Functions and Performance Standards
There are two things to do in the first part of implementing the RCM method. On the one hand it has to be figured out what the users want to do and on the other hand it has to be checked whether it is adequate what the users want to start with. Both aspects are important in order to ensure that the method is possible and the physical asset continues doing the things, the users want them to do at the present operating context. Basically the defining of the functions in its operational framework and the related desired standards of performance are covering the first step. The before mentioned functions can be divided into two categories. The first one is named primary functions including issues like the output, the speed or the
24 quality of the products. The other category is the secondary function, which covers further functions because the users do not expect the assets to do just the primary functions; they also expect functions in the matter of safety, protection, environment, comfort, efficiency of operation, control and containment. The importance of the user involvement from the beginning is indispensable because they have knowledge of the assets and they know best what contribution the assets are gaining for the financial and physical welfare of the company. Apart from that the first step of RCM covers around one third of the time of the entire analysis (Moubray, 1997).
Functional Failures
After finishing the first step, functions and performance standards and the achievement of these objectives are central. There is one incident for a user to stop an asset running from its standards and this instance appears when a failure occurs. This implies that the objectives of the maintenance are reached by acquiring an approach to the management of failure (Moubray, 1997).
Before defining suitable management tools occurring failures have to be identified. There are two different levels of identification. Firstly it has to be identified what instances cause the fail and secondly it has to be figured out what events can occur to get into this failure condition. In RCM these failed states are called “functional failures because they occur when an asset in unable to fulfill a function to a standard of performance which is acceptable to the user” (Moubray, 1997, p. 9). Furthermore the definition as well encompasses partial failures which mean that the asset is performing in an unacceptable level.
Failure Modes
After the functional failures are determined, the next step is the identification of events which are generating each failed state. These kinds of events are called failure modes and one of them could be for example when equal or similar equipment perform in the same context and a failure occurs. Further failure modes could be the ones which are already prevented by other maintenance regimes or failures which have not appeared yet but are known as to be possible to occur in the future. Normally the list of failure modes contains failures caused by deterioration or wear and tear in general. Also included in the list should be human errors (for operators and maintainers) as well as design lacks. All together the list will give a proper scope. Also essential is how the causes of failures are identified. Enough but not too much
25 details should be made in order to avoid wasting time on dealing with symptoms instead of treating the causes. At the same time it is equally important that time for addressing the problem in depth should not be wasted (Bloom, 2005).
Failure Effects
The failure effects are listed in the fourth step. They are describing what happens when a random failure appears including all the information which is needed to analyze the consequences of the failure. Examples for such failures are given by Moubray (1997):
What evidence (if any) that the failure has occurred
In what ways (if any) it poses a threat to safety or the environment
In what ways (if any) it affects production or operations
What physical damage (if any) is caused by the failure
What must be done to repair the failure? Failure Consequences
After failures occur the consequences have to be determined. It is possible that just a few failures occur but it happened quite often that thousands of failures pop up and with these failures a detailed analysis has to be done. For each of these failures the effects can be different, either they affect the quality of the product or they influence the customer service, the environment or the safety in general. All of them may affect the operation and all of them cause time and money to repair (Moubray, 1997).
In order of the extent of the failures, they have to be divided into two different types. On the one hand they are failures which influence the operation highly. These failures and their high consequences are tried to be avoided completely. On the other hand, the other failures which do not have any affect or just little ones are neglected besides of standard cleaning and lubrication. In the meanwhile the strongly influenced failures will be added to the routine maintenance (Bloom, 2005).
The goal of RCM is rather the avoidance or reduction of consequences than avoiding failures due to proactive maintenance. This is a great strength of RCM as it realized the importance of the consequences of failures rather than their technical features. The RCM process divided the consequences into four different classifications (Moubray, 1997):
26 1. Hidden failure consequences
These hidden failures have the attribute that they don’t have any direct impact but they expose failures to the company which can have serious disastrous consequences (often these failures are related to protective devices which fail from time to time)
2. Safety and environmental consequences.
A safety consequence is a failure which can harm or in the worst case kill somebody. If a failure causes regional, national or even international violation of environmental standards they are called environmental consequences.
3. Operational consequences
An operational consequence is a failure which basically influences production in general (for example output, quality of products, operating costs or costs for repair).
4. Non-operational consequences
This failure doesn’t affect the production itself or the safety. It implies just the direct cost of repair.
For the purpose of getting the environment and safety to the principle direction of the management of maintenance, a structured review of the failure modes and its consequences are forced in order to include operational, safety and environmental objectives of the maintenance function. It is called a consequence evaluation process when relocating the focus off from the idea that failures are failures, and all of them are supposed to be bad. By doing so the process concentrates on those maintenance activities which have the most influence on the capability of the organization and additionally diverts energy off from activities with small or no effect.
27 Additionally another approach should not be neglected. Instead of just concentrating on the prevention of failures, the focus should lay on the various ways of dealing with a failure which brings along two failure management techniques (Moubray, 1997; Bloom, 2005):
Proactive tasks:
To avoid that an item is obtaining a failure status proactive tasks are trying to act before an failure appears. Proactive tasks contain the in general called predictive and preventive maintenance.
Default actions:
In the case that it is impossible to undertake an effective proactive tasks default actions has to deal with the fail condition. Those could be for example a redesign, a run-to-failure or failure-finding action.
Proactive Tasks
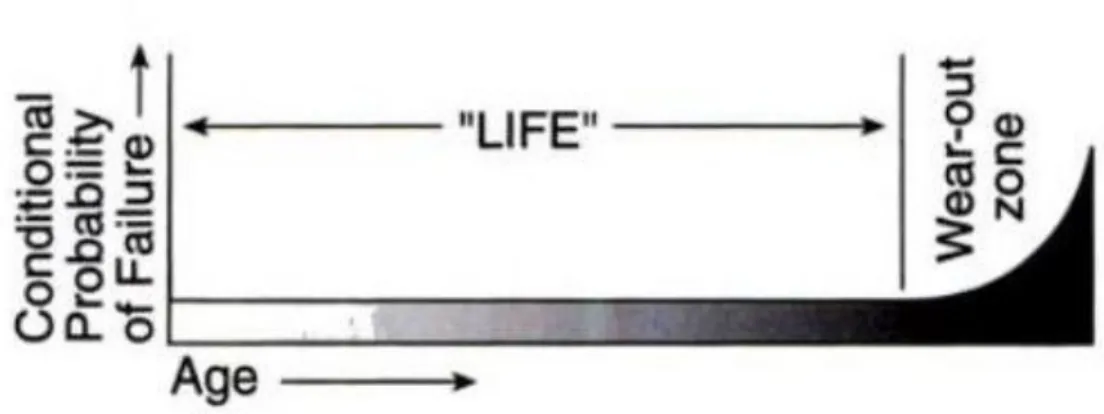
For the first generation plant availability is an issue which has to be optimized by using proactive maintenance as a routine foundation. Nowadays it is more common to do regular component replacements or overhauls instead of routine proactive maintenance. In Figure 8 the view of a fixed interval of failure is displayed (Moubray, 1997).
Figure 8: The traditional view of failure (Moubray, 1997)
Figure 8 displays the “LIFE” of an item which functions for a period X until it reaches the wear-out zone respectively the time of replacement, but this assumption is not working all the time. A classical approach is more that detailed acquisition of occurring failures leads to an overview of the life span. By doing this preventive action can be planned in order to avoid items to fail in the future. The model shown in Figure 8 represents a failure mode view of
28 some complex items as well as for most of less complicated equipment. Especially if the product and the equipment have a direct contact while operating, wear-out occurrence is often figured out. When failures arise in the course of time due to corrosion, evaporation, abrasion and fatigue these are called age-related failures (Moubray, 1997; Bloom, 2005).
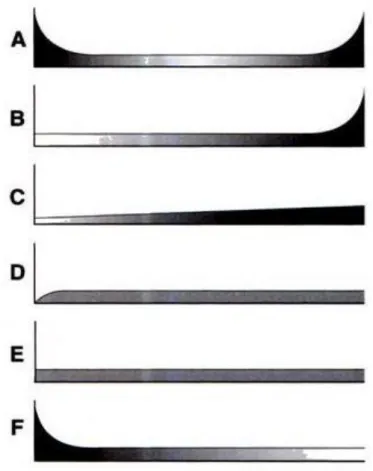
Apart from that equipment was getting more and more complex during the last two decades. This led to different failures and the varied failures are shown in Figure 9. It shows six ways of failures, on the one axis the conditional probability of failure and on the other axis the operating age of a number of mechanical and electrical items(Smith, 1993).
Pattern A shows a curve which starts with a high conditional probability of failure, followed by a steadily increasing conditional probability up to the zone of wear-out.
Pattern B displays the same progression as pattern A, except of the high conditional probability of failure start (same as in Figure 8).
Pattern C illustrates as well a slowly rising conditional probability of failure but as distinguished from pattern A and B, there is no investigatable wear-out age.
Pattern D shows after a very low conditional probability of failure at the time the item is new but then it will increase rapidly until a certain point and keeps constantly without a wear-out zone.
Pattern E displays the same progression as pattern D except of the beginning. Pattern E just has a constant progress from the beginning on.
Pattern F starts with a high mortality of the item. After this time it can decrease to a constant or slightly increasing conditional probability of failure.
29
Figure 9: Six patterns of failure (Moubray, 1997)
Due to some studies findings lead to the thinking that an item will fail less if it is overhauled more often. Nowadays this thinking is rarely true. If there is a dominant failure mode which is due to the age of the item, the limits of the age in general almost do nothing to increase reliability of huge systems. Nevertheless by doing overhauls, the failure rates can be increased by applying infant mortality into otherwise consistent systems (Moubray, 1997; Bloom, 2005).
Due to this appreciation companies got the opinion to throw away the usage of proactive maintenance. In terms of failures with less consequence this approach could be right but for failures with higher consequences something has to be undertaken to predict or prevent the failure itself or to at least lower the consequences. As mentioned before the RCM method splits the proactive tasks into the following three fields (Moubray, 1997):
Scheduled restoration tasks
Scheduled discard tasks
30 Default actions
In terms of default actions the RCM method divides them into three fields (Moubray, 1997):
Failure-finding: this action involves a continuously checking of functions which are hided in order to figure out what the reason for the failure was
Redesign: this action involves a singular exchange to the built-in capability of a system which could be for example hardware changes or singular modifications of the procedure
No scheduled maintenance: as the name includes this action doesn´t imply any efforts in terms of preventing a failure. Until the failure occurs nothing will happen and when the failure occurred, it will be repaired. It is also called a run-to-failure
3.4.
Design for Maintenance
According to Chen and Cai (2003) maintainability is from high priority for economical success in the field of engineering systems. As the stage of design during a development process of a new system is influencing the features, it is of fundamental importance. In accordance, the integration of maintainability thoughts should be considered during this process. Hence, the designer should be provided with basic information to assess the maintainability during the design stage. Doing so, maintainability of a system can be influenced by the decisions made to reach specified requirements and to avoid inconsiderate decisions in terms of maintainability.
Chen and Cai stated that “DFMAIN is concerned with achieving good design that consider the general care and maintenance of equipment and the repair actions that follow a failure” (Chen & Cai, 2003, p. 147).
Design for maintenance is one important section of the 16 stages of system design and development by Blanchard which is displayed in Figure 10. During operation of a system changes or improvements are highly cost-intensive. The avoidance can be reached with implementing design for maintenance at the beginning of the design stage of the system. Following some benefits are given (Blanchard, 1991):
31
The system will last longer
By executing at high efficiency, operation costs is reduced
Due to avoidance of failures, unexpected downtime is reduced
Due to decreasing the time needed to examine maintenance tasks, expected downtime is reduced
To make maintenance tasks easier and faster the system design parameters are highly influential and therefore of great importance (Blanchard, 1991).
Figure 10: System design integration (Blanchard, 1991)
According to Blanchard these design parameters are both conflicting and supporting. A detailed breakdown is unfortunately not given but there are a couple of examples given. Obviously a high safety standard is always combined with investing money; therefore it is conflicting with the economic feasibility. An example given for two supporting design
32 parameters are the design for disposability and the design for reduced environmental impact. If a machine is constructed with recyclable material, the environment impact is lower.
3.4.1. DFMAIN guidelines
DFMAIN has the purpose of reducing the likelihood of damages to the equipment of a system or to the product while servicing and maintenance or even better to eliminate the requirement of maintenance. For a straightforward implementation of DFMAIN at the beginning of the design stage, a range of standard guidelines function as assistance (Chen & Cai, 2003). Using them can cause enhancement of maintainability and product quality:
Complex design implies consequences in terms of increasing maintenance and production costs. Therefore keep it simple in terms of functions and physical attributes. The reduction of modules or the amount of components is most helpful concerning the knowledge of technicians as well as the tools which are needed for maintenance and equipment.
In terms of inspections, replacements, assembly of parts or repair, there should be sufficient access to the machine or production cell to keep those tasks as easy as possible.
Usage of modules or standard parts because they are easy to acquire due to a range of offers. Especially those parts which are likely to fail. Apart from that it also eases the maintainability itself.
Use modular design in order to test and maintain subassemblies at that level and not in the end at the final assembly.
Design the assembly and disassembly as easy as possible and reduce the amount of parts because the less difficult assembly and disassembly is the easier is maintenance.
Keep diagnosability as easy as possible.
Provide the machine with signals to avoid accidents. Critical components should be provided with identification, arrows and checkpoints should be marked clearly.
Parts which have to be removed or replaced at some point should not be that heavy or hard to handle. Safety guards help to avoid contact with moving parts, high voltage line or high temperature.
Make manuals available to support technicians with procedures and maintenance instructions (Billatos SB; Basaly NA, 1997).
33
3.4.2. Design review
According to Thompson the design review is clarified as:
“The quantitative and qualitative examination of a proposed design to ensure that it is safe and has optimum performance with respect to maintainability, reliability and those performance variables needed to specify the equipment” (Thompson, 1999, pp. 148-149).
The design review method should support designers to improve design activities. For the design activity it is of considerably importance and an essential part. According to Chen and Cai (2003) the benefits of the design review methodology are:
Added assurance that the voice of the customer has been heard correctly
Reductions in design cost and time-to-market
Reduced likelihood of program delay due to unexpected problems
Improved overall design integrity
Prevention of problems and associated downstream costs
Increased standardization
Improved customer satisfaction
Increased program structure and control
It is not surprising that the design review method is in wide use due to these benefits. A benchmarking survey resulted that 89% of 72 companies which are leading companies in seven different industries make use of the design review method as an assurance tool (Criscimagma, 1997). Hence, the method is one of the most important tools to obtain maintainability. As displayed in Table 3 there are different activities at the levels of design such as the review of the design specification, the system level design, functional unit evaluation and component analysis. The evaluation is a general part which helps to assess customer mentioned criteria versus the status of arising design to move forward to the next step of a project (Chen & Cai, 2003).
34
Activity Purpose Timing
Review of the design specification
To ensure that the significance of all the points contained within the design specification is understood
Prior to the commencement of any design activity
System level design
(1) To identify critical areas of the design that may affect plant availability and to comment on the advisability of pursuing projects with a high risk content
(2) To examine equipment groups to maximize uniformity and suitability and to maximize the reliability systems formed by manufacturing and process consideration
Prior to the start of functional unit design
After the completion of the first functional unit design
Functional unit evaluation
To evaluate quantitatively critical items of functional unit and to undertake qualitative reviews of functional unit generally
After the completion of the first detail design
Component analysis
To check that certain important sets of components will not give rise to say, maintainability problems in service
After the completion of the first detail design
Table 3: Design review procedure (Chen & Cai, 2003)
In order to achieve the best performance the focus on almost every design process is to realize a machine or a system in general in perfect functionality. Due to the fact that maintainability as well as supportability of a machine or system are not implemented at the functional demand, there is a risk of interfering the demand by the maintainability and supportability during operation (Tinga, 2013). Mulder, et al. give some examples to reach a good maintainable and supportable system:
Producing a reliable system, with low numbers of failures, reducing the absolute amount of maintenance required;
Making the system easy to maintain, thereby reducing the average maintenance time;
Ensuring that the system is easy to support, reducing the costs of supplies and facilities (Mulder, et al., 2012).
3.4.3. System Reliability
The key of designing a system with the purpose to reach a high availability while service is to guarantee that the system covers high reliability. When a system is running well and it is quite unusual that a failure occurs and thus maintenance is just marginally needed, the effort of the