CDT307
Bachelor thesis in Computer Science
15 credits, basic level
Improving a Graphical Turntable Simulator
Author: Tom Elssjö
Supervisor: Juraj Feljan
Examiner: Jan Carlson
9
thDecember 2012
This report is about the project of improving an existing program in order to make it more useful. The program simulates a kind of production cell that consist of different components that are controlled by a special controller program. By analyzing the program, several aspects that could be improved were found and those were grouped into three different parts of the problem. The first one is about improving the realism and precision of the simulation. Issues such as unrealistic movement of the components and other types of actions that are different than a real production cell are addressed in this part. Detection of unwanted situations is the second part of the problem. Here unwanted movement and contact are some situations that need to be checked. The final part of the problem is about improving the visualization in the simulator. There are several ways to visualize the production cell that would involve to either use 2D images or 3D models.
Sammanfattning
Denna rapport handlar om projektet att förbättra ett redan existerande program för att göra det mer användbart. Programmet simulerar en sorts produktionscell som består av olika komponenter som kontrolleras av ett speciellt kontroller-program. Genom att analysera programmet, hittades flera aspekter att förbättra och dessa grupperades i tre grupper som utgjorde problemet. Den första delen handlar om att förbättra realismen samt precisionen på simulationen. Problem såsom orealistisk förflyttning av komponenterna och andra typer av händelser som skiljer sig från vad som händer i en riktig produktionscell kommer att tas upp i denna del. Detektion av oönskade situationer är den andra delen av problemet. Här är oönskad rörelse och kontakt några situationer som behöver kontrolleras. Den sista delen av problemet handlar om att förbättra visualiseringen i simulatorn. Det finns flera olika sätt att visualisera produktionscellen som skulle involvera att antingen använda 2D bilder eller 3D modeller.
1. Introduction...4
1.1. Goals...4
1.2. Thesis outline...4
2. Turntable production cell...5
3. Existing implementation of the simulator...6
4. Detailed description of the problem...10
4.1. Simulation detail...10
4.2. Detection of dangerous situations...10
4.3. Visualization...11
5. Improving the detail of simulation...12
5.1. Improving turntable movement...12
5.2. Improving the loading and unloading process...13
5.3. Improving the drilling process...14
5.4. Improving the testing process...15
6. Detection of dangerous situations...16
6.1. Secure drilling...16
6.2. Secure testing...17
6.3. Secure loading and unloading...18
7. Improving visualization...19
7.1. Review of the visualization...19
7.2. Visualization of the components...21
7.3. Simulation visualization control...23
7.4. Statistics and logging...24
8. Discussion...26
8.1. Summary...26
8.2. Future work...27
8.3. Conclusions...28
1. Introduction
This project is about improving a simulator that emulates the behavior of a turntable production cell. In this simulator a virtual rotating turntable transports products to different stations. These virtual products are loaded to the table at the first station and unloaded from the table at the last one. There are several different slots on the turntable so in an optimal case, the different stations can do their work at the same time. A controller program is used to control the different components of production cell, the whole purpose with the simulator is to test out different controllers. That is needed to see how the components of a real production cell would be running when using a certain controller before trying it out for real.
1.1. Goals
The overall goal of this project is to make the simulation more realistic, so that controller programs would affect the simulated production cell more identical to a real one. This in order to give potential users a more detailed and realistic prediction of how different controller programs would work. Also the visualization of the simulator should be improved so users can see how the different stations work. Users should also be able to see if any failures occur and if the virtual production cell is controlled in a way that every product is processed as intended.
There are three different parts of the problem, each part is about improving different aspects of the simulator. One problem is that the initial version of the simulator is coarse and not detailed enough to give an accurate representation of the production cell. The first part of the problem is about improving this by making the functionality of the simulator more detailed. In a real production cell, serious issues could occur if the components are controlled in a faulty way. However, the initial version of the simulator does not address this problem, so the next part of the problem is to add functionality in order to check if any such dangerous situations occur. Finally, it is difficult for a user to see how the different components are moving as the initial version of the simulator visualizes them in a simple way. The last part of the problem is to improve the visualization of the production cell, making it more obvious what each component is doing.
1.2. Thesis outline
The next section (2) describes a turntable production cell more in detail. A technical description of the initial version of the simulator can be found in section 3. Section 4 is about the project, what needs to be done and what problems to solve. There is one section for each part of the project that describes how the problems were solved. Section 5 is about improving the details of the simulation and making the components move more realistically. Detection of different unwanted or “dangerous” situations is discussed in section 6. Section 7 is about improving the visualization of the production cell so that users can have a clearer view of what is happening. Finally the last section (8) summarizes the report and the project and give suggestions to future work.
2. Turntable production cell
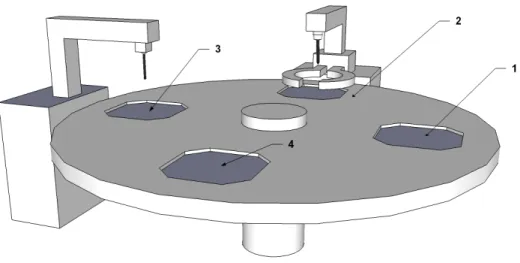
This section is about the production cell (shown in Figure 1) and will describe the different components that it is composed of. The production cell is used for transferring and processing several objects in parallel so that all stations could do various actions such as drilling or testing on different objects at the same time. An “object” refers to the product in question that is processed in the production cell, such as a wooden cube. All objects are assumed to have the same properties and therefore need to be processed in the same way. A turntable is used that reduces the distance to move between the stations and can also be used to move an object back to the previous station. Often, a production facility is composed by several different production cells and this approach is called Cellular Manufacturing[1].
In the first stage (1 in the figure) of the production cell the object is loaded by an external “loader” component to an empty slot of the turntable that transports the object to the next station. The loader is then able to load a new object to the next slot and the driller (2) will begin to drill a hole in the object. In order to do that, the clamps need to secure the object first and then the driller will do the work and the clamps will release the object when done. The next station, the tester (3), will check if the hole in the object is deep enough by using a testing rod. Finally, the object will get unloaded from the last station, also done by an external “unloader” component (4). A controller program sends signals to the simulator (or perhaps a real production cell) to tell the different components to move at a particular speed or do other actions.
3. Existing implementation of the simulator
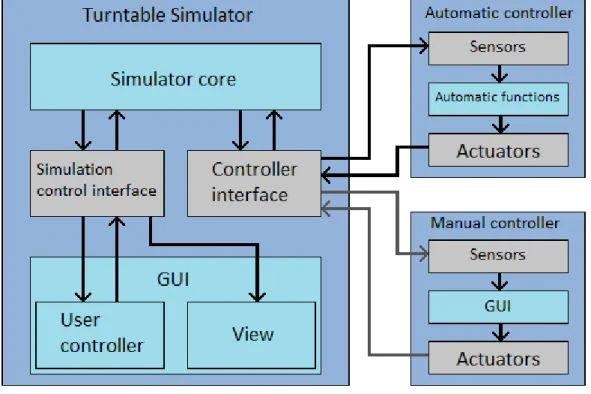
A system architecture over the simulator and the interface of the controllers, developed in previous projects, seen in Figure 2. The actual implementation differ in the way the parts of the system are represented in the actual code, the architecture describes instead the way communication is done. Not every part of the architecture are fully implemented (this project is about improving some of these parts) and this is also the case for the communication between the simulator and the controllers. The controller interface currently does not have the functionality to send sensor data to the controllers. In order to explain the system architecture more in detail, a description of the simulation process is needed.
The simulation process consists of three phases that constantly get iterated from the first phase to the last. The first phase in the process is to read the actuator values, that is the signals that the controllers send. These actuator values are used to tell the components of the production cell to move and what speed to move at. Then in the second step, the model of the turntable production cell is updated and that is done by using values stored such as current speed and positions for every component. There are several sensors used to report when different events happens, for example when the turntable is lined up with stations or when the clamps have secured the object. The third and final step is to update all the senors and the values are supposed to be sent back to the controller, however that kind of functionality is absent in the current version of the simulator.
One part of the turntable simulator system architecture is the controller interface that sends messages to- and receives messages from a controller. The interface should be used to convert the sensor data to messages and send these to the controller. Another usage of the controller interface is receiving actuator values and converting these to signals. After that, the interface forwards the signals to the simulator core. In that part all the logic of the simulation are done and all relevant values are stored and updated. Another part is the simulation control interface, that fetch the simulation data such as sensors and positions of the components. In this part, the simulation data is used for visualization. The simulation control interface just connect the visualization of the simulator and the user controller to the core. The start up sequence begins in the user controller part and the signal travels trough the simulation control interface to the controller interface (not displayed in the figure) that sets up the connection with a controller. Then the controller interface sends a signal to the simulator core in order to run the initial-ization function. The final part of the system architecture is the “view” one that is automatically gen-erated and stores all the labels, sliders and other user interface elements.
All controllers are supposed to be done in a similar way as described below. The automatic version of the controller is supposed to read the sensor values and this would be done in the “sensors” part. The next step is to calculate how to control the production cell using various functions with the sensor values as input, this is done in the “automatic functions” part. Also, this part is where the different automatic controllers differ, as the functionality would probably be unique for each controller. Finally, the “actuators” part is responsible for sending instructions to the simulator.
Even the manual controller works in the same way, but here the “sensors” part is a rather abstract one and refer to the visual feed-back that a user would get from the simulator. Instead of automatic functions, there is a GUI where the user can change the different values in order to control the production cell. The figure shows the connection between the simulator and manual controllers as gray arrows because this kind of controller are used mostly for testing purposes.
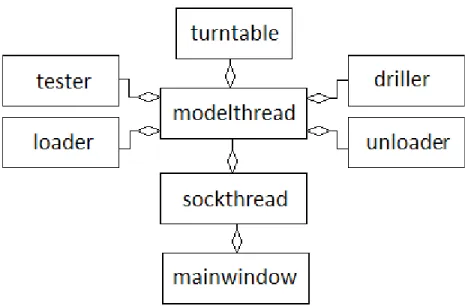
The initial version of the simulator is programmed in the programming language C++ and an object oriented approach has been used where every component in the simulator is a class. These component classes are: loader, unloader, driller, tester and turntable. All of the classes contain the variables of the respective component such as speed, actuator positions and sensors. Also functions that do movement calculations and other types of calculations that updates their part of the production cell model. The driller class is the most advanced one of the component classes because it manages both the drill and the clamps.
All components are manged in the model thread class, that is responsible for calling all update functions in the different components. The communication between the controller and the simulator is manged in the sock thread class. New information that the controller sends is fetched over to the model thread class from the sock thread class. The main window class sets up the different visual elements and updates them according to the different components. Composition is the approach that is used to model the simulator into classes where some classes own others (shown in Figure 3).
The model thread class contains objects of all the component classes. The sock thread class contains an object of the model thread class and finally the main window class contains a sock thread object.
The Qt library[2][3] is used mostly for rendering the visual elements but also manages some of the
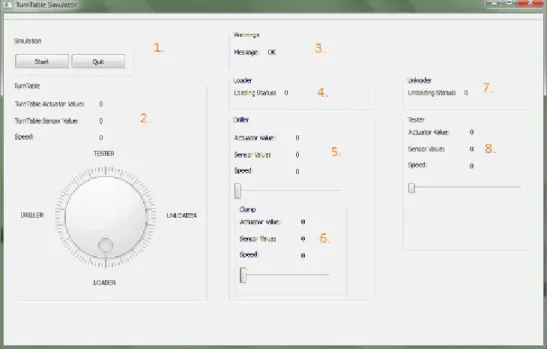
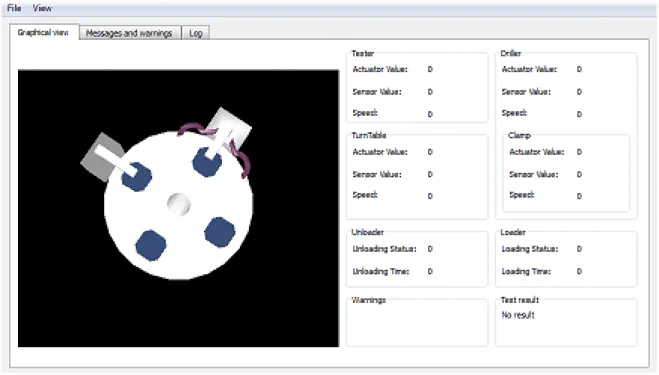
communication between the classes. Remarkable features in this library are “slots” and “signals” that are used for the communication where the signals are used to send messages from a class and the slots are used to receive messages. All component classes contain different signals that sends values such as actuator positions and the main window class connects those signals to the visual elements. The slots are used to give instructions to the different components, for example move the drill or move the table. A graphical representation of the simulator exists in the initial version that visualizes the different components as common graphical user interface elements such as dials, slide bars and numbers (seen in Figure 4). To start the simulation, the user would press the start button in the simulation control region (1 in Figure 4) and then connect a controller to the simulator. The turntable (2) is represented as a dial that rotates to show the current position of the table, there is also a text label that shows the table angle in numbers.
There are also text labels that display the movement speed of the table and the status of the turntable sensor. This is used to indicate that the turntable slots are lined up with the stations. For the driller (5), clamps (6) and tester (8) there are slide bars that displays the position of the actuator between the minimum possible value and the maximum. Similar to the turntable region, there are text labels that display the actuator value, the speed and sensor status for the driller, tester and the clamps. There are two text labels that display the status of the loader (4) and unloader (7): if the respective station is done with the work or waiting (stopped). Finally there is a label displaying a warning message (3) that the dangerous situation checker might generate.
4. Detailed description of the problem
The problem about improving the simulator is dived in three different parts, each of them is to improve different aspects of the simulator. This section will describe each part more in detail and explain the problems that the parts are addressing. The problems mentioned below are not only about imple-menting features but also defining the problems further. All of the parts of the problem contain various issues that need to be solved before implementation and there are some decisions that need to be made. Due to limited available time, one problem is to choose what different issues that should be solved and how much effort that should be put on each issue.
4.1. Simulation detail
This part is about improving the detail of simulation, as almost everything in the initial version of the simulator is very coarse. Some events in the simulator occur very fast compared to a real production cell which of course could lead to many different problems if a controller is build to respond to such events. For example, loading and unloading occur instantly when it actually takes a significant time. This is a problem since if a controller is build on the assumption that the process is instant, that would work on the simulator but not in a real case.
Another example of the issues with a coarse simulation is the movement of the different components, which is unrealistic. Movement could in fact be very different in the reality so the simulator might show very different results than a real production cell. The most obvious example of this is the turn-table that in the simulator can instantly change the movement speed to what is desired. Related to this, the precision of the movement is very coarse and that might lead to visual issues and unrealistic movement similar to what was described before.
4.2. Detection of dangerous situations
One problem is that in a real case, there would be several situations that would be considered to be dangerous. Unwanted contact is one of these unwanted situations: if the production cell is controlled in a faulty way, the objects could hit components such as the drill. This can occur when loading as well if the loader put an object on an already occupied turntable slot.
Unwanted movement is another important type of situation that could lead to serious issues in a real case. As the turntable is transporting the objects to the different stations, it should not move when any of the components are working on the objects. Related issues could occur when loading and unloading the objects, in this case it is required that the turntable slots are lined up with the stations. This in order to make sure that the object will be placed on- or removed from the slot and not anywhere else on the table. There are of course more dangerous situations and one that is important to mention is the drilling process.
The clamps are supposed to hold the objects in place when drilling, else the object will be able to move.
4.3. Visualization and user interaction
Improving the visualization of the simulator and the user control is the final part of the problem. In contrast to the other parts, that are about adding more detail and realism to the simulator, this part is to improve the user feedback. A user would have difficulties to tell what happens in the simulator because the visualization is made by text labels and user interface elements in the initial version of the simu-lator. This makes it hard to actually tell which components are moving and the current status and positions of the said components. The processed objects are not visualized at all, so it is impossible to tell whatever an object has been loaded on the turntable to be worked on.
Related to these issues is that a user might want to review the simulation when done to check if the controller did the job in a correct way and collect statistics for various reasons. As for now, there is no way to see how many objects that have been processed as intended or how many objects that ran into a situation that could be dangerous. As a part of the purpose of this simulator, there should be function-ality to check if the hole the driller made in the object is done well enough. Some of the requirements for this could be: the hole needs to be deep enough and be on right position on the object.
5. Improving the detail of simulation
In order to solve the problems about coarse simulation detail, the initial version of the simulator was analyzed in order to find the most apparent issues. That list of the different issues can be found below, the motivation for why a certain issue was chosen and what was made to improve it can be found in the respective subsection.
• Improving turntable movement
The turntable should move more realistically, rather than changing the speed instantly it should accelerate or decelerate until the desired speed is reached.
• Improving the loading and unloading process
In order to solve the problems with instant loading and unloading, a delay will be added to the process so that it will take some time to perform those actions. This in order to simulate that the object really got loaded/unloaded since that would take time in a real production cell.
• Improving the drilling process
In order to make the drill movement more realistic, the speed of it should decrease when the drill reaches the object to simulate the resistance of the object.
• Improving the testing process
During testing, the rod should not go further than the depth of an object's hole. While this might seem like a detail, it might be important in order to see that the tester works as intended.
5.1. Improving turntable movement
Transporting the objects to the different stations is the core feature in a turntable production cell. The way to transport the objects are one of the aspects that makes this kind of production cell different to other kinds. Of course the turntable should move in a realistic way and since the transportation is im-portant, the movement issues needs to be solved.
One challenge was to improve the precision of the movement as the initial version use integers for the different variables used for movement speed, positions and so on that would cause several different issues. The most important one is that the value of the maximum angle would else have to be changed in order to create a smooth transition between two values. An obvious solution to those problems is to change the data type to one with more precision.
There are different number data types that can be used to represent the different variables such as speed and position, the relevant difference between those types are the accuracy. In this case floating point variables[4] were decided to be used since that data type is more accurate than integers. The advantages
with using floating point variables is that the the value of the maximum angle do not need to be changed.
Since a whole turn is 360 degrees, confusion could occur if a whole turn was another value in the simulator.
There is also possible to choose to use the double precision data type that is more accurate. Since many mathematics functions use that kind of data type, no loss of precision will occur as it would when using a less accurate data type. However, there might not be practical to use double precision data types since in this case there will appear to be little difference to use more precision than the floating point one. Increasing the precision was needed to be able to move the turntable in a more realistic way, an other implementation was to make the movement accelerated. An approach to implement this feature was to constantly increase the speed until the desired speed is reached. However, the turntable seem to still move unrealistically in a way that make the table to appear to be able to reach the desired speed without any friction. In a real case, the table would move slowly at the beginning and then gradually increase the speed.
There are two ways to solve this problem on, the first way is to just tweak the acceleration constant to make the turntable move slower and perhaps more realistically. The second way is to make the acceleration itself increasing from 0 to the maximum acceleration so that the table moves slowly at the beginning and increases the acceleration over time. However, it is discussable if variable acceleration is really realistic since a real turntable might actually move differently.
The decision in this case was to implement the variable acceleration because if is difficult to find a realistic acceleration constant. It is possible to use the functionality of the variable acceleration to review different acceleration constants, that will however require additional implemetions.
5.2. Improving the loading and unloading process
The loading and the unloading processes are not really a part of the simulator, making issues such as how objects actually got loaded on to the table irrelevant. However, since users could be interested to know how long it takes to process objects, the time to load and unload the objects have to be included in that calculation. There are of course other reasons why the loading and unloading process should be improved. For example, the components can be controlled in a faulty way if it is assumed that loading and unloading occur instantaneously as in the simulator.
Timing was used to make delayed loading and unloading so when the controller tell the loader or un-loader to start the process, a timer will start. When the timer has reached the desired delay, the sensor for the station in question will tell that the work is done. If the controller cancel the loading or unloading process before it is done, the timer will always be reset so the station need to go through the whole delay again. It might be more realistic that the loader and the unloader could start from where it got canceled or that the progress move backwards in the same matter that it progress. But for the sake for simplicity and lack of time neither of those was implemented.
Another feature to implement is to keep track of the results of the loading- and the unloading processes. These results are that a object will be placed on the turntable when the loader is done and a object will be removed from the table when the unloader is done. In order to implement this feature, a data representation of those objects was needed.
This is used to visualize the processed objects and to improve the detail of the simulation. The data representation are also used to solve different issues such as handling contacts, empty slot checks and erroneous drilling that of course could be solved in other, perhaps less realistic ways. A class called “virtualitem” was created in order to store the data for every object, it contains several variables that describe the objects such as the size of it and drill resistance.
The objects of the virtualitem class are stored in an array that the turntable class has in order to represent the table slots where an empty slot is set to NULL. Two functions were added to load to- and unload objects from the table. When the loader is done with the loading process, an object will be placed on the table. The unloader works in a similar way, but removes objects from the table instead. The table slot that is going to be loaded on or unloaded from is the slot that recently passed the station.
5.3. Improving the drilling process
The driller moves in an unrealistic way and that is a problem that could lead to several issues. The drill is important in the simulator since the purpose of the production cell is to drill holes in the objects. This is why the drilling process should be improved in order to make drilling holes in objects more realistic. Similar to the turntable, the data type used to tell the position and movement speed for the drill needs to be switched into one with higher precision. For the sake of consistency, floating points was used for the same reason as they was used as the data type for the variables of the turntable. Worth mentioning is that the data type used to the variables for the clamps of the driller was not changed as the exact position of those is not important and would just require extra work.
The most important issue to solve is that the speed of the drill would in reality slow down once it hit the object that is going to be drilled because the friction is greater when drilling in the object compared to when drilling in the air. There are several alternatives to do this and one of them is to subtract a constant amount from the drilling speed so no matter how fast the drill is, the speed will decrease with the same amount. This solution is a simple and quick one but might not always be realistic. A second solution is to make the speed decrease proportionally with the current drill speed, this might be a more realistic solution since the speed would decrease with a significant amount no matter how fast the drill is. A significant downside with this approach is that the driller would always move no matter how low the speed is. This is why the first solution, to just decrease the speed using a constant value, was selected and also because lack of time.
To implement this feature, the speed to subtract from the drill have to be stored in the virtualItem class, known as “drill resistance”. Then when the drill hit the object, the drilling speed is subtracted by the amount of the drill resistance.
To make the speed decrease in a more realistic way, changes were made so the speed of the drill decreases over time rather than that the speed instantly turn into the resulting speed when the drill hit the object. Another feature that was implemented was that the drill would stop if it does not have enough speed.
5.4. Improving the testing process
Finally, the testing process need to be more realistic, it should not be possible to move the testing rod further than the hole depth of a virtual object and this detail might have a big impact on the simulation. Another reason to improve the testing process is that it would be important in a real case to measure the hole depth on the objects in order to determine if the objects were correct. Even if that is not is needed in the simulator, the virtual tester should respond in the same way as a real one would in order to make sure that the controller works as intended.
The data type used for the variables in the tester class needed to be changed, because the testing rod would not reach the same position as the hole depth of an object if the later is measured in more precision. Even here, the floating point data type was chosen and the process was similar to what was done when improving the turntable and driller.
To limit the testing rod to go further down than the hole depth, a check was made at the time when the testing rod is moving. The exact hight that the testing rod could reach was calculated with help of the assumption that the object is at the y position 0 and that the hole should be drilled through the whole length of the object. It was also decided that the sensor should not indicate that the tester have reached the bottom if the object have not been drilled fully down. In that way, there is possible to determine if the hole got drilled deep enough. However, that might cause some controllers to wait forever since they are dependent of the tester sending the down sensor signal.
6. Detection of dangerous situations
The design question in this part of the project is what a dangerous situation is and when they occur. The list of issues was made by deciding what groups of components that should be checked for unwanted situations. An issue was made for each component group and every issue address some of the situations that could happen that involves the said components.
• Secure drilling
There are many situations that can occur when drilling. The ones selected for this issue is: drilling when the turntable moves, contact with the drill and one object and drilling without having secured the object with the clamps.
• Secure testing
When running the tester there are two related situations that needs to be checked. Those are contact with the testing rod and testing when the turntable moves.
• Secure loading and unloading
This issue is about checking two different dangerous situations when loading and unloading objects. The first situation occur when loading up on an already occupied table slot and the second situation occur when the loader or the unloader is running and the turntable is moving.
6.1. Secure drilling
Controlling a driller is not a simple task and there are many things to consider when drilling. For example the object to drill needs to be on exact place and secured in proper way in order to drill the hole as intended. Only some of these things can be covered in this issue, but the point is that since drilling is important, it is also important to check some of the different situations that could occur. The checker class is responsible for checking for dangerous situations. That class existed in the initial version as well but there was no functionality. So as the project progress, functions got added to check for different dangerous situations. One of those that was chosen for this part is to check if the clamps have secured the object when drilling. To implement this, the reference to the driller object got passed to the checker class and several methods were added to the driller class to check that the clamps had secured the object and that the drill is up and not inside the object. A message will be added to an array if the drill is inside the object and the clamps have not secured the object. The array is intended to store the different messages that different dangerous situation check might generate and then display all the messages.
Another situation to check is if any object hits the drill. In order to implement the contact check a function was made to check if the drill was down enough to hit the object and if the turntable was not lined up with stations. In order to determine if the object hit the drill, the positions of them need to be updated according to the angle of the turntable.
The Axis Aligned Bounding Box (AABB)[5] hit check method is used to check for unwanted contact
between objects and components. This means that every object has a bounding box that follows the object but not rotates. Contact will occur if the hit point for the drill is inside that box. To ensure that the function never misses a possible contact, the bounding box have to be bigger than the object. This is because the drilling rod is represented as a single point and not as a shape that cover the whole drill. Finally the last kind of dangerous situation to detect in this issue is if the driller is running when the turntable is moving. The process to check this situation is: check if the drill is inside the object or the clamps have secured the object and then check if the turntable speed is more or less than 0.
6.2. Secure testing
Making sure that testing is done in a secure way is important, because components could break if this is done in a faulty way in a real production cell. The situation that could occur when moving the testing rod is the the object could hit the testing rod.
Checking if any object hit the testing rod is the only feature that was implemented in this issue. Worth to mention is that a separate turntable movement check was implemented that have longer detection range than the contact check. Since there is only possible to hit the testing rod, this functionality have little use. The only possible usage of the table movement check is to warn that the object could hit the testing rod if the speed of the turntable is fast enough. Both the contact check and the turntable movement check are done in the same way as when implementing those features in the previous issue.
6.3. Secure loading and unloading
It is important that the loading and the unloading are done in a proper way, the other stations are dependent of that the objects are placed on table slots and nowhere else. What needs to be detected in this issue is if the loader or unloader is running while the table is moving. The external processes to place objects on - or remove objects from the turntable are most likely dependent on that the table is in the same place during the whole process. Another dangerous situation to detect is if the loader is attempting to put an object on an already occupied slot, that could be dangerous.
The turntable movement check was implemented in the same way as in the previous issues, by checking if the turntable movement speed is greater or lower (moving backwards) than 0. In this case the check is done when the timers used to delay the loading- and unloading process are running.
To implement the loading on an occupied turntable slot check, a function that checks if the loader is running is called. Then, if so, another function is called that checks if the turntable slot that currently is at the position of the loader is empty. Both of those functions have already been implemented to solve other problems in this project.
7. Improving visualization and user interaction
The main issue with improving visualization is about showing the production cell in a way so that it is more obvious what is going on compared to the initial version of the simulator. However this part is not only about improving the visualization of the production cell, it is also about collecting and displaying other information that can be useful when reviewing the simulator. As done with the other parts of the project, a list of different issues was made:
• Review of the visualization
This issue is about selecting the way to show the production cell and the practical details of how to set up the visualization. The setup required to do the rendering will be know as a rendering engine. There are existing engines that make the setup process more simpler, however there are several different rendering engines available so another choice need to be made.
• Visualization of the components
The process to actually show the components is described in this section. One problem to solve is that some components might not appear as clearly as other components.
• Simulation visualization control
The user would like to control the visualization in a way that make in possible to choice what to see and, if a 3D model is used, where to look at the model in what angle.
• Statistics and logging
This issue is about displaying additional information about the simulation. This information contain statistics about how many times an event occurred, such as loading objects on the turntable or when a dangerous situation occur.
7.1. Review of the visualization
One problem was to choose the way to visualize the production cell and there are two different approaches. The first way is to compose the visualization by various 2D images, probably one for each station and one for the turntable. Those images would be animated and have to show the different components in the most optimal angle so the more information could be seen using less images that crowd the application. A big problem with the 2D view of the simulator is that it could be difficult to visualize the whole simulator as the system needs to be seen from different angles.
The second way to visualize the production cell is to use 3D[6] models for every component. The user
should then be able to choose how to look at the models by moving, turning and zooming the camera. In terms of 3D rendering, a “camera” refer to what point in the 3D space you are viewing the scene from and what angle you are looking at. The 3D visualization has more practical issues, the most important one is that it might require a lot of computation power if the user want to see a detailed view of the whole simulator.
The decision in this case was to use 3Dmodels because it offers more control over what to look at on the production cell. There are no real advantages to use 2D images to show the production cell other that it might be faster and simpler to implement. Another motivation to use 3D models is that the production cell would clearly appear as one system. If 2D images were used, every image might appear as an own system that are irrelevant to other images. Also movement of the components are more apparent in a 3D view and that would help the user to get an idea of what is controlled.
Another problem was to choose the how the rendering process should be made. The options are to either to use an already existing graphics engine that do the most of the work or implement all features needed using just the OpenGL library for rendering. A review was made in order to determinate how the engine should be implemented. The following features need to be in the engine, either as features from a library or implemented on its own:
• Loading 3D models from files by parsing them.
• Showing text either in the 3D view or beside it that display more detailed information and messages.
• Handling input from mouse and keyboard in order to move the camera.
• Showing the visualization in a window that the user can move around on the desktop. • Render the 3D models and animate them by moving and rotating the models.
• Some kind of buttons or menus that the user could choose to start the simulator and save the logs.
The conclusions from that review are that it is difficult to find libraries and connecting those to an engine is a complicated and time requiring process. Because of that it was decided to try out a complete graphics library instead.
Optimally, the graphics library should be small and only have the features needed and not too many extra ones that are unused. That, is of course, impossible and in fact many graphics libraries are big and have many features. There are many so-called game engines used to create computer games, that contain graphical functions that could be used for simulators as well. However those engines also contain other functionally that are used for different things that will not be used in this project, for example functionality to do various physics calculations or playing sound effects.
There is one possibility to stay with the Qt library that the initial version of the simulator is using. A downside of using the Qt library is that is difficult to set it up on Windows without using a certain IDE called Qt Creator. The good point is that there is a module to Qt called Qt3D thats support integration of 3D rendering. Qt3D is a graphics engine itself and all features needed are supported. Another advantage is that the code does not need any heavy changes and it is possible to stay with about the same interface that already is designed and have the 3D visualization in a box beside. Because of the advantages of the Qt3D, mostly because the project was already using Qt, it was decided to use this framework.
In order to put the 3D rendering together with the current implementation, the interface needed to get an overhaul. All information such as sensors, speed and actuator values got moved to the right and a container to display the 3D visualization was created and placed to the left. A class, simulationRenderer was created that mange all of the rendering and camera movement.
7.2. Visualization of the components
A model of the production cell was made by Jan Carlson that was originally used for an article written 2010[7]. That model got divided down to several separate models, one for each component and then the
models were converted to a format (3DS) that could be used with Qt3D. Some models: the drill, the testing rod, the clamps, the objects and the turntable got colored in order to distinguish them from the other models. The models of the objects, the drill and testing rod were made by using the modeling program Blender[7]. In the initialization method of the simulation render class, all the models are loaded
from the 3DS files and then placed in the 3D view. All models are stored in so called scene nodes that contain information such as position, rotation and scale.
The positions of the components were mostly found by trial and error, finding the exact positions would be complicated due of different sized models. Also some of the components needed to be scaled because of that. The same model was used for both the drill and the testing rod, since the user will most likely not be able to tell the difference anyway and both of the components should have the equal length. Also the clamp model got reused as the clamps are composed of two models where one is flipped. In the visualization, the turntable is much more below the stations than it actually might be, in order to see the drill and the testing rod better. However, because of that, the virtual objects need to appear taller than they actually are.
Functions to update the position of the objects, turntable angle, the angle of the clamps, position of the drill and the testing rod was added. Almost all of those functions are slots that the mainwindow calls instead of changing sliders and dials that are now removed. It is important to notice that all these functions call a function to update rendering in order to redraw everything to animate the models.
To rotate the turntable as it moves a rotation variable was used that stores the angle, the axis and the origin of the rotation. The angle is changed when the function that rotates the table is called and that transformation is applied to the turntable scene node. In order to move the objects, their positions got scaled to place the objects in the place where the turntable slots are.
The objects do not rotate, they just move as the turntable moves and this looks unrealistic. A simple solution could be to use cylinders as models of the visualized objects, in that way the rotation do not need to be stored for every object. But due to limited time, this was not changed, since the box model for the objects was already made and set up. There is another function that hides and shows the objects as they are loaded and unloaded, that is done by having an array that store if the objects should be shown.
To move the drill and the testing rod, a translation between actuator values and visual positions was required. As the actuator values have a maximum and a minimum value, the visual position have a range where the drill and the testing rod could be. To calculate the visual position from the actuator value, the range between maximum and minimum visual position got dived with the actuator range to get the scale. Same principle is used for the clamp angle calculation but here one of the clamps needs to go in reverse direction.
7.3. Simulation visualization control
There are already some functionality in the Qt3D library to control the camera in order to move, rotate and zoom the view. The user would control the camera by clicking and dragging with the left mouse button, scroll with the scrolling wheel and use the keys on the keyboard. In order to zoom the user can scroll while the mouse pointer is inside the 3D view. To rotate the view, the user presses the left mouse button and then, while holding it down, moves the mouse pointer in desired direction to rotate. It will appear as if the model is rotating since the camera moves around a center point and always face that point. Finally to move the camera, the process is identical to rotating camera, but the difference is that the user should hold down the Shift key to do so.
However, when scrolling on the mouse wheel, the camera zooms in or out with a small amount that means that the user will have to scroll multiple times in order to come close the object. In order to solve this, custom functionality was needed that do the same calculation as the built-in function do to zoom the view. The mouse wheel event function got overridden to listen for events that occur when the user scroll the mouse wheel. To move the camera closer to or more far away from the target, the direction got calculated. Then the direction was used to move the camera by multiplying it with the number of steps you have scrolled.
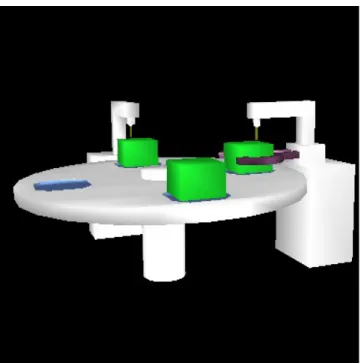
Figure 7: A 3D view over the production cell with two objects on the slots.
Figure 6: The 3D view of the production cell seen from another angle. The drill and the testing rod can be seen in the picture.
Also moving the camera could be improved since the movement was too slow and it does not seem to be able to move in all directions. To improve this, an additional way to control the camera was added by clicking and dragging with the right mouse button to move it the direction. This was done by implementing functions that listen to events that occur when a mouse button is pressed or released and the mouse pointer is moving.
Both the camera position and the camera target are changed by the same amount as the mouse pointer moves. The calculation of the camera position do not use the camera rotation, so the camera will move in the same direction no matter how it is rotated. Users might not think that this kind of movement is useful because it could be hard to move the camera. However making the movement of the camera more easier to control by moving it in the direction the camera is facing would be more complicated. Another feature that was implemented was to reset the camera position to where it was at the initialization. In order to do that, the start position and look at point are stored and then set the camera variables to the stored ones when the users choose to reset it. Some more options implemented is to place the camera so it looks at the driller or the tester. This was done in about the same way as when resetting the camera, but setting it to other variables instead.
7.4. Statistics and logging
Collecting statistics about the simulation is also important in order to review controllers. In that way it is possible to do an automated run of one controller without having to watch the simulation if the user so wishes and then the user can check the logs in order to tell how the simulation went. Of course, one problem is to determine what kind of information that is needed in order to make the logs useful.
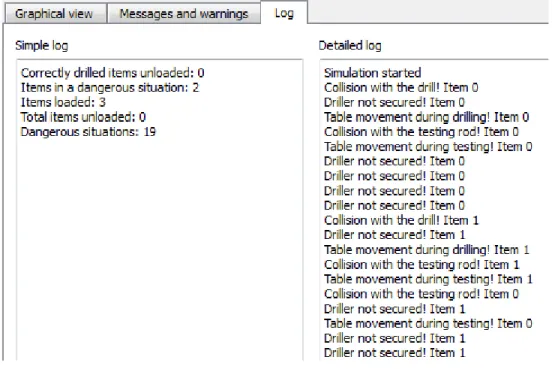
A class called “logger” was created to save the various warning messages that the checker generates to a file. The checker class use a reference to an object of the logger class to be able to save the messages. A menu was added to the graphical interface that replaced the Start and Exit buttons and the option to save the log file was added into that menu. The user can choose where to save the log file in a file dialog using the class QFileDialog in the Qt library, that also is used to save the file.
However it was difficult to get an overview of how many objects that passed the hole depth test and the amount of ones that got into a dangerous situation when reading the log. To solve that, the logger was changed to show statistics about the simulation in the file as well. The statistics that the logger shows are the number of objects that: were correctly drilled; were in a dangerous situation; were loaded and unloaded and the total number of dangerous situations.
In this case, “correctly drilled”, refer to if the hole drilled in an object is deep enough and that check is made during unloading. One issue was how to determine if the same object run into different dangerous situations and that was solved by having an array containing different states about the objects.
An option to save a “Simple Logfile” with just the statistics was added in case that the users think it is not relevant exactly what dangerous situations that were encountered during the simulation.
A feature to implement was to show warning messages in the visual view as well. Due to lack of space in the GUI, a tab control was added that contain the simulation view in one tab and all messages in another tab. Also the positions for all the objects are shown in the tab if the user want to know the exact position of those. This can be seen in Figure 8.
Figure 8: The new messages and warnings tab showing several warning messages and virtual object positions.
8. Discussion
This section summaries the report by describing what problems were solved and what the main contributions are. Suggestions to future work will also be discussed here. There is still room for various improvements in the parts that have been worked on in this project and in aspects of the system that have not been covered in this project. Lastly, conclusions will be drawn about this project by comparing the initial version of the simulator with the final one.
8.1. Summary
As mentioned in the introduction section, the goals with the project are to make the simulation more realistic and making the components behave more like as in a real production cell. Also to improve the usage of the simulator, it should be able to detect and report unwanted or dangerous situations. Finally the visualization of the production cell should be improved so that users get a clearer view of how the components are controlled.
Some of the most the most important issues that were covered in the first part of the problem is that the components are in the initial version able to change the speed instant. For example, the turntable is able to directly stop right on the spot when moving at full speed. Another example is that the loader and the unloader place- and take objects from the table instantaneously, although in reality this would take some time. This leads to that the simulator are showing things inaccurate compared to a real production cell and gives an estimation that significantly differs from the reality about how long time a run in the production cell would take.
To improve the functionally of the simulator, one thing to do is to detect unwanted situations in order to prevent those from happening in a real case. The unwanted situations are best explained with some examples, one is if the drill start working on the object without securing it using the clamps. Another example is that the turntable should not move when any of the stations are working on an object. Such situations could be dangerous in a real case so it is important that the simulator is able to detect some of the most important situations.
It is difficult for a user to see what is actually is happening in the production cell in the initial version of the simulator. The final part of part of the problem is about improving the visualization that in the initial version consists of labels that display simulation data. There are also other graphical user interface elements that show the positions of the components. However a new user would most likely not even know that those elements are supposed to represent the different components of the production cell.
In order to solve all three parts of the problem a list of different issues was made for each part. In the first and the second part of the project, that list consisted of the different aspects to improve in terms of realism and finding unwanted situations.
One example of an issue that was solved in the first part was to improve the movement of the turntable. The most important improvement was to increase the precision of the speed and position variables and make the turntable to accelerate to the desired speed. Improving the loading and unloading process is another example of an issue. Timing was used to delay the processes, so when the controller tells the production cell to load or unload a component, a timer starts. When that timer has reached the loading or unloading time, an object would be placed or removed from the table.
Another feature that was implemented was making a data representation of the objects loaded to- and unloaded from the table. This is used in various situations to solve other problems, for example checking contact with other components, visualizing the objects and collecting statistics.
One example in the second part of the problem about detecting dangerous situations is that the drilling should occur in a secure way. The object needs to be secured by using the clamps in order to drill on it and that was one of the situations to detect. Other situations covered in that issue are contact with drill and table movement when an object is secured by using the clamps. Two kinds of situations could occur during loading and unloading. The situations to detect in this case are loading and unloading when the turntable is moving and placing an object to an already occupied turntable slot.
To solve the last part of the problem about improving the visualization, the problem part got divided down further into four different issues. The first one is to decide how to visualize the production cell. The decision was to use 3D models and in order to do that, a certain graphics engine where chosen called Qt3D. Next issue is about the process to render the components. There where already models made of the production cell so the challenge was to place them at the right place. Also, some models got colored in order to increase the visibility of these. The third issue is to made the user able to control where to look at the model of the production cell and thus being able to see the production cell as desired. Most of the work was already done by using features in Qt3D but functionality was added to move the camera in any direction and to increase the movement speed.
A final issue is to collect and show statistics about the simulation, this in order to summary how well the production cell was controlled. The information that is collected is: the number of loaded an unloaded objects, the amount of objects that have passed a certain hole depth test, the number of objects that where in a dangerous situation and the total amount of such situations.
8.2. Future work
To begin with potential improvements in the scope of this project, one of these improvements is to store where on the object the hole has been drilled. This could also apply to the tester, so if the object is not on the exact right spot, then the testing rod would measure another point on the object. Changing the variables of the simulation to more realistic ones measured from a real production cell instead of just having made up variables is another improvement.
The drilling process could also be improved, for example making the speed of the drill accelerate or decelerate instead of just changing the speed instantly.
One additional situation that could be checked is contact between objects and the clamps of the driller. Also, another contact check method could be used instead of the axis aligned bounding box method. When it comes to detection of unwanted situations, the variables of ranges and testing intervals could be adjusted to be more realistic.
Improvements for the visualization could be to show the holes in the objects when the driller made them. It is still a bit difficult for a user to see the drill and the testing rod, so one improvement is to highlight these in the visual view. Also the dangerous situations could appear more clearly than what they do in the current version.
An issue is that the user has to compile the program to be able to run it and an end user should not have to do that. The program should in an optimal case be able to run on any computer without that the user have to do something else than installing the libraries needed. This problem finally end up as a future work task because lack of time.
Some suggestions beyond the scope of the project is to improve the communication between the simulator and the controller. The sensor values of the components are supposed to be sent from the simulator to the controller, but that kind of functionality is absent. A requirement from many controller programs are that the sensor data is needed in order to work properly and this is why this should be implemented.
Also, there is no support for communication using Berkeley Sockets so the simulator will not work on Unix like systems such as GNU\Linux or Mac-OS. A further improvement is to implement that so that more could use this application as everything else could work without any changes with Unix like systems.
Making a controller program is another feature to implement, there is one that was made in earlier projects but it was very simple and do not control the components in a correct way. This could help to test that every component works as intended and could serve as a template for other control programs.
8.3. Conclusions
The problem with improving the realism is that this particular production cell does not exist in realty. It is therefore difficult to tell how the different components should move. In fact, all constants and values and sometimes whole calculations used in this project are made up. That is of course not realistic and the movement in a real production cell could significantly differ. However, compared to the initial version, there is more functionality to move the components realistically in the final version. In that way, the realism has been improved and the movement of the components are more like a real production than the initial version.
Unwanted situations are also difficult to determine and the stations could have sensors that prevent them to be controlled in an unwanted way. Even if that would be the case, it is still a waste of time that the controller is attempting to tell a component to move when it can not. That makes checking for unwanted situations useful anyway, unless it is strictly known that a certain situation could not even happen. The same argument as the first part of the problem applies even here: as the ranges and other values used to detect the unwanted situations are just made up, they are most likely not realistic. In this case, it might be enough to change those ranges in order to make the detection of the situations more realistic. The implemented functionality to detect unwanted situations is useful because it can be used to check that the controller always does the correct action, regardless of the values being realistic or not.
The visualization and user interaction are more informative and dynamic in the final version compared to the initial version. However, since a dial was used to represent the turntable in the initial version, there might actually make it easier for a user to tell the exact position. But it is still possible to read the exact position on the label beside the 3D visualization in the final version, so there is no information that have got missing. A problem with the logging functionality might be that the summarized information might not tell enough about the simulation. However, that is a question of user experience and the information collected in this project was determined be useful.
The simulator that have been worked on in this project is more useful then the initial version. The 3D view might be the most apparent difference between the two versions because that it is a visual feature that the user notices at once. But in fact, equal effort have been put to solve the three parts of the problem and since the improvements have made the simulator more useful, this project is a success.
References
[1] A macro/micro modeling approach to the simulation of cellular manufacturing systems Suraj M. Alexander, William E. Biles, Gerald W. Evans, Ismail M. Zahran, 1990
http://dl.acm.org/citation.cfm?id=328885.329049
WSC' 90 Proceedings of the 22nd winter simulation conference
Department of Industrial Engineering, University of Louisville, Louisville, Kentucky
[2] Qt for Symbian
Frank H. P. Fitzek, Tommi Mikkonen, Tony Torp, April 2010 John Wiley & Sons, UK
[3] Developing a generic OpenGL Qt Viewer Jonas Minke, August 2009
http://amadeus.ifi.uzh.ch/pax/index.php/publication/show/id/1338
Visualization and MultiMedia Lab, University of Zurich, Switzerland
[4] What every computer scientist should know about floating-point arithmetic David Goldberg, March 1991
http://dl.acm.org/citation.cfm?id=103163
ACM Computing Surveys, Volume 23 Issue 1 Xerox Palo Alto Research Center, Palo Alto, CA
[5] Real-Time Collision Detection and Response Fabio Policarpo, Aura Conci, October 2001
http://ieeexplore.ieee.org/xpls/abs_all.jsp?arnumber=963082
Computer Graphics and Image Processing, 2001 Proceedings of XIV Brazilian Symposium on Paralelo Computacao, Niteroi
[6] 3D Math Primer for Graphics and Game Development Fletcher Dunn, Ian Parberry, October 2011
A K Peters/CRC Press, USA
[7] Integrating Behavioral Descriptions into a Component Model for Embedded Systems Aneta Vulgarakis, Séverine Sentilles, Jan Carlson, Christina Seceleanu, September, 2010 36th Euromicro Conference on Software Engineering and Advanced Applications (SEAA) IEEE, Lille, France
[8] Beginning Blender
Lance Flavell, December 2010 Apress Media LLC, New York, USA