SAYAKA OSANAMI TÖRNGREN
ATTITUDES TOWARDS INTERRACIAL
DATINg AND MARRIAgES
– EXAMINATION OF THE ROLE OF
INTER-RACIAL CONTACTS IN MALMÖ, SWEDEN
MIM Working Papers Series No 11:2
M IM W or k IN g P aP er S Se r Ie S N o 11:2 M A L M Ö 2
0 MALMÖ INSTITUTE FOR STUDIES
MIM Working Papers Series No 11:2
Published
2011
Editors
Christian Fernández, christian.fernandez@mah.se Anders Hellström, anders.hellstrom@mah.se
Published by
Malmö Institute for Studies of Migration, Diversity and Welfare (MIM) Malmö University 205 06 Malmö Sweden Typesetting by Holmbergs AB, 2011 Online publication www.bit.mah.se/MUEP
Sayaka Osanami Törngren
ATTITUDES TOWARDS INTERRACIAL
DATING AND MARRIAGES
– EXAMINATION OF THE ROLE OF
INTER-RACIAL CONTACTS IN MALMÖ, SWEDEN
AbstractThis paper presents the preliminary findings of my ongoing disserta-tion project on attitudes towards interracial marriages. The findings are based on an anonymous postal survey conducted in Malmö, and the ana-lysis focuses on 461 white European respondents who have answered the questionnaire. The result shows that the majority of the respondents can imagine dating or marrying interracially, however there are clear preferen-ces of different groups. This paper also exhibits that respondents who have reported interracial friendships, and not general or superficial contacts, are more apt to answering to the question of interracial dating and marriage positively.
Key words: attitudes, interracial dating, interracial marriages, contact
hypothesis, group position
Bio note: Sayaka Osanami Törngren is a PhD candidate in IMER at
Malmö University and REMESO Linköping University, and also a member of Malmö Institute for Studies of Migration, Diversity and Welfare at Malmö University.
ATTITUDES TOWARDS INTERRACIAL
DATING AND MARRIAGES
– EXAMINATION OF THE ROLE OF
INTER-RACIAL CONTACTS IN MALMÖ, SWEDEN
1Intermarriage2, although it is an area of research interest in many other
countries, has not yet been a common topic of research in Sweden. The actual number of interracial or interethnic marriages is unclear, simply because individuals’ ethnicity and race are not officially registered in Sweden. Some ethnographic studies are published and some attitude surveys include questions on interethnic relationships; however there has not been any study that specifically focuses on the attitudes towards interracial marriages. Interracial marriage challenges people’s idea and boundary of “us and them”; therefore studying attitudes towards interra-cial marriage reveals much about rainterra-cial and ethnic relations.
This paper presents the preliminary findings of my ongoing dissertation project on attitudes towards interracial dating and marriage. The study gathered both quantitative and qualitative materials3. The findings that are
presented in this paper are based on the quantitative study, a postal survey conducted in Malmö, where thirty percent of about 293,000 residents are born abroad, and nine percent of the population has two parents born outside of Sweden (Avdelningen för samhällsplanering, Malmö Stad 2010). This study is inspired by Johnson and Jacobson’s study which examines white Americans’ social settings of contact and attitudes towards interra-cial (Johnson and Jacobson 2005). Applying the Contact Hypothesis and perception of threat as a theoretical framework, this paper specifically aims to examine the differences in attitudes towards interracial dating and marriage depending on different groups among the majority in Malmö, and the effect of interracial contact on the attitudes.
1 This paper presents part of my doctoral dissertation and is based on the paper
presented at ESA 9th conference in 2009.
2 Terms such as intermarriage, mixed marriage, interethnic marriage, cross ethnic marriage are commonly used in Swedish context when describing a marriage between two persons of different culture, ethnicity or race. In this paper I use the term intermarriage and interracial marriage.
3 I have gathered empirical materials through first carrying out a large scale survey and then carrying out follow-up interviews based on the survey result.
STUDIES ON INTERRACIAL MARRIAGE IN SWEDEN
There has not been any study that specifically focuses on the attitudes towards interracial marriages in Sweden, however there are some statisti-cal analysis and ethnographic studies on marriages based on the country of birth; moreover some attitude surveys include questions on interethnic relationships.
In 2010, Statistics Sweden (SCB) published statistics on intermarriage: While prior statistics on intermarriages was based on the country of birth4,
therefore only taking into account the marriages between first generation immigrants and Swedes, the new figures specify the country of the birth of parents, which enables the numbers to include the second generation as well. According to the report, around 173,000 couples have built a family in Sweden during the period of 2004 to 2008. Among those, nine percent or 16,000 couples consist of one partner born in Sweden between two Swedish born parents, ethnic Swedes, and one partner born outside of Sweden, first generation immigrants. According to the statistics, more than eighty percent of ethnic Swedes started a family with a person with the same background, and seventy eight percent of those who have one parent born abroad and one parent born in Sweden, persons born in mixed mar-riages, established a relationship with ethnic Swedes. Fifty five percent of men and sixty percent of women born in Sweden with two parents born outside of Sweden, second generation immigrants, built a family with ethnic Swedes; however it should be noted that the applicable individuals in this category are mainly persons with origins in the Nordic5 or other
European countries, therefore intermarriage among persons of non-Euro-pean origin is limited. Statistics show that individuals with parents born in Syria, Lebanon or Turkey established a relationship with ethnic Swedes to the least extent. Among the ethnic Swedes, five percent of women and six percent of men are family with a person born abroad. Ethnic Swedish women often built a family with a man born in Great Britain or Finland while that of men often started a relationship with women born in Thai-land or FinThai-land (Statistics Sweden 2010:89). This new statistics shows the same pattern of marriage since the 1970s as Cretser’s study exhibits 4 See for example Gun Alm Stenflo, ”Kärlek Över Gränserna (Love over the borders),” VälfärdsBulletinen.3 (2001), <http://www.scb.se/Grupp/allmant/_dokument/ A05ST0103_03.pdf>.Martin Dribe and Christer Lundh, ”Intermarriage and Immigrant Integration in Sweden: An Exploratory Analysis,” Acta Sociologica 51.4 (2008) ., Stenflo, , Gary A. Cretser, ”Cross-National Marriage in Sweden: Immigration and Assimilation 1971-1993,” Journal of Comparative Family Studies 30.3 (1999) CSA Sociological Abst-racts.
(Cretser 1999), and a very strong tendency of racial homogamy among ethnic Swedes and to some extent Europeans6.
When it comes specifically to attitudes toward intermarriages, some opinion and attitude surveys include questions on intermarriages, such as in IMER researchers Anders Lange and Charles Westin’s study, in Society Opinion Media surveys (SOM7) carried out at Gothenburg University,
and in a questionnaire report by the former Swedish Integration Board, The Integration Barometer (IB). In Lange and Westin’s attitude survey, respondents were asked to choose which relationship they can think of having with persons from thirteen different countries including countries in Europe, Africa, Asia and Middle East. Respondents were to choose the closest relationship one can think of from the following: To have children with, as partner in an intimate relationship, as best friend, as neighbor, in the same residential area, or not even in the same residential area. For persons from Finland, UK, Norway and Germany, the closest relationship respondents could think of having, was to have children with, while for the other groups the closest relationship respondents could think of having was to be best friends with (Lange and Westin 1997).
In SOM survey in 2004, 15% of the respondents have agreed com-pletely or largely to the statement “I would not like having an immigrant from another part of the world married into my family”. This number has decreased from 25% in 1993 (Demker; Demker 2005). In IB 2005, respondents were asked to give answer to the statement “Persons from different culture and race should not build a family and have children8.”
Among some 2572 respondents, 10.4 percent of them agreed to the state-ment, while 88.3 percent disagreed. The percentage of those who have answered “totally agree” dropped from 4.8 percent in 2004 to 3.5 percent in 2005; however, the overall result have not changed significantly since 1999 (Integrationsverket 2006).
Contrary to SOM survey and the Integrationbarometer’s results that show very low number of individuals opposing to intermarriages, some ethnographic studies show that people who are actually involved in interracial or interethnic relationships often seem to meet resistance from the surroundings. Professor of social anthropology Lena Gerholm 6 The tendency of racial homogamy among ethnic Swedes and also among persons of immigrant background is also discussed in Alireza Behtoui, ”Marriage Pattern of Immigrants in Sweden” Journal of Comparative Family Studies 41(2010) .
7 Samhälle opinion medier
writes in an article “Marriage across borders9” that persons who live
with someone of different religion or someone of different skin color express that most of the problems do not exist in their relationship itself but rather in the couples’ relation to the people around. Accord-ing to Gerholm, imagined or perceived differences that people have and believe in works as a scale; the more the partner is perceived to be “dif-ferent” the more “mixed” the marriages are perceived to be. Therefore, a Swedish-Danish marriage is not seen as mixed as a Swedish-Gambian marriage and these couples do not get the same treatments from the sur-roundings. Gerholm also writes that a special apprehension arises in marriages between Muslims and Western women because of the oriental-ism and islamofobia that underlies the stereotypes and negative concep-tion of such marriages (Gerholm 2003). Another social anthropologist Vedad Begovic also discusses the negative attitudes towards certain inter-marriages; depending on which part of the world the person comes from, surroundings’ unwillingness to accept the choice of the partner differs. In the cases where men’s roots are in a country in the third world, distrust towards marriages is bigger and the manifestation has clearer characters (Begovic 2003).
THEORETICAL APPROACH
This study applies Allport’s Contact Hypothesis and Blumer’s Group Posi-tion in trying to understand the attitudes towards interracial dating and marriage. Both theories derive from the aspiration to understand stereoty-pes and prejudice that exist in people’s mind and society.
Admitting that the notion that prejudice would disappear simply by bringing together persons of varying race, ethnicity, or religion is too simple, Allport nevertheless tried to suggest a formula, Contact Hypoth-esis, for easing the problem of prejudice; it has been considered to be a promising and popular tactic for reducing inter-group bias and con-flict for the past fifty years and has attained one of the prominent posi-tions in the research of prejudice and discrimination (Dovidio, Gaertner and Kawakami 2003:15). In short, Contact Hypothesis advocates that the more contact you have with people of different race, ethnicity and culture, the more tolerant you become to these different groups. However, contact cannot just be any kind of contact; Allport’s version of Contact Hypothesis identifies four conditions for optimal contact: The situation inter-group contact occurs must entail equal group status, common goals, cooperation and authority support (Pettigrew 1998:80). Pettigrew, Research Professor 9 Äktenskap över gränser
of Social Psychology, examined Contact Hypothesis using international data and added that potential for friendship is an essential condition for optimal contact and reduction of prejudice. He also concludes that diverse contact can lead to generalized positive feelings towards wide variety of groups (Pettigrew 1997).
Some prior studies in the U.S. answer the question of contact and attitudes; those who have more interracial contact have more posi-tive attitudes than those who do not, therefore tend to intermarry more. For example, Emerson and others studied the effect of prior experiences of interracial contact in schools and neighborhoods on the likelihood as adults to have more racially diverse general social groups and friendship circles. The findings included whites, African Americans and Hispan-ics but not to Asians. It showed that 13 percent of married respondents who had both racially mixed experiences were interracially married com-pared to just 2.5 percent of those who had neither racially mixed experi-ence (Emerson, Kimbro and Yancey 2002). Johnson studies the context of contacts in his thesis on whites’ attitude towards interracial marriages and states that friendship or interracial socializing variable significantly relates to approval of interracial marriage (Johnson 2004). Ellison and Powers’ research indicates that blacks reporting close white friends are consider-ably less hostile toward interracial dating and both childhood and adult interracial contact are inversely related to opposition to interracial dating (Ellison and Powers 1994).
Blumer defined prejudice as a response to a sense of group position. Blumer claims that the process of defining group position first starts with a complex interaction and communication within the members of the domi-nant group. Prestige, power, skills, numbers and opportunities are named as some of the factors that contribute to the formation of group position. Through interacting and communicating within each other, the feelings and meanings become defined as collective image (Blumer 1958:5). One of the important feelings that affect race prejudice is the fear that the subor-dinate group will threaten the position of the dominant group (Blumer 4). Studies show that perception of threat is related to the degree of prejudice (Quillian 1995); moreover some studies illustrate that the majority popula-tion perceives threat depending on the size of the minority or foreign pop-ulation (Taylor 1998; Nagayoshi 2008).
The relevance of the group position theory become obvious in discuss-ing attitude towards interracial relationships: Observdiscuss-ing marriage as a market (Becker 1973), interracial relationship creates perception of com-petition and threat. Moreover, interracial relationships as a phenomenon itself challenges the boundary of the group position and the boundary of
racial majority and minority; the fear and apprehension that the subordi-nate group will threaten the position of the dominant group is fundamen-tally connected to the fear of crossing the racial boundaries.
THE CONCEPT AND OPERATIONALIZATION OF RACE
As Allport argues, visibility plays a decisive role in the perception of the threat, thus development of prejudices and stereotypes, and consequently attitudes (Allport 1979); therefore the importance of discussing attitudes towards interracial marriage in terms of racial differences should be emp-hasized. This is why the study applies the concept of race even though the concept of ethnicity is predominantly used in Swedish context when dis-cussing issues concerning migration and its impact on society. Since ethni-city, or more correctly the country of birth, is often a measure of different immigrant groups in Sweden, the racial groups had to be constructed for the purpose of this study.
In this study race is operationalized as ideal-types as Max Weber sug-gests. He believed reality to be irrational, ambiguous and chaotic, there-fore sociological method is required to understand and explain the social reality (Weber 1949): As a tool to comprehend and see the social reality,
ideal-types are offered. The idea behind is, as Daynes and Lee states, “[t]
he ‘real object’ is distinguished from the ‘object of knowledge’: the former – social reality – can only be analyzed through the latter – a construc-tion (Daynes and Lee 2008:94).” Ideal types should be understood as “a rational construction used to make sense of and explain an irrational reality” (Daynes and Lee 2008:94) and it is a methodological conven-ience (Weber 1978:6). Weber states that ideal types are “not a description of reality but it aims to give unambiguous means of expression to such a description (Weber 1949:90).” Furthermore, an ideal type is not a norma-tive model; the term “ideal” for Weber is not a normanorma-tive judgment which classifies things as better or worse. Ideal, in Weber’s term, is an “abstrac-tion”, an “idea” that enables the sociologist to observe, comprehend and enlighten reality (Daynes and Lee 2008:94).
An ideal type is formed by the one-sided accentuation of one or more points of view and by the synthesis of a great many diffuse, discrete, more or less present and occasionally absent concrete individual phenomena, which are arranged according to those one-sidedly emphasized viewpoints in to a unified analytical construct (Gedankenbild). In its conceptual purity, this mental construct (Gedankenbild) cannot be found empirically anywhere in reality. It is a utopia. (Weber 1949:99)
According to Weber, ideal-types should be constructed from the various combinations of tangible actions and phenomena that form social reality (Daynes and Lee 2008:94). Daynes and Lee states,
The methodological pertinence of the ideal-typical construction is obvious. The empirical data provides the “reality” from which are extracted a certain number of types. These ideal-typical abstrac-tions, in turn, are applied to reality in order to understand and explain it. (Daynes and Lee 95)
Therefore, construction of ideal-types is a relational and circular process; ideal-types are not essential or fixed. In addition, a distinction between the
real object and the meaning or the knowledge of the object cannot be
emp-hasized enough. As Weber states;
[E]very artifact, such as for example a machine, can be understood only in terms of the meaning which is production and use have had or were intended to have; a meaning which may derive from a relation to exceedingly various purposes. Without reference to this meaning such an object remains wholly unintelligible. (Weber 1978:7)
Operationalizing race and constructing racial categories as ideal types thus does not mean that the study essentializes the groups of people who are categorized as specific racial groups, because the racial groups are only an analytical construct and not a reality. It is only a means to understand the social reality through a construction. The following groups are constructed as ideal types for the purpose of this study; the definitions of the groups are given to the survey respondents as the following:
• Adopted African (AA)
• Adopted Latin American (ALA) • Adopted East Asian (AEA)
• African: Those who have their origin from for example Ethiopia,
Ghana, Tunisia and Gambia (A).
• Central/East European: Those who have their origin from for example
former Yugoslavia, Poland and Hungary (CEE).
• Latin American: Those who have their origin from for example Chile,
Uruguay, Argentina and Mexico (LA).
• Middle Easterner: Those who have their origin from for example Iraq,
• Scandinavian10: Those who have their origin from for example Denmark, Norway and Finland (SC).
• South European: Those who have their origin from for example
Greece, Italy, Portugal and Spain (SE).
• South/East Asian: Those who have their origin from for example
Vietnam, Thailand, China and the Philippines (SEA).
• West European: Those who have their origin from for example
Germany, Great Britain, France, USA, Canada and New Zeeland (WE).
In this study, Swedes are defined as those who have two parents who have their origin in Sweden. Throughout the thesis, these groups refer to and include everybody who has their origin from these countries, regardless of if they are born in or outside of Sweden. Studies in Sweden highlight that some of the above groups are often targets of and are not targets of discrimination and racialization in contemporary Swedish society11.
Cate-gories are based only on the assumption of the physical features asso-ciated with the countries of origin as Rooth applies in his study (Rooth 2002). Criticism can be cast if geographical and national origin can define what is called racial category, for example including North America and Oceania in the category West European. The group African can also be seen to be problematic since differences in the religious and social status are large within the area and the countries that I name as examples. I am fully aware of these issues when operationalizing these racial categories. 10 The word Scandinavia has traditionally been used to describe Norway, Sweden and Denmark however some argue for the inclusion of Finland in the definition ”Skandinavien,” Nationalencyklopedin., ”Scandinavia,” Encyclopedia Britannica Online, 2010)., therefore Finland is included in the definition throughout this thesis.
11 See for example Lena Sawyer, ”Routings : ”Race”, African Diasporas and Swedish Belonging,” Transforming Anthropology 11.1 (2002): 13-35,.Viktorija Kalonaityte, Vic-toria Kwesa, and Adiam Tedros, Att Färgas av Sverige: Upplevelser av Diskriminering och Rasism bland Ungdomar med Afrikansk Bakgrund i Sverige, 2007). for African, Catrin Lundström, Svenska latinas : ras, klass och kön i svenskhetens geografi (Göteborg ; Stockholm: Makadam, 2007) 327, ., for Latin American, Ylva Brune, ed., Mörk magi i vita medier : svensk nyhetsjournalistik om invandrare, flyktingar och rasism (Stockholm: Carlsson, 1998) 139, [1], ., Shahram Khosravi, ”Manlighet i Exil: Maskulinitet och Etni-citet hos Iranska Män i Sverige,” Orienten i Sverige : samtida möten och gränssnitt, ed. Simon Ekström and Lena Gerhlm, 1. uppl ed. (Lund: Studentlitteratur, 2006) 77-104, .for Middle Easterners’ experiences, Central/East Europeans are often perceived as the “other” in attitude surveys for example, Anders Lange and Charles Westin, Den Mång-tydiga Toleransen (Stockholm: Centrum för invandringsforskning CEIFO, 1997) 151.
These twelve groups are constructed as a methodological convenience and should function as ideal types on which respondents can evoke meanings from; the purpose of constructing these groups are not to essentialize them or present them as fixed categories.
Adoptees are analyzed as separate groups in this study. Adoptees deviate considerably from other immigrant and racial groups in Sweden, not only in their language ability, cultural background and social networks but also in how people perceive them; adoptees grow up as Swedes with a Swedish sounding name and they are often times treated as Swedes. The only thing that separates them from the majority population is their racial visibility, and there are studies that show that adoptees experience discrimination and racism because of their skin color (Rooth 2002; Rooth 2001; Hübi-nette and Tigervall 2008). Therefore observing attitudes towards the three adopted groups separately have a potential of revealing the underlying atti-tudes towards different racial groups in contemporary Swedish society.
DATA
The data is gathered through a self-reporting, anonymous postal survey in Malmö, Sweden during the period of November 2008 and February 200912.
Excluding the naturally lost cases, a total of 622 (32%) among some 1948 individuals have answered the questionnaire. The majority of the naturally lost cases (N=35) was due to the wrong information on the address, and the rest was reported to be related to being away or moving abroad, physically challenged or sick, or being a non-Swedish speaker. Graph 1 shows the com-parison of the share of persons in each gender and age categories among the total sample and the respondents. It can be seen that female respondents and respondents over the age of 75 are slightly overrepresented compared to the randomly selected 2000 individuals. This, however, is not unique for this survey but is common in other postal surveys as well13.
12 The survey is approved by the regional ethics committee of Sweden. All the practical aspects involved in the survey, from constructing the layout and printing out the questionnaires to sending, scanning and registering the results to SPSS, was carried out by Kinnmark Information AB, which has a broad experience of carrying out surveys for public and private sector. The questionnaire promises respondents confidentiality and anonymity according to the Personal Data Act and Privacy Act strictly. The survey asked a variety of general questions on different racial groups besides the question of interracial dating, marriages, child bearing and amount of contacts. The written language of the survey was in Swedish; questions and state-ments that appear in this article are directly translated from Swedish to English. 13 For example Väst-SOM surveys have seen the same tendency since 1995 Rudolf Antoni, Samhälle opinion massmedia Skåne 2006, 2007), <http://www.som.gu.se/digital Assets/1294/1294465_231-244.pdf>..
Graph 1. Comparison between the respondents and the original sample
The return rate of 32% can be seen as problematic: However, studying some literature on survey methods14 and comparing some social
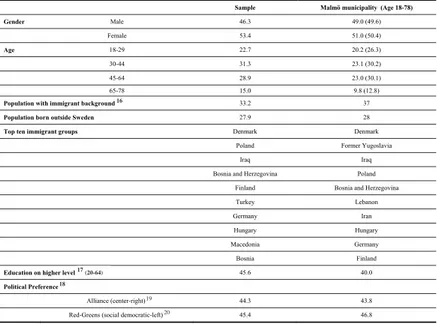
cha-racteristics of the 620 respondents with the whole population of Malmö municipality in 2008 when the survey was carried out, it can be said that respondents reflect the characteristics of the population of Malmö muni-cipality quite sufficiently (Table 1). The sensitive nature and the content of the survey might have affected the response rates, however the low response rates on postal survey is not an issue only for this study, especi-ally in the southern part of Sweden. SOM surveys show that residents of southern Sweden, Scania, show a tendency to answering postal surveys to a lesser extent compared to the other parts of Sweden and this tendency has been getting worse. For example the response rate in Scania was 52% and 51% in 2007 and 2009, while in the west Sweden the rates were 56% and 54% (Antoni 2007; Johansson and Ohlsson 2009)15. A reasonable
explanation to why residents of Scania are less inclined to answer postal 14 For example, Joseph G.P. Paolillo’s experimental study showed that the return rate among those who did not receive any monetary incentive was 36%. Joseph G. P. Paolillo and Peter Lorenzi, ”Monetary Incentives and Mail Questionn-aire Response Rates,” Journal of Advertising 13.1 (1984) <http://www.jstor.org/ stable/4188484>. Shannon and Bradshow’s study on a comparison of response rate of postal and electoral survey conducted among college faculty, they recei-ved 44% from the postal survey. David M. Shannon and Carol C. Bradshaw, ”A Comparison of Response Rate, Response Time, and Costs of Mail and Electronic Surveys,” The Journal of Experimental Education 70.2 (2002) <http://www.jstor. org/stable/20152675>.
15 SOM surveys reach these response rates by sending a notice letter and a survey in seven different occasions, making reminders by contacting the respondents on the telephone on three different occasions, and by sending a shortened version of the survey. Men Women 18-29 30-44 45-64 65+ Total Sample (%) 52,9 47,1 26,9 29,9 29,9 13,4 Respondents (%) 46,3 53,4 22,7 31,3 28,9 15 0 10 20 30 40 50 60
questionnaires could not be found. Considering the different procedure and resources SOM surveys and this survey research have, 32% net return rate is not distrustful. 16, 17181920
Table 1. Descriptive characteristics of the sample compared to the whole of Malmö municipality (%)
16 The percentage for the sample shows the percentage of those who have reported to have at least one parent who has an immigrant background or who have reported to be adopted from other countries, while the percentage for the municipality shows the percentage of those who are born outside of Sweden or have two parents who are born outside of Sweden.
17 The percentage for the sample shows the percentage of those who have reported to have finished above secondary education (college and university), while for the municipality it is the percentage of those who have one or more year of college or university education on under graduate and graduate level.
18 Based on the response to the question which party respondents have voted for in the national election in 2006. Information on municipality is taken from the election report published by the municipality, also based on the national election in 2006 Malmöstad, Valet i Malmö 2006 (Election in Malmö 2006), 2006).. The percentage for the sample eliminates 94 individuals who have answered that they did not vote. 19 Consists of Moderate Party, Center Party, Liberal People’s Party and Christian Democrats.
20 Consists of Social Democrats, Left Party and Green Party.
Table 1. Descriptive characteristics of the sample compared to the whole of Malmö municipality (%)
Sample Malmö municipality (Age 18-78) Gender Male 46.3 49.0 (49.6) Female 53.4 51.0 (50.4) Age 18-29 22.7 20.2 (26.3) 30-44 31.3 23.1 (30.2) 45-64 28.9 23.0 (30.1) 65-78 15.0 9.8 (12.8)
Population with immigrant background1 33.2 37
Population born outside Sweden 27.9 28
Top ten immigrant groups Denmark Denmark Poland Former Yugoslavia
Iraq Iraq
Bosnia and Herzegovina Poland Finland Bosnia and Herzegovina
Turkey Lebanon
Germany Iran
Hungary Hungary
Macedonia Germany
Bosnia Finland
Education on higher level 2(20-64) 45.6 40.0
Political Preference3
Alliance (center-right)4 44.3 43.8
Red-Greens (social democratic-left)5 45.4 46.8
1 The percentage for the sample shows the percentage of those who have reported to have at least one parent who has an
immigrant background or who have reported to be adopted from other countries, while the percentage for the municipality shows the percentage of those who are born outside of Sweden or have two parents who are born outside of Sweden.
2 The percentage for the sample shows the percentage of those who have reported to have finished above secondary education
(college and university), while for the municipality it is the percentage of those who have one or more year of college or university education on under graduate and graduate level.
3 Based on the response to the question which party respondents have voted for in the national election in 2006. Information on
municipality is taken from the election report published by the municipality, also based on the national election in 2006 Malmöstad, Valet i Malmö 2006 (Election in Malmö 2006), 2006).. The percentage for the sample eliminates 94 individuals who have answered that they did not vote.
4 Consists of Moderate Party, Center Party, Liberal People’s Party and Christian Democrats. 5 Consists of Social Democrats, Left Party and Green Party.
16
18 17 (20-64)
19 20
According to the answers reported on the question of immigrant back-ground, 620 individuals are divided into respondents of white European background and non-European background for the purpose of this study. Countries of immigrant background individuals have reported are syste-matically categorized into nine groups21 that appear on the questionnaire;
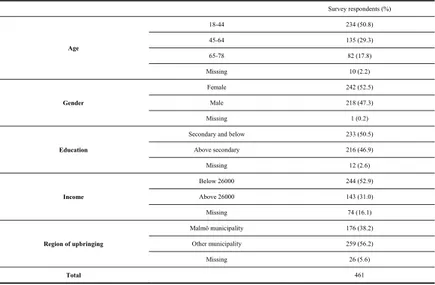
Respondents who have reported that neither one of their parents have an origin in another country than Sweden nor adopted (N=404), and those who have reported an origin in Scandinavia (N=31), Southern Europe (N=6), Western Europe (N=14) including North America, and respon-dents who have reported a mixture of the previously named origin (N=6) are categorized as white European. This article focuses solely on attitudes towards interracial dating and marriage among some 461 white European respondents. The category white European is based only on the assump-tion of the features associated with the countries of origin as Rooth applies in his study (Rooth 2002). It cannot be stressed enough that this cate-gory functions as a methodological convenience in depicting the majority society in Malmö.
Table 2. Background information of the white European survey respondents
21 African, Central/East European, Latin American, Middle Easterner, Scandina-vian, South European, South/East Asian, West European and Swedish. Definition can be found on the Appendix 1 and in the Methodological orientation. Respon-dents who have reported to be adopted are incorporated into the racial categories.
Table 2. Background information of the white European survey respondents
Survey respondents (%) Age 18-44 234 (50.8) 45-64 135 (29.3) 65-78 82 (17.8) Missing 10 (2.2) Gender Female 242 (52.5) Male 218 (47.3) Missing 1 (0.2) Education
Secondary and below 233 (50.5) Above secondary 216 (46.9) Missing 12 (2.6) Income Below 26000 244 (52.9) Above 26000 143 (31.0) Missing 74 (16.1) Region of upbringing Malmö municipality 176 (38.2) Other municipality 259 (56.2) Missing 26 (5.6) Total 461
IMPORTANT BACKGROUND VARIABLES
This study is inspired by Johnson and Jacobson’s study (Johnson and Jacobson 2005) which examines social settings of contact and attitudes towards interracial marriage among white Americans. The background variables that are examined in this article are age, sex, education, region of upbringing and amount of contact.
Age is a crucial variable in relation to general attitudes. In previous studies in Sweden, it is shown that the older population tends to have more negative attitudes towards immigrants compared to the younger population (Lange and Westin 1997; Integrationsverket 2006; Demker 2006; Mella 2007; Mella and Palm 2009; Mella and Palm 2010). Moreover, interracial relationships are more common among the younger population, according to studies in the U.S. (Joyner and Kao 2005). Age is divided into three age categories for the purpose of the analysis: 18 to 44, 44 to 64 and 65 to 78.
The effect of gender on attitudes seems to generate different types of results. In general attitude surveys in Sweden it is commonly known that women express more favorable and tolerant opinions, although the dif-ferences are not always statistically significant (Integrationsverket 2006; Demker 2006; Mella and Palm 2010). However, the picture seems to be different when it comes to attitudes towards interracial marriages. Several prior studies in the U.S. that examine attitudes specifically towards inter-racial marriage among whites show that gender does not affect attitudes towards interracial marriage (Johnson and Jacobson 2005; Hughes and Tuch 2003; Wilson and Jacobson 1995), while other studies show that men are more willing to interracially date than women (Yancey 2009; Yancey 2002; Gardyn 2002; Todd et al. 1992). Moreover Mills and Daly’s study shows that female respondents reports more negative prejudicial attitudes towards interracial relationships than male respondents (Mills and Daly 1995). Hirschl and others’ study showed that marriage enhances the odds of affluence significantly for female and not as significantly for male; there-fore the decision to marry becomes more important to female than male (Hirschl, Altobelli and Rank 2003). In a study which examines gender dif-ferences in desired characteristics when searching for a partner for both short term and long term relationship, the result showed that men focus more on physical attractiveness in general, while women focus more on earning capacity (Stewart, Stinnett and Rosenfeld 2000). In another experi-mental study, women placed greater weight on the intelligence and race of the partner compared to men (Fisman et al. 2006).
Previous studies illustrate that education has a positive correlation to attitudes towards intermarriage (Wilson and Jacobson 1995) and to more favorable and generous attitudes towards immigrants in general (Lange
and Westin 1997; Integrationsverket; Mella 2007). It is also shown that approval of interracial marriage is the highest among college educated persons and actual intermarriage rate is also higher among those who are college educated (Kalmijn 1993). Education is measured as the last educa-tion completed and classified into two categories for the purpose of the analysis: Secondary or below secondary education and above secondary education22.
Region respondents grew up in indicates the amount of non-intimate contact23. Immigration of the different groups analyzed in this study
has taken place predominantly after the 1970s; since Malmö municipal-ity has the highest densmunicipal-ity of foreign population, it can be assumed that the younger respondents who have grown up in Malmö have had more non-intimate interracial contact during childhood than those who grew up outside of Malmö. It can also be speculated that older respondents who have grown up in Malmö have seen the changes the municipality have gone through over the years, from being a Swedish industrial city to a city with the highest concentration of immigrant population. Region of upbringing is of interest to observe not only because of the indication of the amount of previous contacts, but also because of previous studies which shows the correlation of moving from the place of origin and inter-racial marriages. Previous studies in the U.S. in fact show that the geo-graphically urban and mobile population intermarry more (Tucker and Mitchell-Kernan 1990; Rosenfeld and Kim 2005). Even from this perspec-tive, it can be interesting to see if the region respondents grew up in can affect the attitudes towards interracial dating and marriages.
MEASURING THE AMOUNT OF CONTACT
Interracial contacts in this article are measured by the variation of groups that respondents have reported to have contacts with. Respondents were asked to specify maximum three groups24 they have contact with in each
22 In Sweden, secondary education starts from the 9th grade. In secondary
educa-tion, post-secondary education and secondary vocational education are also inclu-ded. College and University education on all levels are counted as above secondary education.
23 Question asks in which municipality respondents spent the longest time up until the age of 18.
24 Alternatives are African, Central/East European, Latin American, Middle Eas-terner, Scandinavian, South European, South/East Asian, West European and Swedes.
given context; including the alternative that indicates contact only with Swedes. The variety of contact is categorized into three groups for the purpose of analysis; no contact, little contact (those who have crossed maximum one group on each question) and large contact (those who have crossed more than one group).
Previous studies in the U.S. illustrate that friendship has a significant effect on attitude towards interracial marriage and actual possibility of intermarrying (Johnson and Jacobson 2005; Emerson, Kimbro and Yancey 2002; Ellison and Powers 1994; Jacobson and Johnson 2006; Levin, Taylor and Caudle 2007; McClintock and Murry 2010). Responses to the following questions are summed and presented as friendship variable for the purpose of the analysis.
1) The friends that I spend most time with are
2) Other acquaintances that I keep in touch with and meet occasionally are 3) Those who I invite home to are
Less intimate contact is measured using two questions. The answers are put together and analyzed as general contact:
4) I remember that I went to elementary school with
5) (Based on your current occupation) Persons that I work/study with are Table 3 shows the summary of the amount of contact respondents have reported on the survey. It shows that over one third of the respondents have general contacts and friendship with someone of white European origin, which includes persons who have origins in Swede, Scandinavia, South and West Europe. Looking at background variables, age has a nega-tive effect and education has higher odds of having interracial contacts.
Table 3. The amount of contact reported by the respondents (N=461)
ANALYSIS
The data is analyzed using SPSS (Statistical Package for the Social Sci-ences). First, descriptive statistics, together with the 95% confidence inter-val, are presented in order to understand and demonstrate the patterns of attitudes towards interracial dating and marriage with different groups. Attitudes towards are measured by the following statements:
1) I can imagine dating someone of the following group. (Dating)
2) I can imagine getting married with someone of the following group. (Marriage)
Respondents were asked to choose one of the four alternatives, agree,
partially agree, partially disagree and disagree (coded 4 to 1) and give an
answer for all the twelve groups, including to the group Swedes.
To further examine attitudes towards interracial dating and marriage, a logistic regression model was executed for each group. Logistic regres-sion model eliminates respondents who have not given answers to all the variables that are analyzed in the model; therefore the number of individu-als analyzed varies according to the questions. As Johnson and Jacobson’s study (Johnson and Jacobson 2005) which examines whites’ social settings of contact and attitudes towards interracial marriage, age, sex, educa-tion, region and amount of contact are analyzed in the logistic regression analysis with the outcome variable of positive/negative attitudes. Survey responses are divided into to two categories, agree (coded 1) and disagree (coded 0). Age and friendship are analyzed as categorical variables. Table 3. The amount of contact reported by the respondents (N=461)
Amount of contact Respondents (%) General Contact Only with white Europeans 149 (32.3)
Little Contact 192 (41.6)
Lots of Contact 98 (21.3)
Missing 22 (4.8)
Friendship Only with white Europeans 182 (39.5)
Little Contact 186 (40.3)
Lots of Contact 87 (18.9)
RESULTS
Attitudes towards interracial dating and marriages
The number of missing cases varies from the minimum of 60 cases and the maximum of 92.Item non-response could occur because respondents might not have enough information to answer the questions, because respondents refuse to answer specific questions, or because respondents skip responding to the questions (Madow 1983:20). Looking at the characteristics of the sample of the missing cases, they are more often among the elder, female, respondents with lower education, those who have no contact with different groups and those who live in a residential area with less immigrants. This may indicate that respondents with higher education and more experience of interacting with different groups are slightly more represented in the sample analyzed.
Graph 2. Descriptive statistics of attitudes towards interracial relations-hips among respondents of white European background(%)
Graph 1. Descriptive statistics of attitudes towards interracial relationships among respondents of white European background(%)
10,6 13,4 11,7 15,2 11,3 15,4 10,8 14,3 15,2 11,1 7,8 5 44,9 50,5 45,6 48,8 38,2 46,2 36,4 39,9 56,2 67 75,1 79 18,4 18,9 18,7 17,1 19,3 18,7 19,7 19,5 17,6 15,4 13 13,2 0 20 40 60 80 100
AA ALA AEA A CEE LA ME SEA SE WE SC SWE
Interracial dating
Disagree Partially Disagree Partially Agree Agree Missing
10,8 13,2 11,9 11,3 14,1 14,5 10,4 13,4 14,3 9,3 8,5 5,9 42,5 48,4 43 36,7 46 44 33,8 38 54,9 65,5 74 78,3 19,3 19,3 19,5 19,7 18,2 19,7 20,2 20 18,4 16,1 13,7 13,2 0 20 40 60 80 100
AA ALA AEA A CEE LA ME SEA SE WE SC SWE
Interracial marriage
The graph 2 shows the descriptive results towards the statement on if respondents can imagine dating or marrying with twelve different groups. It can be noticed that majority of respondents chose the answer alternative agree or disagree and not the more neutral alternatives
parti-ally. It is also clear that the majority of respondents can imagine dating
and marrying interracially; however the preferences of different groups are obvious. Scandinavian received the most positive responses towards the three statements together with West European and South European followed by Adopted Latin American, Central/East European and Latin American. Adopted East Asian, Adopted African and South/East Asian are in the middle and African and Middle Easterner obtained the least positive response.
Graph 3 shows the mean of the responses together with 95% confi-dence interval; the closer the mean is to 4, the more positive the response is. In the graph, it can be observed that respondents are slightly more positive towards interracial dating than marriage, although the difference is not statistically conclusive. Another noticeable result is that the differ-ences in responses between the adopted and non-adopted groups are not statistically conclusive consulting the 95% confidence interval.
Graph 3. Attitudes towards interracial relationships among respondents of white European background (black lines showing 95% confidence interval)
Graph 2. Attitudes towards interracial relationships among respondents of white European background (black lines showing 95% confidence interval)
ME A SEA AA AEA LA CEE ALA SE WE SC SWE Dating 2,78 2,87 3,00 3,03 3,08 3,19 3,23 3,28 3,47 3,67 3,79 3,86 Marriage 2,70 2,80 2,93 2,97 3,02 3,12 3,15 3,21 3,45 3,61 3,78 3,86 0 0,5 1 1,5 2 2,5 3 3,5 4 Negative -P ositive
Effect of different variables
The tables 4 and 5 show the results of the logistic regression analysis on attitudes towards interracial dating and marriage. Respondents belong-ing to the age 45 and above have higher odds of respondbelong-ing negatively to the statement on interracial dating and marriage compared to respondents of the younger age category. Although not always statistically significant, gender give higher odds of answering to the statement more positively; men have conclusively higher odds of answering to the statement on interracial dating and marriage positively towards Adopted East Asians, Central/East European, Latin American, Middle Easterner and South/ East Asian. Respondents who have reported to have completed above secondary education have around 1.5 to 2.5 times higher odds of answe-ring that they can imagine marrying a person of another origin. Region of upbringing and friendship show effect on attitudes towards interracial dating and marriage positively. Respondents growing up outside of munici-pality show around two to three times higher odds of answering to the sta-tement more positively. Respondents who have reported friendship have, depending on the amount of contact, roughly three to eight times more odds of being positive towards interracial marriage; the amount of friend-ship shows the highest odds of answering to the statement more positively. General contact does not show any statistically conclusive effect on attitu-des towards interracial marriages.
T
able 4. Logistic Regression: Attitudes towards interracial dating and the effect of different variables and contact
Tabl e 4. L og is tic R eg re ss io n: A tti tu de s t ow ar ds in te rr ac ia l d at in g an d th e ef fe ct o f d iff er en t v ar ia bl es a nd c on ta ct In te rr ac ia l (N =3 26 ) A A (N =3 39 ) A LA (N =3 37 ) A EA (N =3 38 ) A (N =3 37 ) CEE (N =3 45 ) LA (N =3 38 ) M E (N =3 35 ) SE A (N =3 36 ) EXP(B) (95% C. I.) EXP(B) (95% C. I.) EXP(B) (95% C. I.) EXP(B) (95% C. I.) EXP(B) (95% C. I.) EXP(B) (95% C. I.) EXP(B) (95% C. I.) EXP(B) (95% C. I.) EXP(B) (95% C. I.) Age 18 -4 4 RE FE RE N CE 45 -6 4 0. 50 (0 .2 8-0. 90 )* * 0. 44 (0 .2 4-0. 80 )* * 0. 41 (0 .2 0-0. 81 )* * 0. 60 (0 .3 3-1. 09 )* 0. 56 (0 .3 2-0. 99 )* 0. 50 (0 .2 6-0. 97 )* * 0. 61 (0 .3 2-1. 16 ) 0. 52 (0 .3 0-0. 92 )* * 0. 72 (0 .4 0-1. 30 ) 65 -7 8 0. 68 (0 .2 7-1. 69 ) 0. 30 (0 .1 2-0. 72 )* * 0. 24 (0 .0 9-0. 61 )* ** 0. 40 (0 .1 7-0. 93 )* * 0. 44 (0 .1 9-1. 02 )* 0. 27 (0 .1 1-0. 68 )* * 0. 22 (0 .0 9-0. 55 )* ** 0. 27 (0 .1 1-0. 64 )* ** 0. 47 (0 .1 9-1. 14 )* Se x (W om en ) 1. 98 (1 .1 9-3. 31 )* * 1. 32 (0 .7 9-2. 22 ) 1. 64 (0 .9 0-2. 99 ) 2. 05 (1 .2 2-3. 44 )* * 1. 35 (0 .8 3-2. 18 ) 2. 15 (1 .2 2-3. 81 )* * 1. 86 (1 .0 6-3. 27 )* * 1. 75 (1 .0 8-2. 58 )* * 2. 71 (1 .6 1-4. 58 )* ** Ed uc at io n (B el ow seconda ry) 2. 15 (1 .2 8-3. 59 )* ** 2. 39 (1 .4 2-4. 05 )* ** 1. 57 (0 .8 6-2. 88 ) 1. 96 (1 .1 7-3. 29 )* * 1. 99 (1 .2 3-3. 22 )* * 1. 66 (0 .9 4-2. 94 )* 1. 68 (0 .9 6-2. 96 )* 1. 54 (0 .9 4-2. 50 )* 1. 95 (1 .1 7-3. 26 )* * Regi on (M al m ö) 2. 64 (1 .5 5-4. 48 )* ** 2. 44 (1 .4 4-4. 15 )* ** 1. 81 (0 .9 8-3. 33 )* 1. 71 (1 .0 0-2. 90 )* 2. 03 (1 .2 3-3. 34 )* * 1. 89 (1 .0 6-3. 37 )* * 1. 98 (1 .1 2-3. 52 )* * 1. 66 (1 .0 0-2. 76 )* * 2. 16 (1 .2 7-3. 69 )* ** G en er al C on ta ct No Contact REFEREN CE Li tt le Co nt ac t 0. 97 (0 .4 9-1. 90 ) 0. 88 (0 .4 4-1. 73 ) 0. 80 (0 .3 7-1. 69 ) 1. 10 (0 .5 7-2. 11 ) 0. 84 (0 .4 4-1. 59 ) 0. 83 (0 .4 0-1. 71 ) 0. 67 (0 .3 2-1. 37 ) 0. 69 (0 .3 7-1. 31 ) 1. 64 (0 .8 5- 3-15 ) So m e Co nt ac t 0. 68 (0 .3 0-1. 56 ) 0. 48 (0 .2 0-1. 13 ) 0. 70 (0 .2 5-1. 92 ) 1. 00 (0 .4 3-2. 29 ) 0. 58 (0 .2 6-1. 27 ) 0. 44 (0 .1 7-1. 11 ) 0. 53 (0 .2 1-1. 34 ) 0. 63 (0 .2 8-1. 39 ) 1. 42 (0 .6 3-3. 23 ) Friendship Contact No Contact REFEREN CE Li tt le Co nt ac t 4. 42 (2 .3 7-8. 21 )* ** 4. 31 (2 .3 1-8. 04 )* ** 4. 93 (2 .4 4-9. 96 )* ** 2. 76 (1 .5 2-5. 03 )* ** 3. 28 (1 .8 4-5. 83 )* ** 4. 33 (2 .2 3-8. 40 )* ** 3. 92 (2 .0 5-7. 48 )* ** 4. 15 (2 .3 1-7. 46 )* ** 3. 05 (1 .6 7-5. 58 )* ** So m e Co nt ac t 4. 35 (1 .9 1-9. 91 )* ** 3. 97 (1 .7 1-9. 19 )* * 4. 69 (1 .6 8-13 .0 8) ** * 2. 94 (1 .2 7-6. 80 )* * 3. 98 (1 .8 3-8. 69 )* ** 6. 13 (2 .2 9-16 .4 6) ** * 7. 00 (2 .5 5-19 .2 3) ** * 5. 54 (2 .5 0-12 .2 5) ** * 2. 61 (1 .1 6-5. 88 )* * ** * p< 0. 01 * * p< 0. 05 * p <0 .1
T
able 5. Logistic Regression: Attitudes towards interracial marriage and the effect of different variables and contact
Tabl e 5. L og is tic R eg re ss io n: A tti tu de s t ow ar ds in te rr ac ia l m ar ria ge a nd th e ef fe ct o f d iff er en t v ar ia bl es a nd c on ta ct In te rraci al (N =3 25 ) AA (N =3 36 ) ALA (N =3 36 ) AEA (N =3 35 ) A (N =3 35 ) CEE (N =3 40 ) LA (N =3 33 ) M E (N =3 33 ) SEA (N =3 34 ) EXP(B) (95% C. I.) EXP(B) (95% C. I.) EXP(B) (95% C. I.) EXP(B) (95% C. I.) EXP(B) (95% C. I.) EXP(B) (95% C. I.) EXP(B) (95% C. I.) EXP(B) (95% C. I.) EXP(B) (95% C. I.) Age 18-4 4 RE FE RE N CE 45 -6 4 0. 45 (0 .2 6-0. 80 )* * 0. 45 (0 .2 4-0. 81 )* * 0. 48 (0 .2 5-0. 93 )* * 0. 75 (0 .4 1-1. 36 ) 0. 52 (0 .2 9-0. 91 )* * 0. 51 (0 .2 7-0. 96 )* * 0. 54 (0 .2 9-1. 02 )* 0. 52 (0 .3 0-0. 92 )* * 0. 66 (0 .3 7-1. 19 ) 65 -7 8 0. 42 (0 .1 7-1. 05 )* 0. 30 (0 .1 2-0. 74 )* * 0. 35 (0 .1 4-0. 91 )* * 0. 47 (0 .2 0-1. 15 ) 0. 49 (0 .2 1-1. 18 ) 0. 32 (0 .1 3-0. 81 )* * 0. 33 (0 .1 3-0. 82 )* * 0. 26 (0 .1 1-0. 64 )* ** 0. 35 (0 .1 4-0. 87 )* * Se x (W om en ) 1. 58 (0 .9 5-2. 62 )* 0. 99 (0 .5 9-1. 64 ) 1. 10 (0 .6 2-1. 94 ) 1. 51 (0 .9 0-2. 51 ) 1. 22 (0 .7 5-1. 98 ) 1. 76 (1 .0 2-3. 03 )* * 1. 97 (1 .1 3-3. 41 )* * 1. 94 (1 .1 9-3. 16 )* * 2. 23 (1 .3 3-3. 72 )* ** Ed uc at io n (B el ow seconda ry) 2. 22 (1 .3 4-3. 68 )* ** 2. 58 (1 .5 3-4. 35 )* ** 1. 79 (1 .0 0-3. 19 )* 2. 47 (1 .4 7-4. 13 )* ** 1. 94 (1 .1 9-3. 15 )* * 2. 02 (1 .1 6-3. 50 )* * 1. 89 (1 .0 9-3. 28 )* * 1. 53 (0 .9 4-2. 48 )* 2. 23 (1 .3 3-3. 72 )* ** Regi on (M al m ö) 2. 29 (1 .3 6-3. 86 )* ** 2. 65 (1 .5 7-4. 48 )* ** 2. 35 (1 .3 1-4. 32 )* ** 2. 17 (1 .2 8-3. 68 )* ** 2. 11 (1 .2 8-3. 49 )* ** 1. 96 (1 .1 3-3. 42 )* * 1. 89 (1 .0 8-3. 30 )* * 1. 88 (1 .1 3-3. 12 )* * 2. 37 (1 .4 0-4. 01 )* ** G en er al C on ta ct No Contact REFEREN CE Li tt le Co nt ac t 0. 89 (0 .4 6-1. 74 ) 0. 96 (0 .4 9-1. 88 ) 1. 03 (0 .5 0-2. 14 ) 1. 34 (0 .7 0-2. 59 ) 0. 95 (0 .5 0-1. 81 ) 0. 90 (0 .4 5-1. 81 ) 0. 75 (0 .3 7-1. 51 ) 0. 69 (0 .3 7-1. 32 ) 1. 53 (0 .8 1-2. 92 ) So m e Co nt ac t 0. 67 (0 .2 9-1. 53 ) 0. 52 (0 .2 2-1. 22 ) 0. 69 (0 .2 7-1. 79 ) 1. 04 (0 .4 6-2. 39 ) 0. 56 (0 .2 5-1. 24 ) 0. 37 (0 .1 5-0. 91 )* * 0. 48 (0 .1 9-1. 17 ) 0. 65 (0 .3 0-1. 43 ) 1. 07 (0 .4 8-2. 41 ) Fr ie nd sh ip C on ta ct No Contact REFEREN CE Li tt le Co nt ac t 4. 07 (2 .2 1-7. 47 )* ** 3. 82 (2 .0 6-7. 09 )* ** 3. 97 (2 .0 4-7. 73 )* ** 2. 55 (1 .4 1-4. 63 )* ** 3. 86 (2 .1 6-6. 90 )* ** 4. 16 (2 .2 0-7. 85 )* ** 3. 87 (2 .0 6-7. 27 )* ** 4. 04 (2 .2 4-7. 27 )* ** 2. 86 (1 .5 7-5. 21 )* ** So m e Co nt ac t 3. 53 (1 .5 9-7. 81 )* ** 3. 28 (1 .4 4-7. 48 )* * 4. 92 (1 .7 9-13 .5 1) ** * 2. 97 (1 .2 8-6. 86 )* * 4. 30 (1 .9 7-9. 37 )* ** 7. 57 (2 .8 6-20 .0 1) ** * 8. 05 (2 .9 8-21 .7 3) ** * 5. 37 (2 .4 6-11 .7 3) ** * 3. 33 (1 .4 7-7. 57 )* **
DISCUSSION
Different attitudes towards different groups
The result shows that the majority of respondents of white European background are positive towards interracial dating, marriage and child-bearing; when looking at groups other than Scandinavian, West European and South European, Central/East Europeans and Latin Americans are the most preferred while Middle Easterner is the least preferred as a mar-riage partner. As Kalmijn states, the results point out that in the eyes of the white European respondents there might be “a prestige hierarchy of social groups, with the native majority perceived as higher than the various immigrant groups”(Kalmijn and van Tubergen 378).
The fact that respondents of white European background prefer someone of Scandinavian, West and South European origin was expected since it can be considered as racial homogamy; moreover, statistics on intermarriage among Swedes also shows that most of the intermarriage involves someone of Scandinavian and West European background (Stenflo 2001; Cretser 1999). Furthermore, previous research has shown that the closest relationships Swedes can imagine having with the given groups are to have children with (Lange and Westin 1997). Having in mind that inter-racial marriage challenges the group positions and boundary of us and
them, it may not be startling that respondents prefer a person who belongs
to groups that they feel the least threat to and the least social differences as a person to date or marry. In previous attitude surveys in Sweden, it is shown that Central/East Europeans and Latin Americans are perceived to be culturally closer to Swedes compared to South/East Asian, African and Middle Easterner (Lange and Westin 1997; Mella and Palm 2009; Mella et al. 2007). Moreover, Malmö municipality has one of the most segregated residential areas in Sweden, where a large number of residents of Middle Eastern background live. Recent media focus on the Middle East and Islam after 9.11 and national media reports associated with crime, together with the residential segregation may have fostered the feeling of threat towards persons of Middle Eastern background25.
The almost nonexistent differences between the attitudes towards adopted groups and the equivalent non-adopted groups are inquired further in the qualitative analysis which is forth coming. Considering the cultural preference in selecting a marriage partner, the result is perplexing since adoptees are culturally identical with Swedes. The case of adoptees 25 For studies on media representation of immigrants, see Brune, 139, [1], Ylva Brune, Nyheter från gränsen: tre studier i journalistik om ”invandrare”, flyktingar och rasistiskt våld (Göteborg: Institutionen för journalistik och masskommunikation, Univ., 2004) 396, ..
highlights the need to research the role of race and visible differences in Sweden.
Effect of background variables
Examining the effect of background variables on attitudes towards inter-racial relationships among the respondents of white European back-ground, the result of logistic regression analysis shows that age, education and gender have an effect on attitudes towards interracial relationships. Having in mind that the number of individuals analyzed in this study is limited, and considering that statistically conclusiveness is observed much less with smaller sample, and only observed when the effects are very strong, the statistically significant results obtained here should be discussed with confidence.
The negative effect of age can be observed for almost all groups; this corresponds with results of prior attitude surveys (Lange and Westin 1997; Integrationsverket 2006). The level of education, as in prior studies, also has demonstrated positive effect on attitudes towards interracial dating and marriages (Johnson and Jacobson 2005; Wilson and Jacobson 1995; Kalmijn 1993; Tucker and Mitchell-Kernan 1990). Education has a poten-tial of offering interracial contacts which contain all the four conditions to achieve an optimal contact.
Prior surveys on attitudes towards interracial marriage in the U.S. show various results when it comes to statistically significant differences in response between the genders (Johnson and Jacobson 2005; Hughes and Tuch 2003; Wilson and Jacobson 1995; Yancey 2009; Yancey 2002; Mills and Daly 1995). General studies on mate selection shows that women place more focus on race compared to men (Stewart, Stinnett and Rosenfeld 2000; Fisman et al. 2006): A qualitative study by Frank-enberg indicated that women are more concerned with racial boundaries in marriage, especially when the racial groups are seen as different and stigmatized (Frankenberg 1993). In this study, men have answered more positively towards interracial relationships in general compared to women. Considering that marriage may enhance the odds of affluence significantly for women and not as significantly for men, and consequently the deci-sion to marry becomes more important for women than for men (Hirschl, Altobelli and Rank 2003), women may rationally prefer to date and marry someone from the same background, considering the different groups’ per-ceived socioeconomic status; this rationality might have affected the way female respondents answered the questionnaire. The gender differences in attitudes and the actual number and pattern of interracial marriages in Sweden may have a correlation as well. Previous studies which try to map
the patterns of intermarriages in Sweden show that men intermarry more than women (Stenflo 2001; Cretser 1999). It can be inferred that attitudes among men are more positive because the actual practice is more common and accepted among men.
In explaining gender differences in the answers towards interracial mar-riage with Middle Eastern and South East Asian, gendered stereotypes and prejudices towards the two groups should be named as one of the under-lying reasons. Numerous respondents have expressed ideas of “immi-grant male” connected to Islam and gender inequality on the commentary section of the questionnaire. The image of immigrant men is often times connected to “problems”, “crime”, “traditional” or “honor culture” in Swedish media (Brune 2004). Male Muslim immigrants in Sweden are often times associated with a primitive masculinity associated with crimes against women and a threat against Swedish values and norms (Khos-ravi 2006). It is not strange to assume that the above Muslim and immi-grant male stereotypes are applied on Middle Easterners and affect female respondents’ attitudes towards the given group. In Western societies, Asian women has been portrayed as exotic, submissive and sexually available while Asian men are attached with asexual stereotypes (Nagel 2003); this can be one of the underlying factors of women answering more negatively and male answering more positively towards interracial marriage with South East Asians. Structural factor, such as the gender disparity of South East Asians in Malmö can also be an explaining factor; the majority of immigrants from South East Asia consists of women (Malmöstad).
Non-intimate contact and importance of friendship
This study applies Contact Hypothesis and examines how the amount of previous interracial contact affects attitudes towards interracial relations-hip. Looking specifically at what types of contact affect attitudes towards interracial marriages, the importance of intimate contact became obvious.
General contact, contact during elementary school years and current contact at workplace or the place of study, does not show any significant effect on attitudes towards interracial relationships; rather general contact shows a tendency of affecting attitudes negatively. This corresponds to Johnson and Jacobson’s study in the US which showed that workplace was not related to attitudes towards interracial marriage (Johnson and Jacob-son 2005). Moreover, Nagayoshi’s study also point to the negative effect of superficial contact (Nagayoshi 2008). It can be argued that general contact does not fulfill the conditions for the optimal contact that Allport originally has claimed: The situation where intergroup contact occurs must entail equal group status, common goals, cooperation and authority
support. The context of general contact that is analyzed here, elementary school setting and workplace, encompass a competitive nature to some extent, which may foster the feeling of threat and can affect the attitudes towards interracial marriages negatively.
As prior studies show, interracial contact through friendship affects attitudes towards interracial marriage positively; the effect of friendship remains strong even after other significant variables such as age, educa-tion and region of upbringing are added into the model. Since this is not an experimental study, the selection process cannot be controlled for: However, it is very clear that individuals who have reported to have friend-ship with various groups show higher odds of positively responding to the statement on interracial relationships, compared to individuals who have reported no contact with other groups than Swedes. Since the amount of contact was measured according to the number of groups respondents reported to have contact with, this study indicates that having friends of different groups can lead to more tolerance and positive attitudes towards interracial dating and marriage in general, although a further analysis is required on this point.
The region of upbringing shows a strong correlation with attitudes towards interracial dating and marriage. Growing up in Malmö municipal-ity should indicate more frequent contact with persons of different groups, especially among younger generations; therefore it was assumed that respondents who have reported to have grown up in Malmö municipal-ity would be more positive towards interracial marriages than respondents who grew up outside of Malmö. The results show the opposite, however, that respondents who reported to have grown up outside Malmö have notably higher odds of giving a positive answer on interracial dating and marriages. This might be explained by the type of contact respondents who grew up in Malmö. Experiences might have been of the non-intimate nature; respondents who grew up in Malmö may not have had contacts that reflect the four conditions for an optimal contact, equal group status, common goals, cooperation and authority support, which encourage posi-tive attitudes and reduce prejudice and stereotypes. Nagayoshi’s study in Japan shows that superficial contact such as seeing immigrants does not necessarily encourage positive attitudes (Nagayoshi 2008). The result can also be understood from the perspective of group position. For persons growing up in Malmö, observing the increase in immigration may have fostered a feeling of threat, as Berg’s study in the US shows (Berg 2007), and consistent superficial contacts affected attitudes negatively. Respond-ents who have grown up in Malmö municipality might have experienced negative feelings concerning the material condition, privilege and
advan-tages as a result of an increasing number of foreign population and as a result of accumulated superficial contact. A fear and suspicion that the growing immigrant groups would undermine the majority society might have developed a basis of group position and prejudices among respond-ents who have grown up in Malmö, which may affect the attitudes towards interracial dating and marriages. Trying to find an explanation in other aspects than the amount of contact and group position, the result may be a reflection of the studies carried out in the US that show a ten-dency of increase in interracial marriage for young persons who are geo-graphically mobile (Tucker and Mitchell-Kernan 1990; Rosenfeld and Kim 2005).
CONCLUSION
This paper presents the preliminary findings of the ongoing research on attitudes towards interracial relationships; attitudes towards different groups and the effect of interracial contact on attitudes are examined by applying Contact Hypothesis and perception of threat as a theore-tical frame. The results show that the majority of 461 white European respondents who have answered the questionnaire can imagine marrying interracially; attitudes vary depending on different groups. Examining the relationship between different variables, age, education, gender, and region respondents grew up in affect attitudes towards interracial dating and marriage together with the amount of contact related to friendship. Among all the background variables analyzed in the logistic regression analysis, friendship has the strongest effect on attitudes. This study also points out that friendship with variety of different racial groups, and not with a specific group, can result in more positive attitudes towards inter-racial marriage in general.
This is preliminary results therefore continued further analysis is required. The qualitative inquiries that follow this quantitative result explore the questions that are unanswered, for example the position of adoptees in Sweden and the relation between the amount of contact and the idea of group position.